- Briarwood, Desoto homes for sale
- Creek Tree Estates, Desoto homes for sale
- Dewberry Park, Lancaster homes for sale
- Frost Farms, Desoto homes for sale
- Hampton Place, Desoto homes for sale
- Hilltop Estates, Duncanville homes for sale
- Hollywood Park, Duncanville homes for sale
- Meadowbrook Estates, Desoto homes for sale
- Mockingbird Hill, Desoto homes for sale
- Nebe & UHL Estates, Dallas homes for sale
- Pleasant Run, Lancaster homes for sale
- Silver Creek, Duncanville homes for sale
- Silver Creek Crossing, Desoto homes for sale
- South Meadows, Desoto homes for sale
- Stillwater Canyon, Desoto homes for sale
- Ten Mile Creek Estates, Desoto homes for sale
- Thorntree, Desoto homes for sale
- Waterford Oaks, Cedar Hill homes for sale
- Windmill Hill, Desoto homes for sale
- Windsor Park, Cedar Hill homes for sale
Desoto, TX - homes for sale
296 of 296 results displayed
- New
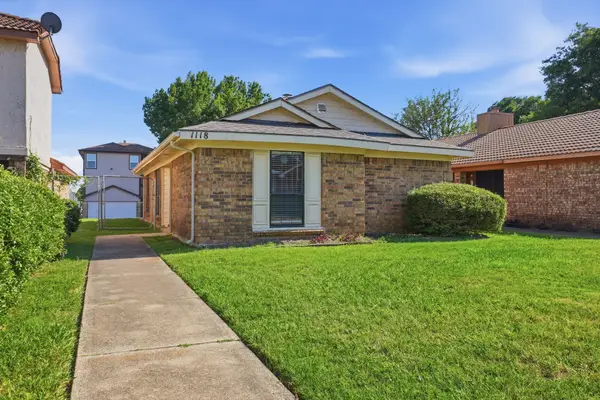 $242,110Active3 beds 2 baths1,330 sq. ft.
1118 Sandalwood Lane, DeSoto, TX 75115
MLS# 21253908Listed by: MAINSTAY BROKERAGE LLC - New
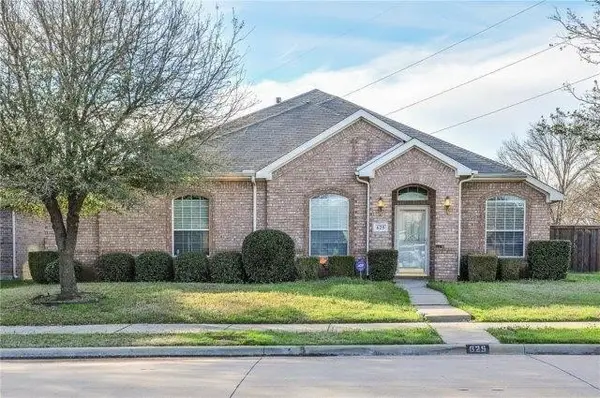 $285,000Active3 beds 3 baths2,387 sq. ft.
625 Belclaire Terrace, DeSoto, TX 75115
MLS# 21304028Listed by: THE MICHAEL GROUP - Open Sat, 2 to 4pmNew
 $439,000Active5 beds 4 baths3,547 sq. ft.
1516 Registry Drive, DeSoto, TX 75115
MLS# 21301090Listed by: BRIXSTONE REAL ESTATE - New
 $415,000Active4 beds 3 baths3,392 sq. ft.
728 Snapdragon Lane, DeSoto, TX 75115
MLS# 21301653Listed by: HOMESMART - New
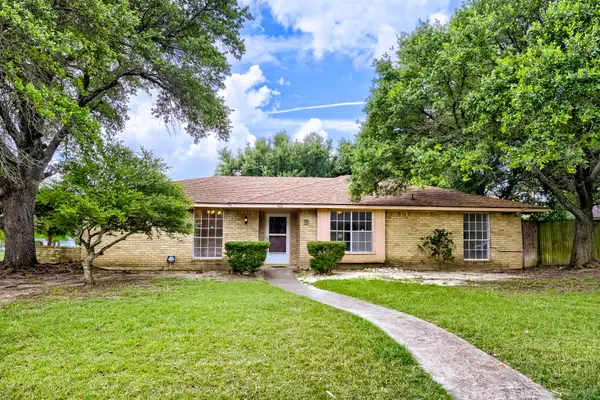
 $269,900Active3 beds 2 baths1,903 sq. ft.
1039 Oak Meadow Lane, DeSoto, TX 75115
MLS# 21296923Listed by: EXP REALTY, LLC - Open Sun, 2 to 4pmNew
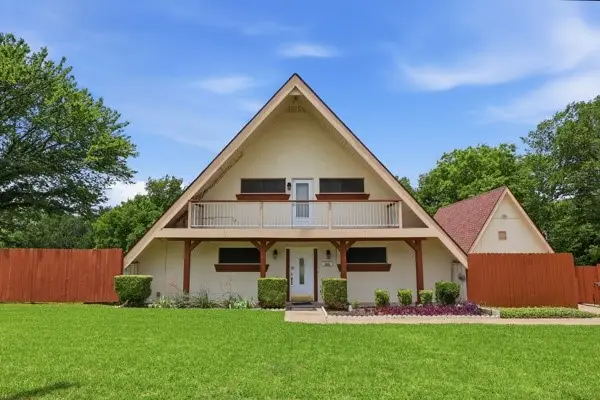
 $269,900Active3 beds 2 baths1,393 sq. ft.
119 N Beltwoods Drive, DeSoto, TX 75115
MLS# 21300476Listed by: PARAGON, REALTORS - New
 $300,000Active3 beds 2 baths1,612 sq. ft.
508 Stony Creek Drive, DeSoto, TX 75115
MLS# 21264052Listed by: KELLER WILLIAMS REALTY - New
 $395,000Active4 beds 3 baths3,259 sq. ft.
933 Ginger Trail, DeSoto, TX 75115
MLS# 21293349Listed by: ORCHARD BROKERAGE - New
 $325,000Active4 beds 3 baths2,520 sq. ft.
205 Roaring Springs Drive, DeSoto, TX 75115
MLS# 21301682Listed by: MONUMENT REALTY - New
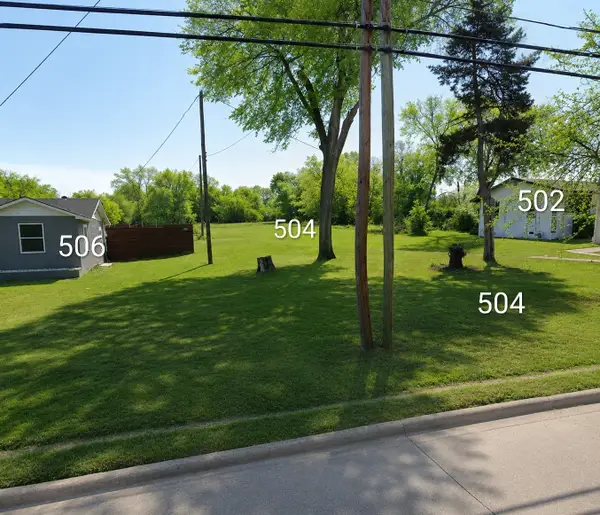 $300,000Active1.48 Acres
504 N Hampton Road, DeSoto, TX 75115
MLS# 21302001Listed by: VIP REALTY - New
 $189,000Active3 beds 1 baths1,140 sq. ft.
640 E Pleasant Run Road, DeSoto, TX 75115
MLS# 21301143Listed by: SOLVENT REALTY GROUP - New
 $274,900Active3 beds 2 baths1,554 sq. ft.
425 Alpine Drive, DeSoto, TX 75115
MLS# 21300186Listed by: FATHOM REALTY LLC - New
 $296,700Active4 beds 3 baths2,600 sq. ft.
1442 Marlene Place, DeSoto, TX 75115
MLS# 21299912Listed by: EXP REALTY LLC - New
 $215,000Active4 beds 2 baths2,136 sq. ft.
504 Hidden Meadow Court, DeSoto, TX 75115
MLS# 21296541Listed by: ENTERA REALTY LLC - New
 $544,000Active4 beds 4 baths3,008 sq. ft.
917 Longmeadow Lane, DeSoto, TX 75115
MLS# 21296939Listed by: RE/MAX ARBORS - New
 $389,900Active3 beds 3 baths2,095 sq. ft.
1408 Frenchmans Drive, DeSoto, TX 75115
MLS# 21297474Listed by: SUMMIT COVE REALTY, INC. - New
 $549,990Active4 beds 3 baths2,752 sq. ft.
940 Homestead Drive, DeSoto, TX 75115
MLS# 21298003Listed by: VISIONS REALTY & INVESTMENTS - New
 $539,979Active4 beds 3 baths2,250 sq. ft.
841 Yellowstone Lane, DeSoto, TX 75115
MLS# 21298058Listed by: VISIONS REALTY & INVESTMENTS - New
 $345,000Active3 beds 3 baths1,742 sq. ft.
813 Misty Glen Drive, DeSoto, TX 75115
MLS# 21298078Listed by: ONLY 1 REALTY GROUP DALLAS - New
 $359,000Active4 beds 3 baths2,302 sq. ft.
1201 Goffin Drive, DeSoto, TX 75115
MLS# 21286240Listed by: WILLIAM DAVIS REALTY - New
 $399,900Active4 beds 3 baths2,372 sq. ft.
732 Forest Creek, DeSoto, TX 75115
MLS# 21296126Listed by: KELLER WILLIAMS REALTY DPR - New
 $300,000Active3 beds 2 baths1,985 sq. ft.
1047 Westlake Drive, DeSoto, TX 75115
MLS# 21291344Listed by: MONUMENT REALTY - New
 $290,000Active3 beds 2 baths1,837 sq. ft.
620 Nora Lane, DeSoto, TX 75115
MLS# 21293338Listed by: KELLER WILLIAMS REALTY - New
 $234,999Active3 beds 2 baths1,522 sq. ft.
1217 Finch Drive, Keene, TX 76059
MLS# 21296489Listed by: TURNER MANGUM,LLC - New
 $515,000Active4 beds 3 baths2,804 sq. ft.
824 State Street, DeSoto, TX 75115
MLS# 21294867Listed by: ULTIMA REAL ESTATE - New

 $235,000Active3 beds 2 baths1,277 sq. ft.
119 Larchbrook Drive, DeSoto, TX 75115
MLS# 21294730Listed by: CENTURY 21 JUDGE FITE CO.- DECATUR  $375,340Active3 beds 2 baths1,742 sq. ft.
1462 Canterbury Trail, DeSoto, TX 75115
MLS# 21292188Listed by: CENTURY 21 MIKE BOWMAN, INC. $336,900Active3 beds 3 baths1,885 sq. ft.
816 Misty Glen Drive, DeSoto, TX 75115
MLS# 21292679Listed by: UNITED REAL ESTATE $305,900Active4 beds 2 baths1,878 sq. ft.
431 Tate Drive, DeSoto, TX 75115
MLS# 21283443Listed by: TEXAS LEGACY REALTY- Open Sat, 1:13 to 2:53pm
 $350,000Active4 beds 2 baths2,338 sq. ft.
1516 Cripple Creek Court, DeSoto, TX 75115
MLS# 21288235Listed by: FIELDHOUSE REALTY GROUP PARTNERS, LLC  $295,000Active4 beds 2 baths2,227 sq. ft.
649 Canyon Place, DeSoto, TX 75115
MLS# 21286753Listed by: REFIND REALTY DFW $510,000Active4 beds 4 baths3,278 sq. ft.
1017 Vista Lane, DeSoto, TX 75115
MLS# 21291224Listed by: COMPASS RE TEXAS, LLC $280,000Active3 beds 2 baths1,707 sq. ft.
705 Priscilla, DeSoto, TX 75115
MLS# 21292416Listed by: REFIND REALTY DFW $275,000Active3 beds 2 baths1,865 sq. ft.
224 W Lanett Drive, DeSoto, TX 75115
MLS# 21291948Listed by: LEGACY BUYER PARTNERS $450,000Active2 beds 2 baths1,905 sq. ft.
412 Spinner Road, DeSoto, TX 75115
MLS# 21291967Listed by: BERKSHIRE HATHAWAYHS PENFED TX $630,000Active5 beds 5 baths3,917 sq. ft.
1013 Chickasaw Drive, DeSoto, TX 75115
MLS# 21292213Listed by: KELLER WILLIAMS REALTY DPR $315,000Active3 beds 2 baths1,524 sq. ft.
1037 Whitewater Trail, DeSoto, TX 75115
MLS# 21281896Listed by: NORVELL & CO LLC $265,000Active3 beds 2 baths1,606 sq. ft.
426 Brook Hollow Circle, DeSoto, TX 75115
MLS# 21291498Listed by: CENTURY 21 JUDGE FITE CO. $430,000Active4 beds 3 baths3,258 sq. ft.
1736 Blue Stream Drive, DeSoto, TX 75115
MLS# 21291565Listed by: COLDWELL BANKER REALTY $350,000Active3 beds 2 baths2,007 sq. ft.
1420 Inks Drive, DeSoto, TX 75115
MLS# 21291152Listed by: DANIELLE SCOTT, BROKER $575,000Active4 beds 4 baths3,567 sq. ft.
636 Bent Creek Drive, DeSoto, TX 75115
MLS# 21290476Listed by: COUCH REALTY, INC. $255,000Active3 beds 2 baths1,540 sq. ft.
1012 Opal Drive, DeSoto, TX 75115
MLS# 21268518Listed by: RE/MAX DFW ASSOCIATES $312,900Active3 beds 2 baths1,786 sq. ft.
916 Ironwood Drive, Alvarado, TX 76009
MLS# 21286755Listed by: CENTURY COMMUNITIES $165,000Active1 Acres
808 Terrace Drive, DeSoto, TX 75115
MLS# 21286586Listed by: BROWNSTONE REAL ESTATE GROUP $366,000Active4 beds 3 baths2,618 sq. ft.
1516 Kinglet Street, DeSoto, TX 75115
MLS# 21286445Listed by: REKONNECTION, LLC $284,900Pending4 beds 3 baths2,495 sq. ft.
870 Raintree Lane, DeSoto, TX 75115
MLS# 21286267Listed by: KELLER WILLIAMS URBAN DALLAS $369,020Active4 beds 2 baths1,684 sq. ft.
1412 Canterbury Trail, DeSoto, TX 75115
MLS# 21285131Listed by: CENTURY 21 MIKE BOWMAN, INC. $850,000Active8.68 Acres
300 W Wintergreen Road, DeSoto, TX 75115
MLS# 21286079Listed by: FRANCHISE REAL ESTATE GROUP $545,000Active3 beds 3 baths2,643 sq. ft.
909 Saint Andrews Place, DeSoto, TX 75115
MLS# 21284259Listed by: LITAKER REALTY INC. $525,000Active4 beds 3 baths3,224 sq. ft.
809 Newport Way, DeSoto, TX 75115
MLS# 21273462Listed by: EBBY HALLIDAY, REALTORS $370,900Active4 beds 2 baths2,432 sq. ft.
1700 Wylie Creek Drive, DeSoto, TX 75115
MLS# 21284775Listed by: COMPASS RE TEXAS, LLC. $499,369Active4 beds 4 baths3,348 sq. ft.
852 State Street, DeSoto, TX 75115
MLS# 21277164Listed by: UNITED REAL ESTATE $335,000Pending4 beds 3 baths2,191 sq. ft.
421 Chestnut Lane, DeSoto, TX 75115
MLS# 21283329Listed by: EDWARD CHRISTIAN REALTY, LLC $319,900Active4 beds 3 baths2,298 sq. ft.
1012 Townsend Lane, DeSoto, TX 75115
MLS# 21276977Listed by: TOP TX HOMES REALTY, LLC $519,990Pending4 beds 3 baths2,785 sq. ft.
1909 Barrix Lane, DeSoto, TX 75115
MLS# 21282776Listed by: RGP REALTY GROUP, LLC $479,990Active4 beds 3 baths2,572 sq. ft.
1913 Barrix Lane, DeSoto, TX 75115
MLS# 21282794Listed by: RGP REALTY GROUP, LLC- Open Sat, 12 to 4pm
 $449,990Active4 beds 2 baths2,251 sq. ft.
736 Candace Drive, DeSoto, TX 75115
MLS# 21282817Listed by: RGP REALTY GROUP, LLC  $266,499Active4 beds 2 baths1,720 sq. ft.
1224 Finch Drive, Keene, TX 76059
MLS# 21281229Listed by: TURNER MANGUM,LLC $900,000Active4 beds 5 baths4,113 sq. ft.
1133 Aerie Place, DeSoto, TX 75115
MLS# 21276147Listed by: INTEGRITY REAL ESTATE SERVICES $490,000Pending4 beds 4 baths3,863 sq. ft.
1220 Primrose Court, DeSoto, TX 75115
MLS# 21278803Listed by: ROOTS BROKERAGE $220,000Pending4 beds 2 baths2,092 sq. ft.
1503 Dutchman Creek Drive, DeSoto, TX 75115
MLS# 21252362Listed by: JESSICA HARGIS REALTY, LLC $464,900Active5 beds 3 baths2,781 sq. ft.
533 Shasta Street, DeSoto, TX 75115
MLS# 21279442Listed by: MORA BELLA, INC. $449,990Active4 beds 3 baths2,164 sq. ft.
822 Aspen Lane, DeSoto, TX 75115
MLS# 21279054Listed by: CENTRAL METRO REALTY $1,099,000Active5 beds 5 baths4,542 sq. ft.
915 W Pleasant Run Road, DeSoto, TX 75115
MLS# 21278581Listed by: BEAM REAL ESTATE, LLC $150,000Pending3 beds 2 baths1,784 sq. ft.
829 Ray Andra Drive, DeSoto, TX 75115
MLS# 21276988Listed by: COMPASS RE TEXAS, LLC $329,999Active4 beds 2 baths2,090 sq. ft.
520 Jeff Grimes Boulevard, DeSoto, TX 75115
MLS# 21278275Listed by: MONUMENT REALTY $400,000Active3 beds 3 baths2,141 sq. ft.
1341 Nettleton Drive, DeSoto, TX 75115
MLS# 21276514Listed by: KELLER WILLIAMS REALTY DPR $325,900Active4 beds 2 baths2,044 sq. ft.
1305 Briarbrook Drive, DeSoto, TX 75115
MLS# 21275956Listed by: COLDWELL BANKER APEX, REALTORS $299,000Active5 beds 3 baths2,541 sq. ft.
513 Ten Mile Drive, DeSoto, TX 75115
MLS# 21275211Listed by: COLDWELL BANKER REALTY $225,000Active3 beds 2 baths2,184 sq. ft.
613 Misty Glen Drive, DeSoto, TX 75115
MLS# 21274447Listed by: THE REAL ESTATE COMPANY $960,000Active3 beds 3 baths3,649 sq. ft.
1922 W Pleasant Run Road, DeSoto, TX 75115
MLS# 21275210Listed by: BOBBY NORRIS FARM&RANCH REALTY $295,000Pending4 beds 2 baths2,030 sq. ft.
1208 Rio Vista Drive, DeSoto, TX 75115
MLS# 21274307Listed by: TDREALTY- Open Sat, 2 to 4pm
 $330,000Active3 beds 3 baths2,374 sq. ft.
115 Idle Creek Court, DeSoto, TX 75115
MLS# 21274057Listed by: LILY MOORE REALTY  $420,000Active4 beds 3 baths2,752 sq. ft.
900 Ginger Trail, DeSoto, TX 75115
MLS# 21274199Listed by: INFINITY REALTY GROUP OF TEXAS $474,900Active4 beds 4 baths2,762 sq. ft.
1420 Kendal Drive, DeSoto, TX 75115
MLS# 21264584Listed by: INC REALTY, LLC $285,000Pending3 beds 2 baths1,558 sq. ft.
231 Juniper Ridge Circle, DeSoto, TX 75115
MLS# 21269920Listed by: CENTURY 21 JUDGE FITE CO. $373,340Active4 beds 2 baths1,946 sq. ft.
1425 Canterbury Trail, DeSoto, TX 75115
MLS# 21270335Listed by: CENTURY 21 MIKE BOWMAN, INC. $383,340Active4 beds 2 baths2,115 sq. ft.
1433 Canterbury Trail, DeSoto, TX 75115
MLS# 21270344Listed by: CENTURY 21 MIKE BOWMAN, INC. $352,990Pending4 beds 2 baths1,684 sq. ft.
1437 Canterbury Trail, DeSoto, TX 75115
MLS# 21270358Listed by: CENTURY 21 MIKE BOWMAN, INC. $410,000Active4 beds 3 baths2,800 sq. ft.
424 Castle Street, DeSoto, TX 75115
MLS# 21271608Listed by: REGAL, REALTORS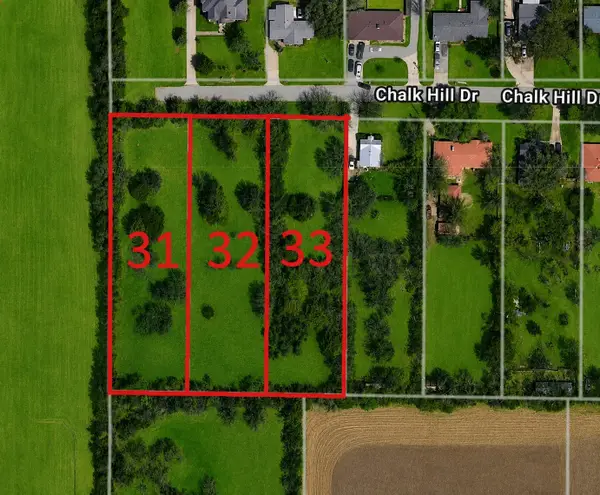 $255,000Pending2.47 Acres
700,704,708 Chalk Hill Drive, DeSoto, TX 75115
MLS# 21272338Listed by: PURE REAL ESTATE $462,000Active5 beds 2 baths2,772 sq. ft.
1004 Keats Drive, DeSoto, TX 75115
MLS# 21272722Listed by: SUNET GROUP $415,000Active5 beds 3 baths3,129 sq. ft.
716 Mulberry Lane, DeSoto, TX 75115
MLS# 21268777Listed by: KELLER WILLIAMS DALLAS MIDTOWN $430,000Active3 beds 3 baths1,991 sq. ft.
1609 Masters Drive, DeSoto, TX 75115
MLS# 21268791Listed by: REAL BROKER, LLC $288,000Active4 beds 1 baths1,738 sq. ft.
516 E Wintergreen Road, DeSoto, TX 75115
MLS# 21270128Listed by: KELLER WILLIAMS REALTY $436,840Active4 beds 4 baths2,975 sq. ft.
1338 Canterbury Trail, DeSoto, TX 75115
MLS# 21268989Listed by: CENTURY 21 MIKE BOWMAN, INC. $400,520Active4 beds 2 baths2,401 sq. ft.
1400 Canterbury Trail, DeSoto, TX 75115
MLS# 21269046Listed by: CENTURY 21 MIKE BOWMAN, INC. $389,990Active4 beds 3 baths2,012 sq. ft.
132 Woodbrook Dr, Georgetown, TX 78674
MLS# 4275812Listed by: MERITAGE HOMES REALTY $419,990Active5 beds 3 baths2,585 sq. ft.
136 Woodbrook Dr, Georgetown, TX 78674
MLS# 4332387Listed by: MERITAGE HOMES REALTY $429,990Active5 beds 3 baths2,812 sq. ft.
128 Woodbrook Dr, Georgetown, TX 78674
MLS# 7198045Listed by: MERITAGE HOMES REALTY- Open Thu, 5 to 7pm
 $480,000Active5 beds 3 baths3,229 sq. ft.
933 Vista Lane, DeSoto, TX 75115
MLS# 21269445Listed by: ELEVATION REALTY GROUP INC - Open Sat, 12:45 to 2:45pm
 $605,000Active6 beds 4 baths3,920 sq. ft.
412 Shadow Creek Drive, DeSoto, TX 75115
MLS# 21267373Listed by: NANO REAL ESTATE  $399,900Active4 beds 3 baths2,798 sq. ft.
1221 Kittery Drive, DeSoto, TX 75115
MLS# 21261031Listed by: ORCHARD BROKERAGE $349,000Active3 beds 3 baths2,268 sq. ft.
1209 Hanna Circle, DeSoto, TX 75115
MLS# 21264176Listed by: KELLER WILLIAMS REALTY DPR $324,900Active3 beds 2 baths1,903 sq. ft.
1403 Dutchman Creek Drive, DeSoto, TX 75115
MLS# 21226706Listed by: THE KENZIE MOORE GROUP $99,000Active0.36 Acres
41 Wyndmere Drive, DeSoto, TX 75115
MLS# 21264835Listed by: FATHOM REALTY LLC $459,900Active3 beds 3 baths2,504 sq. ft.
2125 Flora Lane, DeSoto, TX 75115
MLS# 21265202Listed by: RE/MAX PREFERRED ASSOCIATES $1,398,000Active23.24 Acres
721 Rayburn Drive, DeSoto, TX 75115
MLS# 21265677Listed by: TWIN X REALTY- Open Sat, 1 to 3pm
 $454,900Active4 beds 3 baths2,829 sq. ft.
1304 Carriage Creek Drive, DeSoto, TX 75115
MLS# 21265273Listed by: MONUMENT REALTY  $279,000Pending4 beds 2 baths1,825 sq. ft.
1216 Urban Drive, DeSoto, TX 75115
MLS# 21263412Listed by: REKONNECTION, LLC $295,000Active3 beds 2 baths1,556 sq. ft.
400 Brook Hollow Circle, DeSoto, TX 75115
MLS# 21250933Listed by: COLDWELL BANKER APEX, REALTORS $498,000Pending3 beds 2 baths1,012 sq. ft.
725 Hilltop Circle, DeSoto, TX 75115
MLS# 21261207Listed by: EPIQUE REALTY LLC $399,900Active4 beds 3 baths2,406 sq. ft.
1748 River Run Drive, DeSoto, TX 75115
MLS# 21261068Listed by: UPTON REAL ESTATE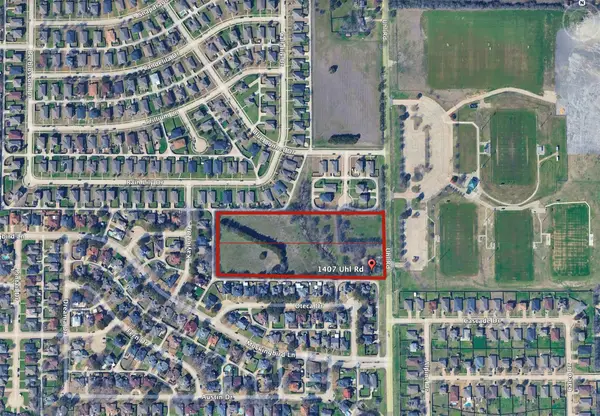 $1,200,000Active7.98 Acres
1407 S Uhl Road, DeSoto, TX 75115
MLS# 21260143Listed by: FRANCHISE REAL ESTATE GROUP $550,000Pending4 beds 4 baths3,719 sq. ft.
1119 Shallow Bend Drive, DeSoto, TX 75115
MLS# 21241940Listed by: DAVE PERRY MILLER REAL ESTATE $334,900Active3 beds 3 baths2,766 sq. ft.
613 Deer Creek Drive, DeSoto, TX 75115
MLS# 21258588Listed by: RE/MAX TRINITY $210,000Active2 beds 1 baths1,151 sq. ft.
805 E Belt Line Road, DeSoto, TX 75115
MLS# 21252175Listed by: KELLER WILLIAMS REALTY $799,080Active5 beds 4 baths4,409 sq. ft.
412 Hidden Cove Drive, DeSoto, TX 75115
MLS# 21258826Listed by: HOMESUSA.COM $249,999Active4 beds 2 baths2,940 sq. ft.
1321 Meadow Street, DeSoto, TX 75115
MLS# 21258620Listed by: ULTIMA REAL ESTATE $215,000Pending3 beds 2 baths1,570 sq. ft.
304 Bennett Circle, DeSoto, TX 75115
MLS# 21258496Listed by: WALNUT CREEK REALTY, LLC $550,000Active5 beds 4 baths3,948 sq. ft.
908 Heath Creek Drive, DeSoto, TX 75115
MLS# 21258074Listed by: INNOCENT REALTORS $470,000Active5 beds 3 baths4,317 sq. ft.
1521 Mountain Laurel Lane, DeSoto, TX 75115
MLS# 21256272Listed by: CITIWIDE PROPERTIES CORP. $559,900Active4 beds 3 baths2,761 sq. ft.
943 Richard Pittmon Drive, DeSoto, TX 75115
MLS# 21254453Listed by: GLORIMONT REAL ESTATE, LLC $249,000Pending3 beds 2 baths693 sq. ft.
1455 Honor Drive, DeSoto, TX 75115
MLS# 21253386Listed by: MONUMENT REALTY $342,900Active4 beds 3 baths2,013 sq. ft.
912 Ironwood Drive, Alvarado, TX 76009
MLS# 21253124Listed by: CENTURY COMMUNITIES- Open Sat, 12 to 4pm
 $544,990Active4 beds 3 baths2,983 sq. ft.
732 Candace Drive, DeSoto, TX 75115
MLS# 21252118Listed by: RGP REALTY GROUP, LLC - Open Sat, 12 to 4pm
 $534,990Active5 beds 4 baths2,810 sq. ft.
733 Candace Drive, DeSoto, TX 75115
MLS# 21252133Listed by: RGP REALTY GROUP, LLC  $389,340Active4 beds 2 baths2,115 sq. ft.
1422 Canterbury Trail, DeSoto, TX 75115
MLS# 21249688Listed by: CENTURY 21 MIKE BOWMAN, INC. $443,020Active4 beds 4 baths2,975 sq. ft.
1469 Canterbury Trail, DeSoto, TX 75115
MLS# 21249822Listed by: CENTURY 21 MIKE BOWMAN, INC. $435,840Pending5 beds 3 baths2,697 sq. ft.
1450 Canterbury Trail, DeSoto, TX 75115
MLS# 21249909Listed by: CENTURY 21 MIKE BOWMAN, INC. $353,520Active4 beds 2 baths1,684 sq. ft.
1421 Canterbury Trail, DeSoto, TX 75115
MLS# 21250071Listed by: CENTURY 21 MIKE BOWMAN, INC. $296,900Active3 beds 2 baths1,508 sq. ft.
920 Ironwood Drive, Alvarado, TX 76009
MLS# 21251282Listed by: CENTURY COMMUNITIES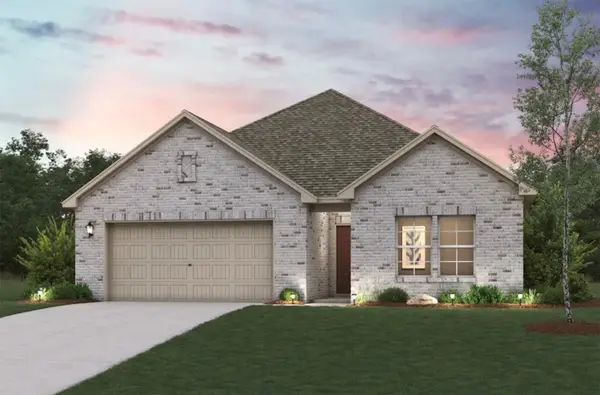 $333,900Active4 beds 2 baths1,859 sq. ft.
924 Ironwood Drive, Alvarado, TX 76009
MLS# 21251299Listed by: CENTURY COMMUNITIES $400,000Pending4 beds 4 baths3,434 sq. ft.
837 Danbury Drive, DeSoto, TX 75115
MLS# 21247539Listed by: RE/MAX BEST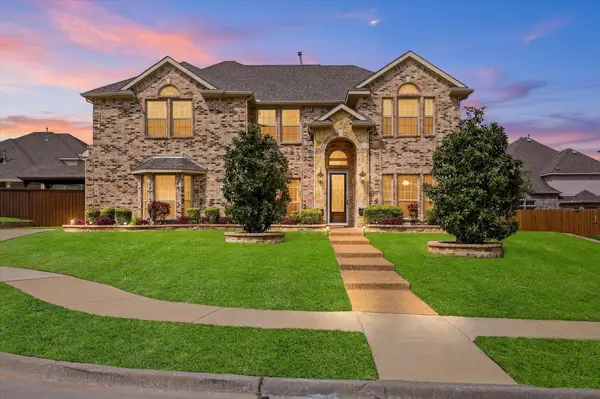 $579,900Pending4 beds 4 baths3,345 sq. ft.
413 Mercury Court, DeSoto, TX 75115
MLS# 21246115Listed by: RE/MAX ASSOCIATES OF ARLINGTON $365,000Active2 beds 3 baths2,511 sq. ft.
1626 Mai Avenue, DeSoto, TX 75115
MLS# 21239379Listed by: THE WALL TEAM REALTY ASSOC $275,000Active3 beds 2 baths1,391 sq. ft.
716 Ashbrook Drive, DeSoto, TX 75115
MLS# 21247940Listed by: REDFIN CORPORATION $440,000Pending3 beds 3 baths2,501 sq. ft.
759 Village Green Drive, DeSoto, TX 75115
MLS# 21248846Listed by: ONDEMAND REALTY $385,340Active4 beds 2 baths2,115 sq. ft.
1334 Canterbury Trail, DeSoto, TX 75115
MLS# 21249100Listed by: CENTURY 21 MIKE BOWMAN, INC. $227,999Pending3 beds 2 baths1,302 sq. ft.
1232 Finch Drive, Keene, TX 76059
MLS# 21248597Listed by: TURNER MANGUM,LLC $770,000Active5 beds 4 baths4,737 sq. ft.
704 S Hidden Lakes Drive, DeSoto, TX 75115
MLS# 21248124Listed by: MORA BELLA, INC.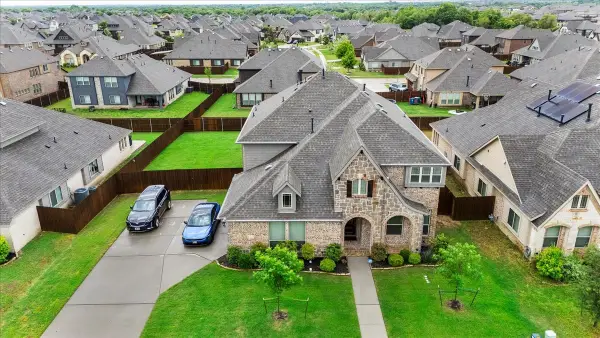 $420,000Active5 beds 4 baths3,304 sq. ft.
1224 Crawford Drive, DeSoto, TX 75115
MLS# 21248001Listed by: ALLURE LIVING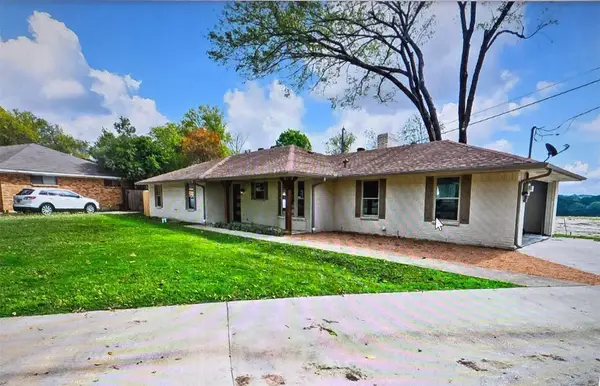 $299,999Active3 beds 3 baths2,076 sq. ft.
1116 Southwood Drive, DeSoto, TX 75115
MLS# 21246853Listed by: RENDON REALTY, LLC $469,000Pending4 beds 4 baths3,407 sq. ft.
1725 Sagewood Drive, DeSoto, TX 75115
MLS# 21245898Listed by: ONDEMAND REALTY $429,000Active4 beds 3 baths2,983 sq. ft.
748 Longleaf Drive, DeSoto, TX 75115
MLS# 21215370Listed by: NEW HOME SALES CENTER $250,000Pending4 beds 2 baths1,947 sq. ft.
709 Desoto Drive, DeSoto, TX 75115
MLS# 21243762Listed by: APLOMB REAL ESTATE $320,000Active3 beds 2 baths1,510 sq. ft.
1032 Twin Falls Drive, DeSoto, TX 75115
MLS# 21243851Listed by: UNITED REAL ESTATE FRISCO $285,000Active4 beds 4 baths1,930 sq. ft.
702 Cresent Drive, DeSoto, TX 75115
MLS# 21224606Listed by: DAVE PERRY MILLER REAL ESTATE $659,900Active6 beds 4 baths4,450 sq. ft.
215 Idle Creek Lane, DeSoto, TX 75115
MLS# 21239519Listed by: DARRION BUTLER, BROKER $714,990Active5 beds 4 baths3,229 sq. ft.
1254 Whispering Oaks Drive, DeSoto, TX 75115
MLS# 21239725Listed by: MONUMENT REALTY $244,950Pending3 beds 2 baths1,579 sq. ft.
1205 Candlenut Court, DeSoto, TX 75115
MLS# 21236380Listed by: REGAL, REALTORS $289,000Pending3 beds 2 baths1,933 sq. ft.
1206 Joanna Avenue, DeSoto, TX 75115
MLS# 21235652Listed by: LEGACY BUYER PARTNERS $335,000Active4 beds 3 baths1,751 sq. ft.
1329 Wentwood Drive, DeSoto, TX 75115
MLS# 21205076Listed by: ELITE REAL ESTATE TEXAS $749,000Active1.49 Acres
1226 W Belt Line Road, DeSoto, TX 75115
MLS# 21204408Listed by: CENTURY 21 JUDGE FITE CO. $329,500Pending4 beds 2 baths2,564 sq. ft.
753 Snowy Orchid Lane, DeSoto, TX 75115
MLS# 21234992Listed by: LANEE SCOTT REALTORS, LLC $450,000Pending4 beds 3 baths2,292 sq. ft.
121 Little John Drive, DeSoto, TX 75115
MLS# 21234762Listed by: CENTURY 21 JUDGE FITE CO. $250,000Active3 beds 2 baths2,020 sq. ft.
112 Charles Street, DeSoto, TX 75115
MLS# 21233913Listed by: LEGACY REALTY GROUP $899,000Active4 beds 4 baths4,316 sq. ft.
924 Joe Boy Court, DeSoto, TX 75115
MLS# 21208940Listed by: KELLER WILLIAMS LONESTAR DFW $534,900Pending4 beds 3 baths3,282 sq. ft.
2005 Flora Lane, DeSoto, TX 75115
MLS# 21231585Listed by: RE/MAX PREFERRED ASSOCIATES $285,000Pending3 beds 2 baths1,916 sq. ft.
213 Gregory Drive, DeSoto, TX 75115
MLS# 21233469Listed by: LIFESTYLES REALTY CENTRAL TEXAS INC $1,800,000Active9.62 Acres
1601 Old Hickory Trail, DeSoto, TX 75115
MLS# 21231869Listed by: DAVE PERRY MILLER REAL ESTATE $345,000Active4 beds 3 baths3,066 sq. ft.
785 Eldorado Drive, DeSoto, TX 75115
MLS# 21231686Listed by: REALTY OF AMERICA, LLC $384,500Active4 beds 2 baths1,800 sq. ft.
128 Campbell Street, DeSoto, TX 75115
MLS# 21227914Listed by: FATHOM REALTY LLC- Open Sat, 12 to 4pm
 $499,990Active4 beds 3 baths2,666 sq. ft.
706 Alaina Drive, DeSoto, TX 75115
MLS# 21230272Listed by: RGP REALTY GROUP, LLC  $549,990Pending4 beds 3 baths2,968 sq. ft.
1808 Barrix Court, DeSoto, TX 75115
MLS# 21230304Listed by: RGP REALTY GROUP, LLC $529,990Pending5 beds 4 baths2,810 sq. ft.
979 Beaverbrook Lane, DeSoto, TX 75115
MLS# 21230357Listed by: RGP REALTY GROUP, LLC $4,499,000Active6 beds 4 baths3,870 sq. ft.
417 Silver Creek Drive, DeSoto, TX 75115
MLS# 21229833Listed by: JOSEPH WALTER REALTY, LLC $335,000Active3 beds 2 baths1,959 sq. ft.
1105 Crestwood Court, DeSoto, TX 75115
MLS# 21228129Listed by: KELLER WILLIAMS REALTY $289,000Active4 beds 2 baths1,979 sq. ft.
853 Woodridge Circle, DeSoto, TX 75115
MLS# 21228829Listed by: MONUMENT REALTY $525,000Active5 beds 4 baths5,052 sq. ft.
1733 White Cap Court, DeSoto, TX 75115
MLS# 21226087Listed by: EXP REALTY, LLC $475,000Pending2 beds 3 baths3,366 sq. ft.
2001 Augusta Court, DeSoto, TX 75115
MLS# 21221577Listed by: COMPASS RE TEXAS, LLC $550,000Active5 beds 4 baths4,674 sq. ft.
1129 Northlake Drive, DeSoto, TX 75115
MLS# 21222408Listed by: BERKSHIRE HATHAWAY HOME SERVICES A ACTION REALTORS $314,900Active3 beds 2 baths1,754 sq. ft.
509 Wisterglen Drive, DeSoto, TX 75115
MLS# 21219099Listed by: TOWN SQUARE REALTY $255,000Active3 beds 2 baths1,625 sq. ft.
902 Teakwood Lane, DeSoto, TX 75115
MLS# 21220722Listed by: FATHOM REALTY LLC $285,000Pending3 beds 2 baths2,129 sq. ft.
100 Faircrest Drive, DeSoto, TX 75115
MLS# 21220311Listed by: ONLY 1 REALTY GROUP DALLAS $995,000Active9.23 Acres
699 W Wintergreen Road, DeSoto, TX 75115
MLS# 21220645Listed by: CENTURY 21 JUDGE FITE COMPANY $639,593Active5 beds 4 baths2,728 sq. ft.
513 Pond Springs Drive, DeSoto, TX 75115
MLS# 21219276Listed by: HOMESUSA.COM $660,320Pending4 beds 4 baths3,069 sq. ft.
608 S Hidden Lakes Drive, DeSoto, TX 75115
MLS# 21219281Listed by: HOMESUSA.COM $587,284Active4 beds 3 baths2,508 sq. ft.
712 S Hidden Lakes Drive, DeSoto, TX 75115
MLS# 21219288Listed by: HOMESUSA.COM $509,999Active5 beds 4 baths4,210 sq. ft.
105 Wild River Court, DeSoto, TX 75115
MLS# 21219353Listed by: EXP REALTY LLC $250,000Active3 beds 2 baths1,270 sq. ft.
514 Amber Lane, DeSoto, TX 75115
MLS# 21218736Listed by: STAR FIVE, REALTORS $727,382Active4 beds 4 baths3,321 sq. ft.
413 Tower Street, DeSoto, TX 75115
MLS# 21219143Listed by: HOMESUSA.COM $656,316Active4 beds 4 baths3,320 sq. ft.
412 Newpark Boulevard, DeSoto, TX 75115
MLS# 21219188Listed by: HOMESUSA.COM $793,177Active4 beds 5 baths4,307 sq. ft.
1001 E Hidden Lakes Drive, DeSoto, TX 75115
MLS# 21219015Listed by: HOMESUSA.COM $757,930Active6 beds 4 baths4,428 sq. ft.
1115 Willow Lake Drive, DeSoto, TX 75115
MLS# 21219061Listed by: HOMESUSA.COM $429,999Active4 beds 3 baths2,001 sq. ft.
1126 Gannon Lane, DeSoto, TX 75115
MLS# 21217491Listed by: ONYX LEGACY REALTY LLC $429,999Active4 beds 3 baths2,001 sq. ft.
1206 Gannon Lane, DeSoto, TX 75115
MLS# 21217678Listed by: ONYX LEGACY REALTY LLC $339,500Active3 beds 3 baths2,349 sq. ft.
1340 Grand Teton Drive, DeSoto, TX 75115
MLS# 21218069Listed by: ASHTON REALTY INC. $498,000Pending4 beds 3 baths3,166 sq. ft.
621 Buelwood Court, DeSoto, TX 75115
MLS# 21206111Listed by: MONUMENT REALTY $292,000Active4 beds 3 baths1,798 sq. ft.
1212 Canterbury Trail, DeSoto, TX 75115
MLS# 21216338Listed by: ONDEMAND REALTY $417,000Active4 beds 3 baths2,852 sq. ft.
904 Regal Bluff Lane, DeSoto, TX 75115
MLS# 21200073Listed by: THE TRUVILLION GROUP LLC $348,000Active3 beds 2 baths1,701 sq. ft.
424 Livingston Drive, DeSoto, TX 75115
MLS# 21215453Listed by: DANIELLE SCOTT, BROKER $234,999Pending3 beds 2 baths1,522 sq. ft.
1229 Finch Drive, Keene, TX 76059
MLS# 21214578Listed by: TURNER MANGUM,LLC- Open Wed, 10am to 6pm
 $549,990Active4 beds 3 baths2,460 sq. ft.
1929 Comanche Drive, DeSoto, TX 75115
MLS# 21211813Listed by: KELLER WILLIAMS REALTY DPR  $439,000Active4 beds 3 baths2,520 sq. ft.
822 Longmeadow Court, DeSoto, TX 75115
MLS# 21194929Listed by: BETTER HOMES & GARDENS, WINANS $499,000Active5 beds 4 baths3,931 sq. ft.
645 Ten Mile Drive, DeSoto, TX 75115
MLS# 21194292Listed by: ONDEMAND REALTY $325,000Active4 beds 3 baths2,636 sq. ft.
633 Daisy Drive, DeSoto, TX 75115
MLS# 21206119Listed by: KELLER WILLIAMS DALLAS MIDTOWN $419,900Pending5 beds 3 baths3,007 sq. ft.
1137 Versailles Avenue, DeSoto, TX 75115
MLS# 21194457Listed by: REAL BROKER, LLC $314,900Active3 beds 3 baths2,582 sq. ft.
704 Inglewood Trail, DeSoto, TX 75115
MLS# 21204315Listed by: DFW PROPERTY MANAGEMENT.COM $90,000Pending0.29 Acres
1124 Oxford, DeSoto, TX 75115
MLS# 21181293Listed by: GOLD KEY, REALTORS $289,900Pending3 beds 2 baths1,594 sq. ft.
1124 Reedsport Place, DeSoto, TX 75115
MLS# 21200936Listed by: CONNIE FELDER & ASSOCIATES $389,990Active4 beds 2 baths2,378 sq. ft.
1625 Deer Creek Drive, DeSoto, TX 75115
MLS# 21204665Listed by: DECORATIVE REAL ESTATE $339,999Active4 beds 3 baths2,622 sq. ft.
1005 Twin Creek Drive, DeSoto, TX 75115
MLS# 21191041Listed by: REALTY OF AMERICA, LLC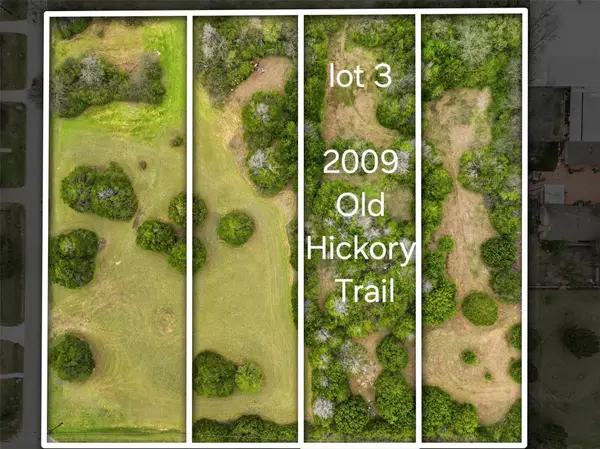 $175,000Active0.94 Acres
2009 Old Hickory Trail, DeSoto, TX 75115
MLS# 21203308Listed by: CITY REAL ESTATE $175,000Active0.92 Acres
2013 Old Hickory Trail, DeSoto, TX 75115
MLS# 21203318Listed by: CITY REAL ESTATE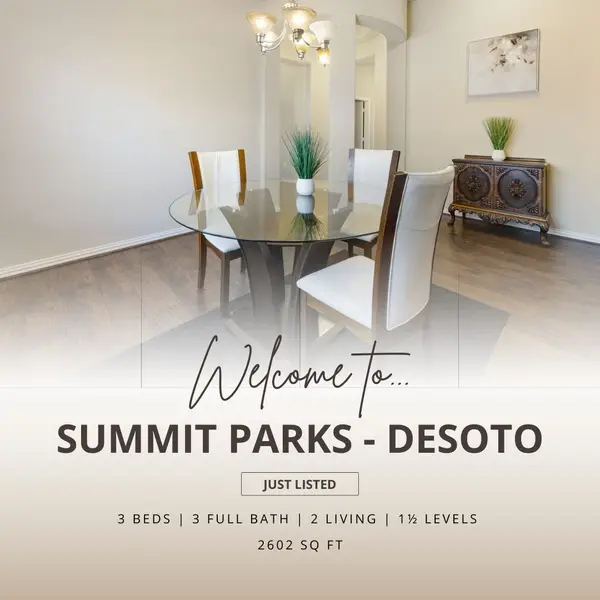 $369,000Active3 beds 3 baths2,602 sq. ft.
433 Castle Street, DeSoto, TX 75115
MLS# 21196173Listed by: CARRINGTON REAL ESTATE GROUP- Open Thu, 10am to 7pm
 $309,900Active3 beds 2 baths2,120 sq. ft.
600 N Chattey Road, DeSoto, TX 75115
MLS# 21201945Listed by: ERIC GERARD REALTY, LLC  $599,900Active6 beds 4 baths4,396 sq. ft.
400 Shadow Creek Drive, DeSoto, TX 75115
MLS# 21195222Listed by: ERIC GERARD REALTY, LLC $120,000Active0.23 Acres
412 Mckinley Street, DeSoto, TX 75115
MLS# 21196743Listed by: FULL CIRCLE RE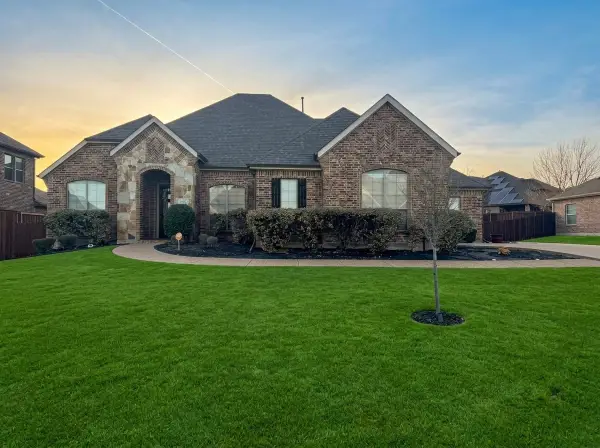 $410,000Pending4 beds 3 baths2,994 sq. ft.
613 Buelwood Court, DeSoto, TX 75115
MLS# 21193590Listed by: TDREALTY $525,000Active4 beds 3 baths3,014 sq. ft.
950 Shady Cove Place, DeSoto, TX 75115
MLS# 21188800Listed by: NEXTHOME PROPERTY ADVISORS $315,000Active3 beds 2 baths1,806 sq. ft.
1021 Crestwood Court, DeSoto, TX 75115
MLS# 21188575Listed by: KELLER WILLIAMS LEGACY $200,000Pending3 beds 3 baths1,418 sq. ft.
720 Cresent Drive, DeSoto, TX 75115
MLS# 21187331Listed by: RENDON REALTY, LLC $265,000Active4 beds 2 baths1,622 sq. ft.
121 Hillside Lane, DeSoto, TX 75115
MLS# 21184995Listed by: CENTURY 21 JUDGE FITE CO. $585,000Active5 beds 4 baths4,098 sq. ft.
601 Belclaire Terrace, DeSoto, TX 75115
MLS# 21185326Listed by: VYLLA HOME $721,532Active5 beds 4 baths3,894 sq. ft.
513 S Hidden Lakes Drive, DeSoto, TX 75115
MLS# 21184477Listed by: HOMESUSA.COM $754,650Pending5 beds 4 baths3,978 sq. ft.
1117 E Hidden Lakes Drive, DeSoto, TX 75115
MLS# 21184482Listed by: HOMESUSA.COM $449,500Active3 beds 3 baths2,361 sq. ft.
903 Urban Drive, DeSoto, TX 75115
MLS# 21180480Listed by: NEW WEALTH HORIZONS, LLC $279,900Active3 beds 2 baths1,476 sq. ft.
611 Ray Andra Drive, DeSoto, TX 75115
MLS# 21181627Listed by: ERIC GERARD REALTY, LLC $803,955Active5 beds 4 baths4,315 sq. ft.
424 Newpark Boulevard, DeSoto, TX 75115
MLS# 21180459Listed by: HOMESUSA.COM $740,071Active5 beds 4 baths3,896 sq. ft.
520 Elias Street, DeSoto, TX 75115
MLS# 21180463Listed by: HOMESUSA.COM $250,000Pending3 beds 2 baths1,800 sq. ft.
200 Connie Drive, DeSoto, TX 75115
MLS# 21176715Listed by: KELLER WILLIAMS REALTY $1,400,000Active10 Acres
221 W Parkerville Road, DeSoto, TX 75115
MLS# 21175405Listed by: COMPASS RE TEXAS, LLC. $756,159Active5 beds 4 baths3,978 sq. ft.
411 Hidden Lakes Drive, DeSoto, TX 75115
MLS# 21175044Listed by: HOMESUSA.COM $223,000Active1.73 Acres
1000 Silver Creek Drive, DeSoto, TX 75115
MLS# 21170969Listed by: KELLER WILLIAMS CENTRAL $600,000Active5 beds 5 baths4,232 sq. ft.
1134 Cardinal Drive, Midlothian, TX 76065
MLS# 21168824Listed by: BERKSHIRE HATHAWAYHS PENFED TX $349,000Active3 beds 3 baths2,440 sq. ft.
533 Hidden Brooke Drive, DeSoto, TX 75115
MLS# 21155303Listed by: EBBY HALLIDAY, REALTORS $315,000Active3 beds 3 baths2,118 sq. ft.
133 N Crestwood Boulevard, DeSoto, TX 75115
MLS# 21161386Listed by: COMPASS RE TEXAS, LLC $719,602Active5 beds 4 baths3,662 sq. ft.
425 Newpark Boulevard, DeSoto, TX 75115
MLS# 21170481Listed by: HOMESUSA.COM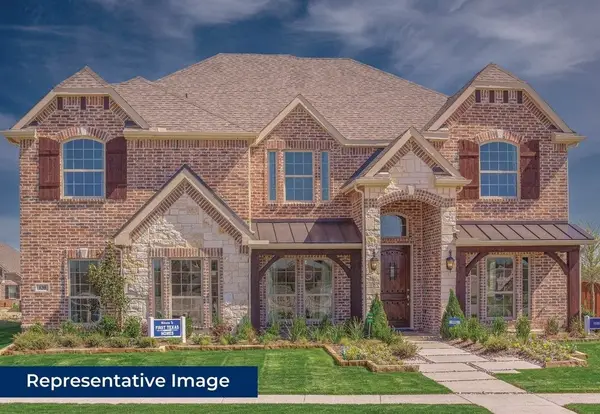 $734,849Active4 beds 4 baths3,910 sq. ft.
413 Newpark Boulevard, DeSoto, TX 75115
MLS# 21169735Listed by: HOMESUSA.COM $200,000Pending3 beds 2 baths1,564 sq. ft.
1214 Wintergreen Court, DeSoto, TX 75115
MLS# 21166800Listed by: CENTURY 21 JUDGE FITE CO. $584,999Active4 beds 5 baths3,790 sq. ft.
416 Newpark, DeSoto, TX 75115
MLS# 21164574Listed by: FULL CIRCLE RE $574,999Active4 beds 5 baths3,781 sq. ft.
408 Newpark Boulevard, DeSoto, TX 75115
MLS# 21164578Listed by: FULL CIRCLE RE $559,999Active4 beds 5 baths3,506 sq. ft.
417 Tower Street, DeSoto, TX 75115
MLS# 21164580Listed by: FULL CIRCLE RE $609,000Active4 beds 5 baths4,177 sq. ft.
404 Mckinley Street, DeSoto, TX 75115
MLS# 21164552Listed by: FULL CIRCLE RE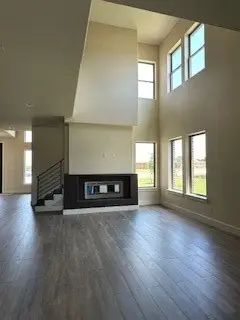 $564,999Active4 beds 5 baths3,616 sq. ft.
524 Elias Street, DeSoto, TX 75115
MLS# 21164569Listed by: FULL CIRCLE RE $305,000Active4 beds 2 baths2,057 sq. ft.
801 S Parks Drive, DeSoto, TX 75115
MLS# 21148493Listed by: FATHOM REALTY LLC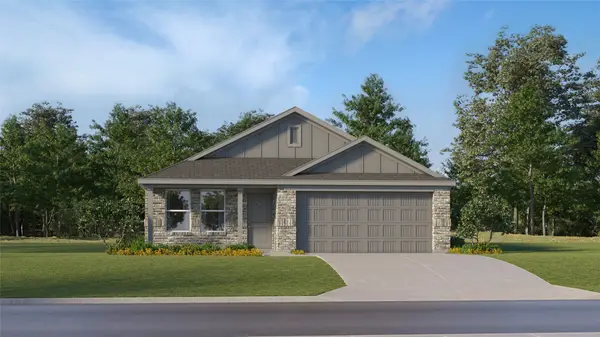 $230,449Pending3 beds 2 baths1,302 sq. ft.
1225 Finch Drive, Keene, TX 76059
MLS# 21162255Listed by: TURNER MANGUM,LLC $473,015Pending3 beds 2 baths2,314 sq. ft.
824 Alamo Court, DeSoto, TX 75115
MLS# 21162104Listed by: VISIONS REALTY & INVESTMENTS $379,500Active3 beds 2 baths2,256 sq. ft.
1132 Devonshire Drive, DeSoto, TX 75115
MLS# 21157499Listed by: HOMESMART $480,000Active5 beds 3 baths3,172 sq. ft.
605 Ten Mile Drive, DeSoto, TX 75115
MLS# 21156942Listed by: RENDON REALTY, LLC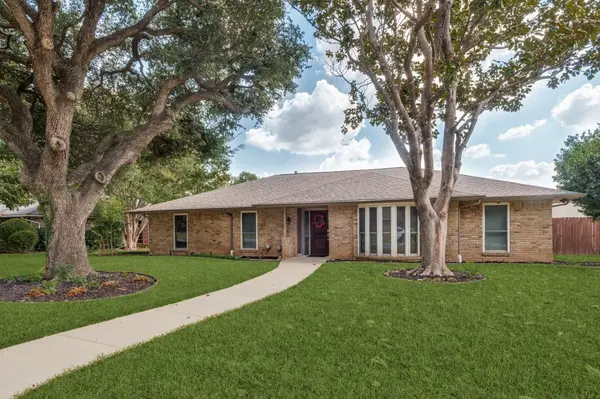 $339,900Active3 beds 2 baths2,253 sq. ft.
1028 Rosewood, DeSoto, TX 75115
MLS# 21155826Listed by: EBBY HALLIDAY, REALTORS $239,900Pending3 beds 2 baths1,390 sq. ft.
317 Willow Wood Lane, DeSoto, TX 75115
MLS# 21153540Listed by: COMPASS RE TEXAS, LLC. $75,000Pending0.33 Acres
1213 Lyndon Avenue, DeSoto, TX 75115
MLS# 21153364Listed by: REAL BROKER, LLC $689,000Active5 beds 5 baths3,959 sq. ft.
1009 Place Louie, DeSoto, TX 75115
MLS# 21145334Listed by: THE MICHAEL GROUP REAL ESTATE- Open Thu, 9am to 8pm
 $496,925Active4 beds 3 baths2,704 sq. ft.
931 Richard Pittmon Drive, DeSoto, TX 75115
MLS# 21150675Listed by: HOMESUSA.COM  $1,400,000Active9.52 Acres
601 W Wintergreen Road, DeSoto, TX 75115
MLS# 21145751Listed by: NEW LIFE PROPERTIES $2,600,000Active17.25 Acres
501 W Wintergreen Road W, DeSoto, TX 75115
MLS# 21145762Listed by: NEW LIFE PROPERTIES $160,000Active0.98 Acres
539 Winston Drive, DeSoto, TX 75115
MLS# 21142243Listed by: NB ELITE REALTY $200,000Pending3 beds 2 baths2,142 sq. ft.
604 The Meadows Parkway, DeSoto, TX 75115
MLS# 21137699Listed by: REAL BROKER, LLC $250,000Active0.52 Acres
1700 N Westmoreland Road, DeSoto, TX 75115
MLS# 21136753Listed by: EPIQ PROPERTIES $232,000Active3 beds 2 baths1,564 sq. ft.
429 Ten Mile Drive, DeSoto, TX 75115
MLS# 20999757Listed by: COMPASS RE TEXAS, LLC. $265,000Pending3 beds 2 baths1,422 sq. ft.
1306 Holt Avenue, DeSoto, TX 75115
MLS# 21136814Listed by: EXP REALTY, LLC $355,000Active4 beds 3 baths1,865 sq. ft.
1241 Springbrook Drive, DeSoto, TX 75115
MLS# 21136514Listed by: ULTIMA REAL ESTATE $330,000Pending3 beds 2 baths2,187 sq. ft.
829 Hunters Creek Drive, DeSoto, TX 75115
MLS# 21134858Listed by: SUMMIT RESIDENTIAL SERVICES, L $385,000Active4 beds 3 baths2,253 sq. ft.
1821 Montauk Way, DeSoto, TX 75115
MLS# 21125305Listed by: JPAR WEST METRO $399,000Pending3 beds 3 baths2,481 sq. ft.
1429 Nettleton Drive, DeSoto, TX 75115
MLS# 21126102Listed by: POINT REALTY $235,000Active0.93 Acres
1124 W Pleasant Run Road, DeSoto, TX 75115
MLS# 21124486Listed by: LISTINGSPARK $539,000Active4 beds 3 baths3,000 sq. ft.
1854 Masters Drive, DeSoto, TX 75115
MLS# 21119158Listed by: CENTURY 21 JUDGE FITE CO. $728,148Active4 beds 4 baths4,003 sq. ft.
1107 Willow Lake Drive, DeSoto, TX 75115
MLS# 21120812Listed by: HOMESUSA.COM $225,000Active3 beds 2 baths1,456 sq. ft.
123 Evelyn Street, DeSoto, TX 75115
MLS# 21198443Listed by: PREMIER PROPERTIES $335,000Active4 beds 3 baths3,312 sq. ft.
616 Jewelflower Drive, DeSoto, TX 75115
MLS# 21112692Listed by: NORTH TEXAS HOMES $120,000Active0.35 Acres
607 Parkdale Lane, DeSoto, TX 75115
MLS# 21113656Listed by: PURE REAL ESTATE $120,000Active0.28 Acres
623 Franklin Street, DeSoto, TX 75115
MLS# 21113630Listed by: PURE REAL ESTATE $120,000Active0.28 Acres
619 Franklin Street, DeSoto, TX 75115
MLS# 21113621Listed by: PURE REAL ESTATE $449,900Pending4 beds 3 baths2,786 sq. ft.
1840 River Run Drive, DeSoto, TX 75115
MLS# 21105486Listed by: COREY SIMPSON & ASSOCIATES $319,500Pending4 beds 2 baths2,533 sq. ft.
801 Wood Glen, DeSoto, TX 75115
MLS# 21089225Listed by: JOGIP PROPERTY MANAGEMENT $455,999Pending4 beds 3 baths2,363 sq. ft.
1357 Lake Grove Lane, DeSoto, TX 75115
MLS# 21106885Listed by: MONUMENT REALTY $475,000Active4 beds 4 baths3,389 sq. ft.
1512 Ruffian Road, DeSoto, TX 75115
MLS# 21100753Listed by: FATHOM REALTY, LLC $495,000Active4 beds 3 baths3,818 sq. ft.
1700 Little River Court, DeSoto, TX 75115
MLS# 21097423Listed by: REAL BROKER, LLC- Open Sat, 12 to 2pm
 $309,000Active4 beds 2 baths1,846 sq. ft.
928 Oak Trail, DeSoto, TX 75115
MLS# 21098142Listed by: AKL REAL ESTATE - Open Sat, 10am to 6pm
 $489,990Active3 beds 3 baths2,304 sq. ft.
1026 Beaverbrook Lane, DeSoto, TX 75115
MLS# 21093292Listed by: KELLER WILLIAMS REALTY DPR  $385,000Active4 beds 3 baths2,597 sq. ft.
1713 Turtle Point Drive, DeSoto, TX 75115
MLS# 21093408Listed by: RE/MAX FRONTIER $230,000Pending3 beds 3 baths1,807 sq. ft.
301 Lakewood Drive, DeSoto, TX 75115
MLS# 21090177Listed by: VISIONS REALTY & INVESTMENTS $546,000Pending4 beds 5 baths2,684 sq. ft.
1700 Carriage Creek Drive, DeSoto, TX 75115
MLS# 21157229Listed by: BRAY REAL ESTATE GROUP- DALLAS $578,445Active4 beds 4 baths2,788 sq. ft.
405 Newpark Boulevard, DeSoto, TX 75115
MLS# 21090640Listed by: HOMESUSA.COM $586,666Active4 beds 4 baths2,775 sq. ft.
408 Mckinley Street, DeSoto, TX 75115
MLS# 21086578Listed by: HOMESUSA.COM $598,928Active4 beds 4 baths2,775 sq. ft.
417 Newpark Boulevard, DeSoto, TX 75115
MLS# 21086224Listed by: HOMESUSA.COM $415,000Active4 beds 4 baths2,945 sq. ft.
626 Saddlebrook, DeSoto, TX 75115
MLS# 21195048Listed by: REAL BROKER, LLC $714,137Pending5 beds 5 baths4,226 sq. ft.
933 Ford Drive, DeSoto, TX 75115
MLS# 21081814Listed by: VISIONS REALTY & INVESTMENTS $674,998Active5 beds 4 baths3,896 sq. ft.
804 S Hidden Lakes Drive, DeSoto, TX 75115
MLS# 21081661Listed by: HOMESUSA.COM $280,000Pending3 beds 2 baths1,872 sq. ft.
1025 Opal Drive, DeSoto, TX 75115
MLS# 21061837Listed by: EXP REALTY, LLC $777,763Pending5 beds 4 baths4,315 sq. ft.
721 S Hidden Lakes Drive, DeSoto, TX 75115
MLS# 21057290Listed by: HOMESUSA.COM $581,160Active4 beds 3 baths2,476 sq. ft.
621 S Hidden Lakes, DeSoto, TX 75115
MLS# 21057274Listed by: HOMESUSA.COM- $479,580Active4 beds 3 baths2,815 sq. ft.
713 Alaina Drive, DeSoto, TX 75115
MLS# 21054496Listed by: MULTIVIEW REALTY  $67,500Active0.22 Acres
1701 Plum Creek Drive, DeSoto, TX 75115
MLS# 21048544Listed by: TDREALTY $265,000Pending3 beds 1 baths1,100 sq. ft.
409 E Parkerville Road, DeSoto, TX 75115
MLS# 21046557Listed by: EXP REALTY, LLC $280,000Active6.24 Acres
1608 Lakeview, DeSoto, TX 75115
MLS# 21040155Listed by: JPAR - CENTRAL METRO $450,000Pending5 beds 3 baths3,425 sq. ft.
1220 Richard Pittmon Drive, DeSoto, TX 75115
MLS# 21027610Listed by: EXP REALTY, LLC $2,330,000Active4.97 Acres
1000 E Danieldale Road, DeSoto, TX 75115
MLS# 21022134Listed by: THE HUGHES GROUP REAL ESTATE $260,000Active3 beds 3 baths2,463 sq. ft.
544 Renee Lane, DeSoto, TX 75115
MLS# 21144169Listed by: DFW ELITE LIVING $245,000Active2 beds 2 baths1,151 sq. ft.
1129 Sandalwood Lane, DeSoto, TX 75115
MLS# 21019241Listed by: ONLY 1 REALTY GROUP DALLAS $585,000Pending5 beds 4 baths3,481 sq. ft.
1105 Cardinal Drive, Midlothian, TX 76065
MLS# 21009861Listed by: VISIONS REALTY & INVESTMENTS- Open Thu, 9am to 8pm
 $571,036Active5 beds 5 baths3,823 sq. ft.
974 Reeves Drive, DeSoto, TX 75115
MLS# 21008522Listed by: HOMESUSA.COM  $570,000Active5 beds 4 baths3,430 sq. ft.
1109 Cardinal Drive, Midlothian, TX 76065
MLS# 20987480Listed by: VISIONS REALTY & INVESTMENTS $299,900Active3 beds 3 baths1,843 sq. ft.
440 Shasta Street, DeSoto, TX 75115
MLS# 20940992Listed by: ORCHARD BROKERAGE $248,900Pending0.81 Acres
1150 Whispering Oaks Dr, Athens, TX 75752
MLS# 108725Listed by: STEWART & MCGEE REAL ESTATE, LLC. $693,022Pending5 beds 4 baths4,321 sq. ft.
604 S Hidden Lakes Drive, DeSoto, TX 75115
MLS# 20874831Listed by: HOMESUSA.COM- $350,000Pending5 beds 3 baths3,329 sq. ft.
616 Magnolia Trail, DeSoto, TX 75115
MLS# 20852875Listed by: RE/MAX INNOVATIONS  $399,000Active5 beds 3 baths3,087 sq. ft.
728 Jewelflower Drive, DeSoto, TX 75115
MLS# 20789144Listed by: SIGNATURE REAL ESTATE GROUP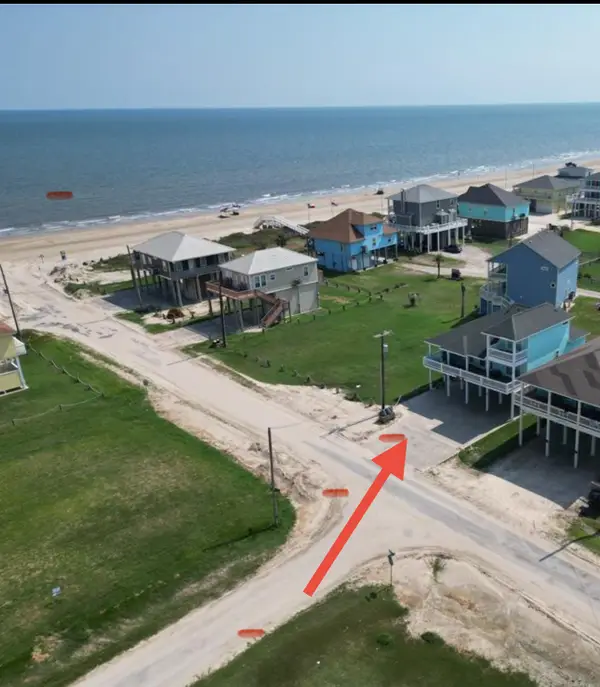 $534,900Active4 beds 2 baths1,815 sq. ft.
833 S Oneal Road, Crystal Beach, TX 77650
MLS# 72860445Listed by: BUYCRYSTALBEACH.COM $82,000Active0.48 Acres
123 Parks Drive, DeSoto, TX 75115
MLS# 20699090Listed by: READY REAL ESTATE LLC- $695,000Active4 beds 4 baths3,430 sq. ft.
912 Ironwood Drive, Out of Area, TX 75115
MLS# 114798Listed by: TEXARKANA STAR REAL ESTATE, INC.  $249,500Active3 beds 2 baths1,373 sq. ft.
470 Chestnut Lane, DeSoto, TX 75115
MLS# 21189029Listed by: JPAR DALLAS $594,013Active5 beds 4 baths2,728 sq. ft.
1128 Willow Lake Drive, DeSoto, TX 75115
MLS# 20626576Listed by: HOMESUSA.COM $255,000Active4 beds 2 baths1,932 sq. ft.
1014 Westlake Drive, DeSoto, TX 75115
MLS# 21042308Listed by: ONDEMAND REALTY
Local realty services provided by:CENTURY 21 Alliance Properties, CENTURY 21 Judge Fite Company, CENTURY 21 Lucky Money Real Estate, CENTURY 21 Platinum Partners
Information provided, in part, by North Texas Real Estate Information Systems, Inc. Last Updated June 16, 2026 Listings with the NTREIS logo are listed by brokerages other than CENTURY 21 Alliance Properties. GDAR Member Broker: Roger Del Brandt II
Copyright 2026, Houston Realtors Information Service, Inc. All information provided is deemed reliable but is not guaranteed and should be independently verified. IDX information is provided exclusively for consumers' personal, non-commercial use, it may not be used for any purpose other than to identify prospective properties consumers may be interested in purchasing, and the data is deemed reliable but is not guaranteed accurate by the MLS.
Neighborhoods near Desoto, TX
Zip codes near Desoto, TX
- 75052 homes for sale
- 75104 homes for sale
- 75115 homes for sale
- 75116 homes for sale
- 75134 homes for sale
- 75137 homes for sale
- 75141 homes for sale
- 75146 homes for sale
- 75154 homes for sale
- 75203 homes for sale
- 75208 homes for sale
- 75211 homes for sale
- 75216 homes for sale
- 75224 homes for sale
- 75232 homes for sale
- 75233 homes for sale
- 75236 homes for sale
- 75237 homes for sale
- 75241 homes for sale
- 75249 homes for sale
Popular searches near Desoto, TX
- Arlington homes for sale
- Bear Creek Ranch homes for sale
- Cedar Hill homes for sale
- Cockrell Hill homes for sale
- Dallas homes for sale
- Duncanville homes for sale
- Ferris homes for sale
- Glenn Heights homes for sale
- Grand Prairie homes for sale
- Hutchins homes for sale
- Lancaster homes for sale
- Mansfield homes for sale
- Midlothian homes for sale
- Northeast Dallas homes for sale
- Oak Leaf homes for sale
- Ovilla homes for sale
- Red Oak homes for sale
- Southwest Dallas homes for sale
- Waxahachie homes for sale
- Wilmer homes for sale
Protect your home and budget from life's surprises with an Assurant Home Warranty, backed by a partner that supports you through every step of homeownership. Explore Plans.
©2026 Century 21 Real Estate LLC. All rights reserved. CENTURY 21®, the CENTURY 21 Logo and C21® are service marks owned by Century 21 Real Estate LLC. Century 21 Real Estate LLC fully supports the principles of the Fair Housing Act and the Equal Opportunity Act. Each office is independently owned and operated. Listing information is deemed reliable but not guaranteed accurate.