- Andorra, Philadelphia homes for sale
- Ardmore, Ardmore homes for sale
- Bala Cynwyd, Bala Cynwyd homes for sale
- Bryn Mawr, Bryn Mawr homes for sale
- Clifton Heights, Clifton Heights homes for sale
- Dearnley Park, Philadelphia homes for sale
- Gladwyne, Gladwyne homes for sale
- Haddington, Philadelphia homes for sale
- Haverford, Haverford homes for sale
- Manayunk, Philadelphia homes for sale
- Merion Station, Merion Station homes for sale
- Morton, Morton homes for sale
- Narberth, Narberth homes for sale
- Overbrook, Philadelphia homes for sale
- Penn Wynne, Wynnewood homes for sale
- Roxborough, Philadelphia homes for sale
- Swarthmore, Swarthmore homes for sale
- Villanova, Villanova homes for sale
- Wynnefield, Philadelphia homes for sale
- Wynnewood, Wynnewood homes for sale
Devon, PA - homes for sale
8 of 8 results displayed
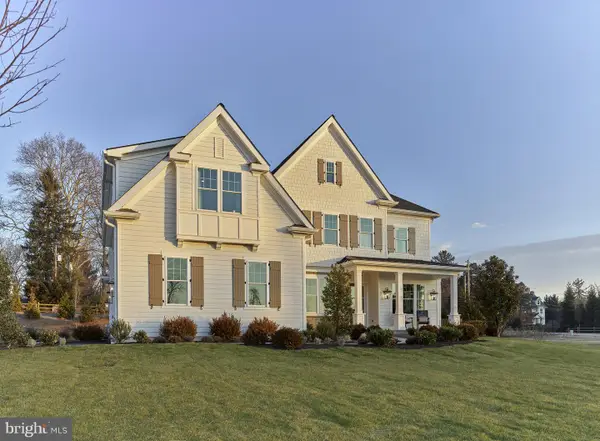 $2,444,900Active4 beds 4 baths4,346 sq. ft.
108 Palmetto Ln, DEVON, PA 19333
MLS# PACT2118694Listed by: HOWARD HANNA REAL ESTATE SERVICES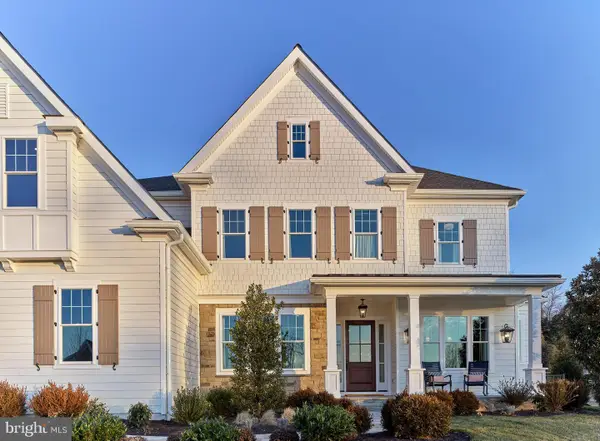 $2,314,900Active4 beds 4 baths4,346 sq. ft.
103 Palmetto, DEVON, PA 19333
MLS# PACT2120450Listed by: HOWARD HANNA REAL ESTATE SERVICES $2,491,049Pending4 beds 4 baths4,346 sq. ft.
105 Palmetto, DEVON, PA 19333
MLS# PACT2116358Listed by: HOWARD HANNA REAL ESTATE SERVICES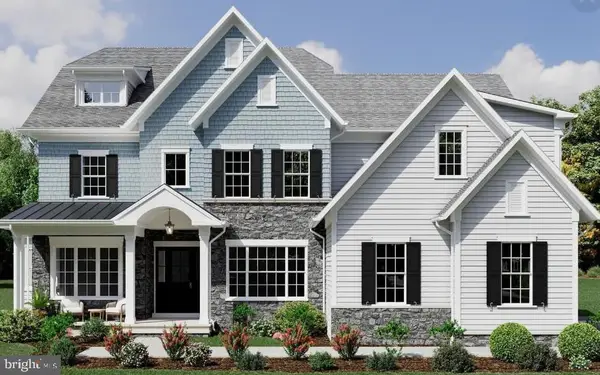 $2,695,000Active4 beds 4 baths4,346 sq. ft.
104 Palmetto, DEVON, PA 19333
MLS# PACT2116366Listed by: HOWARD HANNA REAL ESTATE SERVICES $2,250,900Active4 beds 5 baths3,685 sq. ft.
107 Palmetto, DEVON, PA 19333
MLS# PACT2116280Listed by: HOWARD HANNA REAL ESTATE SERVICES $2,299,900Pending4 beds 5 baths3,685 sq. ft.
109 Palmetto, DEVON, PA 19333
MLS# PACT2116284Listed by: HOWARD HANNA REAL ESTATE SERVICES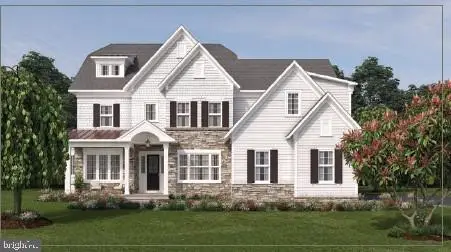 $2,540,000Pending4 beds 4 baths3,685 sq. ft.
Lot 5 Rose Glenn, DEVON, PA 19333
MLS# PACT2114422Listed by: HOWARD HANNA REAL ESTATE SERVICES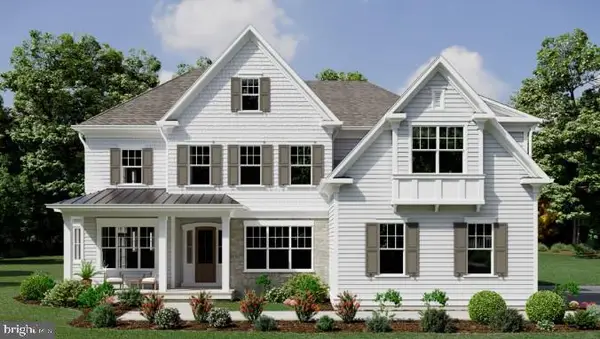 $2,354,900Pending4 beds 4 baths3,685 sq. ft.
Lot 4 Rose Glenn, DEVON, PA 19333
MLS# PACT2101882Listed by: HOWARD HANNA REAL ESTATE SERVICES
Local realty services provided by:CENTURY 21 New Millennium
Neighborhoods near Devon, PA
Zip codes near Devon, PA
- 19003 homes for sale
- 19008 homes for sale
- 19010 homes for sale
- 19035 homes for sale
- 19041 homes for sale
- 19073 homes for sale
- 19083 homes for sale
- 19085 homes for sale
- 19087 homes for sale
- 19301 homes for sale
- 19312 homes for sale
- 19333 homes for sale
- 19355 homes for sale
- 19401 homes for sale
- 19403 homes for sale
- 19405 homes for sale
- 19406 homes for sale
- 19428 homes for sale
- 19453 homes for sale
- 19481 homes for sale
Popular searches near Devon, PA
- Berwyn homes for sale
- Bryn Mawr homes for sale
- Chesterbrook homes for sale
- Easttown homes for sale
- Jeffersonville homes for sale
- King Of Prussia homes for sale
- Malvern homes for sale
- Newtown homes for sale
- Newtown Square homes for sale
- Paoli homes for sale
- Radnor Township homes for sale
- St Davids homes for sale
- Schuylkill homes for sale
- Tredyffrin homes for sale
- Upper Merion homes for sale
- Villanova homes for sale
- Villanova homes for sale
- Wayne homes for sale
- Wayne homes for sale
- Willistown homes for sale
Protect your home and budget from life's surprises with an Assurant Home Warranty, backed by a partner that supports you through every step of homeownership. Explore Plans.
©2026 Century 21 Real Estate LLC. All rights reserved. CENTURY 21®, the CENTURY 21 Logo and C21® are service marks owned by Century 21 Real Estate LLC. Century 21 Real Estate LLC fully supports the principles of the Fair Housing Act and the Equal Opportunity Act. Each office is independently owned and operated. Listing information is deemed reliable but not guaranteed accurate.