- Corner Canyon, Sandy homes for sale
- Crescent, Sandy homes for sale
- Crescent North, Sandy homes for sale
- Crescent Park, Sandy homes for sale
- Crescent Ridge, Sandy homes for sale
- Crescent View, Sandy homes for sale
- Day Ranch, Riverton homes for sale
- Eastridge, Sandy homes for sale
- Hidden Valley, Draper homes for sale
- Independence, Riverton homes for sale
- Independence at the Point, Riverton homes for sale
- Meadows, Draper homes for sale
- Mountain Point, Draper homes for sale
- North Riverton, Riverton homes for sale
- River View, Draper homes for sale
- South Jordan River, South Jordan homes for sale
- South Mountain, Draper homes for sale
- South Mountain Home, Draper homes for sale
- Summerhill, Riverton homes for sale
- Suncrest, Draper homes for sale
Draper, UT - homes for sale
300 of 354 results displayed
- New
 $2,590,000Active6 beds 6 baths8,207 sq. ft.
963 E Old English Rd, Draper, UT 84020
MLS# 2163422Listed by: SUMMIT REALTY, INC. - New
 $1,859,000Active5 beds 5 baths4,508 sq. ft.
2574 E Canyon End Dr, Draper, UT 84020
MLS# 2163298Listed by: KW WESTFIELD - New
 $1,490,000Active7 beds 5 baths5,699 sq. ft.
11603 S Fox Vista Dr, Draper, UT 84020
MLS# 2163126Listed by: KW UTAH REALTORS KELLER WILLIAMS - New
 $714,900Active5 beds 3 baths2,869 sq. ft.
14344 S Debrian Way, Draper, UT 84020
MLS# 2163109Listed by: RE/MAX ASSOCIATES - New
 $1,200,000Active5 beds 4 baths3,921 sq. ft.
13223 S Cherry Crest Dr S, Draper, UT 84020
MLS# 2163084Listed by: WINDERMERE REAL ESTATE (PARK CITY) - New
 $819,000Active4 beds 3 baths2,864 sq. ft.
11423 S 150 E, Draper, UT 84020
MLS# 2163060Listed by: EQUITY REAL ESTATE (ADVISORS) - New
 $975,000Active5 beds 4 baths4,117 sq. ft.
14737 S Canyon Wild Rd #427, Draper (UT Cnty), UT 84020
MLS# 2162981Listed by: SUMMIT SOTHEBY'S INTERNATIONAL REALTY - New
 $2,300,000Active5 beds 4 baths5,016 sq. ft.
1479 E Trail Crest Ct, Draper, UT 84020
MLS# 2162786Listed by: SUMMIT SOTHEBY'S INTERNATIONAL REALTY - New
 $1,499,999Active6 beds 4 baths5,025 sq. ft.
13261 S Ashwood Glen Way, Draper, UT 84020
MLS# 2162612Listed by: EXP REALTY, LLC - New
 $900,000Active4 beds 3 baths3,548 sq. ft.
1317 E Ballard Cv S, Draper, UT 84020
MLS# 2162647Listed by: GOBE, LLC - New
 $769,000Active4 beds 4 baths3,784 sq. ft.
15208 S Eagle Chase Dr, Draper, UT 84020
MLS# 2162552Listed by: SUMMIT SOTHEBY'S INTERNATIONAL REALTY - New
 $829,900Active6 beds 5 baths3,732 sq. ft.
14098 S Candy Pull Dr, Draper, UT 84020
MLS# 2162513Listed by: BERKSHIRE HATHAWAY HOMESERVICES ELITE REAL ESTATE - New
 $1,000,000Active5 beds 3 baths4,742 sq. ft.
533 E Jade Park Ln S, Draper, UT 84020
MLS# 2162453Listed by: NETLOGIX REALTY - New
 $1,450,000Active4 beds 4 baths4,394 sq. ft.
1283 E Corner View Ct S, Draper, UT 84020
MLS# 2162430Listed by: RE/MAX ASSOCIATES - New
 $950,000Active4 beds 3 baths3,076 sq. ft.
13308 S Cherry Crest Dr E, Draper, UT 84020
MLS# 2162441Listed by: SKYLINE REAL ESTATE GROUP - New
 $1,485,000Active5 beds 4 baths5,181 sq. ft.
1618 E Wylie Ln S, Draper, UT 84020
MLS# 2161965Listed by: CENTURY 21 EVEREST - New
 $629,900Active4 beds 3 baths1,863 sq. ft.
14368 S Honeyfield Dr E, Draper, UT 84020
MLS# 2162226Listed by: DOMAIN REAL ESTATE LLC - New
 $530,000Active4 beds 2 baths1,592 sq. ft.
11895 S Inauguration Rd, Draper, UT 84020
MLS# 2162179Listed by: CONRAD CRUZ REAL ESTATE SERVICES, LLC - New
 $1,435,000Active6 beds 4 baths5,542 sq. ft.
1647 E Wylie Ln S, Draper, UT 84020
MLS# 2162095Listed by: PRESIDIO REAL ESTATE - New
 $733,778Active3 beds 3 baths2,582 sq. ft.
267 Fushion Ln, Draper, UT 84020
MLS# 2161648Listed by: GARBETT HOMES - New
 $715,000Active5 beds 4 baths3,239 sq. ft.
15011 S Eagle Crest Dr, Draper (UT Cnty), UT 84020
MLS# 2159627Listed by: ZANDER REAL ESTATE TEAM PLLC - New
 $999,900Active4 beds 2 baths2,138 sq. ft.
255 E 13275 S, Draper, UT 84020
MLS# 2161355Listed by: FIELDSTONE REALTY LLC - New
 $1,275,000Active6 beds 5 baths4,781 sq. ft.
14648 S Springtime Rd, Draper (UT Cnty), UT 84020
MLS# 2161356Listed by: REAL BROKER, LLC - New
 $965,000Active4 beds 3 baths3,574 sq. ft.
2457 E Springtime Rd, Draper (UT Cnty), UT 84020
MLS# 2161258Listed by: REAL BROKER, LLC - New
 $619,900Active4 beds 4 baths2,274 sq. ft.
272 E Porter Ct, Draper, UT 84020
MLS# 2161151Listed by: REAL BROKER, LLC (SALT LAKE)  $849,900Pending5 beds 4 baths3,229 sq. ft.
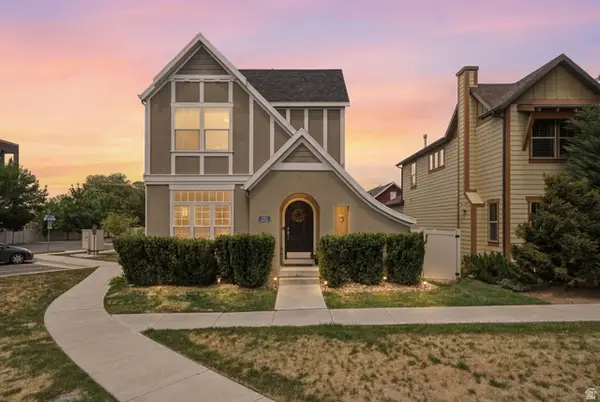
626 E Treven Pl, Draper, UT 84020
MLS# 2161003Listed by: EXP REALTY, LLC $680,000Active6 beds 3 baths2,868 sq. ft.
685 E 12000 Blvd S, Draper, UT 84020
MLS# 2160289Listed by: REALTYPATH LLC $1,695,000Active6 beds 5 baths5,499 sq. ft.
362 E 12000 S, Draper, UT 84020
MLS# 2160120Listed by: JEFFERSON STREET PROPERTIES, LLC $869,900Active2 beds 2 baths3,678 sq. ft.
2203 E Fair Winns Ln, Draper, UT 84020
MLS# 2159937Listed by: COLDWELL BANKER REALTY (SALT LAKE-SUGAR HOUSE) $515,000Active4 beds 2 baths1,532 sq. ft.
266 W Beverlee Ann Dr, Draper, UT 84020
MLS# 2159895Listed by: ERA BROKERS CONSOLIDATED (UTAH COUNTY) $969,000Active6 beds 4 baths4,349 sq. ft.
15023 S Eagle Crest Dr E, Draper (UT Cnty), UT 84020
MLS# 2159772Listed by: RE/MAX ASSOCIATES $749,000Active4 beds 3 baths2,946 sq. ft.
1433 Forge Way, Draper, UT 84020
MLS# 2159781Listed by: JUPIDOOR LLC $3,250,000Active7 beds 6 baths6,937 sq. ft.
2634 E Shortcut Dr, Draper, UT 84020
MLS# 2157073Listed by: RE/MAX ASSOCIATES $799,000Active5 beds 3 baths3,568 sq. ft.
1417 E Blacksmith Ln, Draper, UT 84020
MLS# 2159376Listed by: ERA BROKERS CONSOLIDATED (UTAH COUNTY)- Open Tue, 4 to 7pm
 $2,100,000Active6 beds 5 baths6,121 sq. ft.
12664 S Carraway Ln, Draper, UT 84020
MLS# 2159267Listed by: SUMMIT REALTY, INC.  $983,000Active4 beds 3 baths4,240 sq. ft.
1132 E Sunset Dunes Way, Draper, UT 84020
MLS# 2159087Listed by: NRE $879,000Active5 beds 4 baths3,168 sq. ft.
15139 S Holly Grove Ct E, Draper, UT 84020
MLS# 2158908Listed by: REALTYPATH LLC $949,900Active5 beds 3 baths4,172 sq. ft.
14596 S Sunset Dunes Way #63, Draper, UT 84020
MLS# 2156616Listed by: PERRY REALTY, INC. $995,000Active4 beds 4 baths4,870 sq. ft.
14798 S Glacial Peak Dr, Draper, UT 84020
MLS# 2158790Listed by: CENTURY 21 EVEREST $729,900Active3 beds 3 baths2,501 sq. ft.
11531 S Engelmann Dr, Draper, UT 84020
MLS# 2158628Listed by: KW SOUTH VALLEY KELLER WILLIAMS $649,500Active3 beds 2 baths3,320 sq. ft.
15158 S Eagle Chase Dr, Draper, UT 84020
MLS# 2158370Listed by: SONOMA CREEK REALTY LLC $850,000Active4 beds 3 baths2,638 sq. ft.
967 E 12600 S, Draper, UT 84020
MLS# 2158411Listed by: REAL BROKER, LLC $995,000Pending6 beds 4 baths4,735 sq. ft.
313 E Golden Pheasant Dr S, Draper, UT 84020
MLS# 2158434Listed by: MOVE UTAH REAL ESTATE $725,000Active4 beds 3 baths2,732 sq. ft.
15057 S Winged Bluff Ln, Draper, UT 84020
MLS# 2158339Listed by: WINDERMERE REAL ESTATE (DRAPER) $1,285,000Active5 beds 4 baths4,284 sq. ft.
12317 S Cypress Point Way, Draper, UT 84020
MLS# 2158310Listed by: MASTERS UTAH REAL ESTATE $1,295,000Pending5 beds 4 baths4,796 sq. ft.
2076 E Ash Down Ln, Draper (UT Cnty), UT 84020
MLS# 2157781Listed by: BERKSHIRE HATHAWAY HOMESERVICES ELITE REAL ESTATE $2,199,900Active7 beds 7 baths7,890 sq. ft.
513 E Southfork Dr, Draper, UT 84020
MLS# 2157659Listed by: REALTYPATH LLC $1,495,000Active6 beds 5 baths5,356 sq. ft.
1733 E Crimson Oak Dr, Draper, UT 84020
MLS# 2157524Listed by: EQUITY REAL ESTATE (RESULTS) $579,900Active4 beds 2 baths2,235 sq. ft.
1615 E Pioneer Rd, Draper, UT 84020
MLS# 2158024Listed by: ROCKY MOUNTAIN REALTY $1,250,000Active6 beds 4 baths5,294 sq. ft.
439 E Stokes Ave, Draper, UT 84020
MLS# 2157913Listed by: BICKMORE & ASSOCIATES REALTY, LLC $1,840,000Active6 beds 3 baths5,144 sq. ft.
1548 E June Cir, Draper, UT 84020
MLS# 2157870Listed by: C-SQUARED REAL ESTATE $1,190,000Active5 beds 3 baths4,350 sq. ft.
653 E Vandalay Ln, Draper, UT 84020
MLS# 2157871Listed by: REAL BROKER, LLC $700,000Active4 beds 4 baths3,386 sq. ft.
11870 S Cottage View Ln E, Draper, UT 84020
MLS# 2157580Listed by: KW UTAH REALTORS KELLER WILLIAMS (BRICKYARD) $689,000Active4 beds 4 baths2,934 sq. ft.
2007 E Fielding Ln, Draper (UT Cnty), UT 84020
MLS# 2157329Listed by: KW SOUTH VALLEY KELLER WILLIAMS $725,000Pending4 beds 4 baths2,356 sq. ft.
966 E Deer Arch Ln S, Draper, UT 84020
MLS# 2156888Listed by: PEACE TREE REALTY LLC $1,056,000Active6 beds 4 baths4,841 sq. ft.
316 E Azure Cir S, Draper, UT 84020
MLS# 2156632Listed by: DISTINCTION REAL ESTATE $1,158,000Active6 beds 5 baths4,131 sq. ft.
2466 E Lone Hill Dr., Draper, UT 84020
MLS# 2156645Listed by: COLDWELL BANKER REALTY (SALT LAKE-SUGAR HOUSE) $2,650,000Pending4 beds 5 baths6,228 sq. ft.
2373 E Bear Hills Circle, Draper, UT 84020
MLS# 12601866Listed by: BHHS UP (SALT LAKE) $1,595,000Active6 beds 4 baths4,502 sq. ft.
1712 E Somerset Ridge Dr S, Draper, UT 84020
MLS# 2156382Listed by: REAL BROKER, LLC $1,550,000Pending6 beds 5 baths5,783 sq. ft.
15211 S Lone Oak Ct, Draper, UT 84020
MLS# 2156329Listed by: SUMMIT SOTHEBY'S INTERNATIONAL REALTY $860,000Active5 beds 4 baths3,447 sq. ft.
14728 S Canyon Pointe Rd, Draper, UT 84020
MLS# 2156210Listed by: SKYLINE REAL ESTATE GROUP $1,500,000Active6 beds 4 baths5,875 sq. ft.
2184 E Eagle Crest Dr, Draper, UT 84020
MLS# 2156214Listed by: REDFIN CORPORATION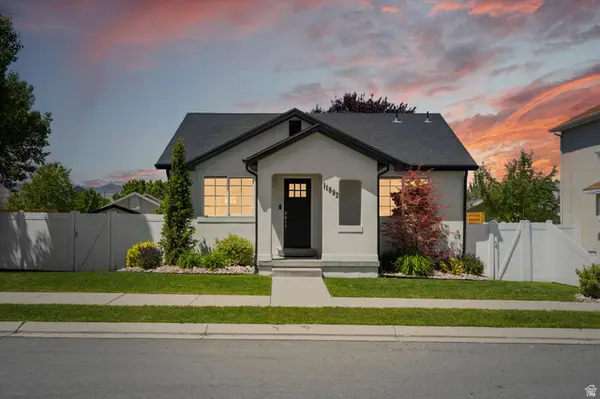 $540,000Pending3 beds 3 baths1,568 sq. ft.
11892 S Preamble Rd, Draper, UT 84020
MLS# 2156034Listed by: EXP REALTY, LLC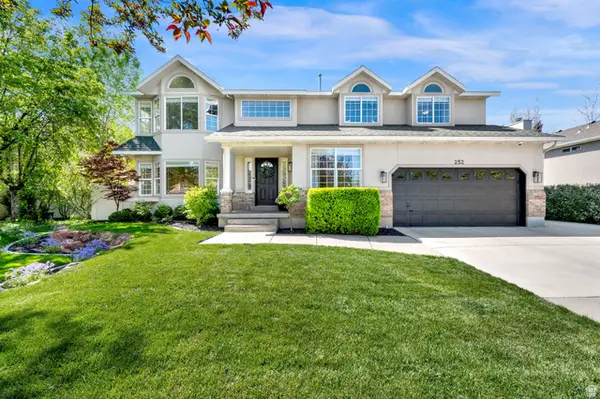 $950,000Pending6 beds 4 baths3,692 sq. ft.
252 E Cranberry Hill Dr, Draper, UT 84020
MLS# 2155608Listed by: EQUITY REAL ESTATE (ADVANTAGE) $899,900Active6 beds 3 baths3,706 sq. ft.
514 E 12600 S, Draper, UT 84020
MLS# 2155501Listed by: IMAGINE REAL ESTATE, LLC $799,625Pending3 beds 3 baths3,011 sq. ft.
504 W Maidengrass Way, Draper, UT 84020
MLS# 2155506Listed by: IVORY HOMES, LTD $1,300,000Active6 beds 4 baths4,824 sq. ft.
15008 S Springtime Rd, Draper (UT Cnty), UT 84020
MLS# 2155508Listed by: SKY REALTY $998,500Active3 beds 2 baths3,799 sq. ft.
11673 S Halls Rd, Draper, UT 84020
MLS# 2155511Listed by: IVORY HOMES, LTD $1,150,000Active6 beds 4 baths4,036 sq. ft.
13181 S Cougar Ridge Rd, Draper, UT 84020
MLS# 2155268Listed by: MANSELL REAL ESTATE INC $1,189,000Active5 beds 4 baths4,095 sq. ft.
314 E Brown Farm Ln, Draper, UT 84020
MLS# 2155178Listed by: NEWMARK MOUNTAIN WEST $2,248,000Active7 beds 6 baths8,055 sq. ft.
1503 E Meadow Bluff Ln S, Draper, UT 84020
MLS# 2155101Listed by: ARI REALTY AND INVESTMENTS $575,000Active4 beds 3 baths2,122 sq. ft.
297 W Bricker Rd, Draper, UT 84020
MLS# 2154963Listed by: INTERMOUNTAIN PROPERTIES $1,350,000Active5 beds 4 baths3,835 sq. ft.
14902 S Saddle Leaf Ct E, Draper, UT 84020
MLS# 2154887Listed by: SIGNATURE GROUP REAL ESTATE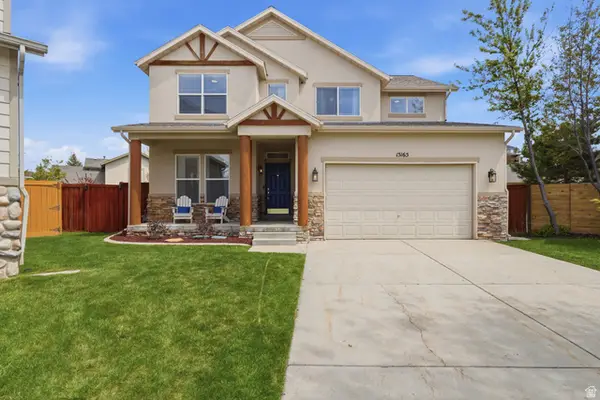 $784,900Active6 beds 4 baths3,715 sq. ft.
15165 S Silkwood Ct, Draper, UT 84020
MLS# 2154858Listed by: JEFFERSON STREET PROPERTIES, LLC $925,000Active4 beds 4 baths3,728 sq. ft.
12239 S Hannah View Ln E #54, Draper, UT 84020
MLS# 2154716Listed by: EQUITY REAL ESTATE (RESULTS) $1,175,000Pending5 beds 3 baths3,987 sq. ft.
12113 S Aiden Ridge Dr W, Draper, UT 84020
MLS# 2154687Listed by: WINDERMERE REAL ESTATE $1,150,500Pending4 beds 3 baths5,144 sq. ft.
2216 E Fair Winns Ln S, Draper (UT Cnty), UT 84020
MLS# 2154627Listed by: KW WESTFIELD (EXCELLENCE) $1,349,000Pending6 beds 4 baths4,852 sq. ft.
13258 S Cherry Crest Dr, Draper, UT 84020
MLS# 2154553Listed by: KIM FINCH REAL ESTATE $1,149,000Active5 beds 4 baths4,574 sq. ft.
603 E Southfork Dr S, Draper, UT 84020
MLS# 2154390Listed by: EQUITY REAL ESTATE (ADVANTAGE) $700,000Pending5 beds 4 baths2,306 sq. ft.
15083 S Kanab Ct, Draper, UT 84020
MLS# 2154409Listed by: REDFIN CORPORATION $565,000Pending5 beds 3 baths2,252 sq. ft.
11833 S Preamble Rd, Draper, UT 84020
MLS# 2154492Listed by: ERA BROKERS CONSOLIDATED (SALT LAKE) $749,000Active4 beds 3 baths2,868 sq. ft.
11871 S Blue Heron Dr E, Draper, UT 84020
MLS# 2154281Listed by: PRIMED REAL ESTATE LLC $1,195,000Active4 beds 3 baths4,400 sq. ft.
2189 E Fair Winns Ln, Draper (UT Cnty), UT 84020
MLS# 2154185Listed by: AK REALTY GROUP, INC. $999,999Pending6 beds 5 baths4,035 sq. ft.
483 E Crystal Spring Dr, Draper, UT 84020
MLS# 2154094Listed by: SUMMIT REALTY, INC. $1,700,000Active6 beds 5 baths6,132 sq. ft.
507 W Windmill Gate Cv, Draper, UT 84020
MLS# 2153981Listed by: SKYLINE REAL ESTATE GROUP $1,099,900Active5 beds 4 baths4,114 sq. ft.
14121 Deer Arch Ln #212, Draper, UT 84020
MLS# 2153886Listed by: RETURN REAL ESTATE, INC $750,000Pending4 beds 4 baths2,920 sq. ft.
2357 E Glacial Peak Dr, Draper, UT 84020
MLS# 2153815Listed by: WINDERMERE REAL ESTATE (DRAPER) $1,680,000Pending4 beds 4 baths5,594 sq. ft.
13432 S Corner Hollow Ct E, Draper, UT 84020
MLS# 2153610Listed by: BICKMORE & ASSOCIATES REALTY, LLC $800,000Active7 beds 4 baths3,678 sq. ft.
1930 E Aspen Leaf Pl, Draper, UT 84020
MLS# 2153183Listed by: SUMMIT SOTHEBY'S INTERNATIONAL REALTY $1,149,000Active5 beds 3 baths4,349 sq. ft.
2208 E Snow Blossom Way, Draper, UT 84020
MLS# 2153059Listed by: SKYLINE REAL ESTATE GROUP $819,500Active5 beds 4 baths3,270 sq. ft.
394 E Brewster Dr, Draper, UT 84020
MLS# 2152981Listed by: BETTER HOMES AND GARDENS REAL ESTATE MOMENTUM (LEHI) $2,250,000Active5 beds 5 baths6,493 sq. ft.
13456 S Aintree Ave, Draper, UT 84020
MLS# 2152960Listed by: UTAH REAL ESTATE PC $670,000Active4 beds 3 baths2,408 sq. ft.
12371 S Parkstone Ct E, Draper, UT 84020
MLS# 2152805Listed by: EQUITY REAL ESTATE (ADVANTAGE) $606,000Pending4 beds 3 baths3,016 sq. ft.
2037 E Brookings Dr, Draper (UT Cnty), UT 84020
MLS# 2152555Listed by: REAL ESTATE ESSENTIALS $925,000Active6 beds 4 baths3,742 sq. ft.
14732 S Snow Blossom Way, Draper, UT 84020
MLS# 2152451Listed by: SKYLINE REAL ESTATE GROUP $1,025,000Active4 beds 3 baths3,275 sq. ft.
558 E Rockwell Vis, Draper, UT 84020
MLS# 2150371Listed by: OMADA REAL ESTATE $1,225,000Pending5 beds 4 baths5,108 sq. ft.
557 E Hollow Creek Rd, Draper, UT 84020
MLS# 2152409Listed by: OPENDOOR BROKERAGE LLC $1,485,000Active6 beds 3 baths4,087 sq. ft.
2066 E Tivoli Ct, Draper, UT 84020
MLS# 2152321Listed by: EQUITY REAL ESTATE (ADVANTAGE) $1,900,000Active13 beds 13 baths7,900 sq. ft.
217 E Scenic Peak Cv, Draper, UT 84020
MLS# 2152295Listed by: REAL ESTATE ESSENTIALS (ST GEORGE) $2,650,000Pending5 beds 5 baths6,228 sq. ft.
2373 E Bear Hills Cir, Draper, UT 84020
MLS# 2152300Listed by: BERKSHIRE HATHAWAY HOMESERVICES UTAH PROPERTIES (SALT LAKE) $960,000Active4 beds 3 baths4,564 sq. ft.
2087 E Autumn Fields Ln, Draper, UT 84020
MLS# 2152212Listed by: REAL BROKER, LLC $1,449,000Pending5 beds 4 baths4,763 sq. ft.
14078 S Canyon Vista Ln E, Draper, UT 84020
MLS# 2152036Listed by: ASK ANDREW REAL ESTATE $769,000Active6 beds 4 baths3,072 sq. ft.
14225 S Adobe School Dr, Draper, UT 84020
MLS# 2151927Listed by: IMAGINE REAL ESTATE, LLC $1,425,000Active5 beds 4 baths4,831 sq. ft.
636 E Vandalay Ln S, Draper, UT 84020
MLS# 2151687Listed by: RE/MAX ASSOCIATES $689,900Pending5 beds 3 baths3,106 sq. ft.
16084 S Duck Horn Dr, Draper, UT 84020
MLS# 2151601Listed by: EQUITY REAL ESTATE (SOLID) $775,000Active4 beds 4 baths3,055 sq. ft.
14599 S Chaumont Ct, Draper, UT 84020
MLS# 2151611Listed by: PRIME REAL ESTATE EXPERTS (FOUNDERS) $649,999Pending4 beds 4 baths2,343 sq. ft.
988 E Blue Heron Cir, Draper, UT 84020
MLS# 2151342Listed by: TRUNET REAL ESTATE LLC $1,125,000Pending5 beds 4 baths4,240 sq. ft.
12182 S Pine Valley Way, Draper, UT 84020
MLS# 2151223Listed by: KW WESTFIELD- Open Tue, 6 to 9pm
 $3,950,000Active6 beds 9 baths7,403 sq. ft.
13216 S Telemark Ln E, Draper, UT 84020
MLS# 2151197Listed by: THE AGENCY SALT LAKE CITY  $925,000Active6 beds 4 baths3,677 sq. ft.
14757 S Brewster Dr, Draper, UT 84020
MLS# 2150840Listed by: KW UTAH REALTORS KELLER WILLIAMS $594,900Pending4 beds 2 baths1,803 sq. ft.
342 E 12600 S, Draper, UT 84020
MLS# 2150841Listed by: KW UTAH REALTORS KELLER WILLIAMS $2,700,000Active6 beds 6 baths7,252 sq. ft.
1777 E Somerset Ridge Dr S, Draper, UT 84020
MLS# 2150735Listed by: SUMMIT SOTHEBY'S INTERNATIONAL REALTY $715,000Pending3 beds 3 baths3,084 sq. ft.
11948 S Cottage View Ln E, Draper, UT 84020
MLS# 2150681Listed by: COLDWELL BANKER REALTY (SALT LAKE-SUGAR HOUSE) $825,000Active5 beds 3 baths3,564 sq. ft.
1873 E Oak Bend Dr, Draper, UT 84020
MLS# 2150563Listed by: WINDERMERE REAL ESTATE (DRAPER) $760,000Active4 beds 4 baths2,914 sq. ft.
13952 S Rockwell View Ln, Draper, UT 84020
MLS# 2150520Listed by: NICHE HOMES $659,000Active5 beds 4 baths2,730 sq. ft.
2001 E Fielding Ln, Draper, UT 84020
MLS# 2150246Listed by: EQUITY REAL ESTATE (SOUTH VALLEY) $1,275,000Pending6 beds 4 baths4,897 sq. ft.
13238 S Bellevue Way, Draper, UT 84020
MLS# 2149976Listed by: PRESIDIO REAL ESTATE $4,650,000Active5 beds 7 baths9,400 sq. ft.
1549 E Patterson Ln, Draper, UT 84020
MLS# 2149942Listed by: CLOUDVEIL REALTY LLC $1,149,900Active5 beds 4 baths4,679 sq. ft.
13920 Cromwell Ln, Draper, UT 84020
MLS# 2149747Listed by: MOVE UTAH REAL ESTATE $925,000Pending3 beds 3 baths3,734 sq. ft.
534 E Fox Farm Pl, Draper, UT 84020
MLS# 2149716Listed by: JUPIDOOR LLC $2,750,000Active5 beds 5 baths7,500 sq. ft.
12838 S Hickory Ridge Ln E, Draper, UT 84020
MLS# 2149669Listed by: MANSELL REAL ESTATE INC $1,149,900Active4 beds 4 baths5,045 sq. ft.
2487 E Canyon Wild Rd #413, Draper (UT Cnty), UT 84020
MLS# 2149570Listed by: DWELLINGS REAL ESTATE $1,499,999Active6 beds 4 baths5,657 sq. ft.
13206 S Cougar Ridge Rd, Draper, UT 84020
MLS# 2149572Listed by: EQUITY REAL ESTATE (SOLID) $1,100,000Active4 beds 4 baths3,772 sq. ft.
987 E Deer Arch Ln, Draper, UT 84020
MLS# 2149544Listed by: EQUITY REAL ESTATE (ADVANTAGE) $725,000Pending4 beds 4 baths2,400 sq. ft.
994 E Deer Arch Ln, Draper, UT 84020
MLS# 2149450Listed by: SUMMIT SOTHEBY'S INTERNATIONAL REALTY $699,900Pending5 beds 4 baths2,939 sq. ft.
14382 S Debrian Way, Draper, UT 84020
MLS# 2149413Listed by: JUPIDOOR LLC $1,595,000Active7 beds 4 baths5,159 sq. ft.
11694 S Engelmann Dr, Draper, UT 84020
MLS# 2149301Listed by: UTAH REAL ESTATE PC $789,000Pending5 beds 3 baths3,864 sq. ft.
2154 E Village Vista Dr, Draper (UT Cnty), UT 84020
MLS# 2149230Listed by: RE/MAX CROSSROADS $1,250,000Active5 beds 4 baths4,164 sq. ft.
14116 S Timber Ridge Dr, Draper, UT 84020
MLS# 2149075Listed by: CENTURY 21 EVEREST (PARK CITY) $875,000Pending6 beds 4 baths3,745 sq. ft.
699 E Carlquist Dr S, Draper, UT 84020
MLS# 2148829Listed by: OMADA REAL ESTATE $489,999Active2 beds 2 baths1,509 sq. ft.
13307 S 1300 E, Draper, UT 84020
MLS# 2149036Listed by: LPT REALTY, LLC $920,000Pending4 beds 3 baths2,358 sq. ft.
622 E 12000 S, Draper, UT 84020
MLS# 2149046Listed by: PRIME REAL ESTATE EXPERTS $659,800Pending4 beds 3 baths2,476 sq. ft.
14226 S Molasses Mill Dr, Draper, UT 84020
MLS# 2148733Listed by: BERKSHIRE HATHAWAY HOMESERVICES UTAH PROPERTIES (NORTH SALT LAKE) $800,000Pending6 beds 4 baths3,096 sq. ft.
414 E Cranberry Dr, Draper, UT 84020
MLS# 2148518Listed by: KW UTAH REALTORS KELLER WILLIAMS (BRICKYARD) $1,049,900Pending5 beds 4 baths4,176 sq. ft.
12091 S Katelyn Park Ct, Draper, UT 84020
MLS# 2148198Listed by: INVESTMENT REALTY ADVISORS LLC $1,200,000Pending5 beds 3 baths4,974 sq. ft.
11613 S Fox Vista Dr, Draper, UT 84020
MLS# 2147897Listed by: UTAH REAL ESTATE PC $2,400,000Active7 beds 9 baths8,047 sq. ft.
14032 S Canyon Vista Ln E, Draper, UT 84020
MLS# 2147726Listed by: REAL BROKER, LLC $1,200,000Active7 beds 4 baths3,862 sq. ft.
13856 S Cromwell Ln E, Draper, UT 84020
MLS# 2147596Listed by: CENTURY 21 EVEREST $799,999Pending4 beds 4 baths3,380 sq. ft.
2181 E Bald Eagle Ct, Draper, UT 84020
MLS# 2147525Listed by: EQUITY REAL ESTATE (SOUTH VALLEY) $640,000Pending3 beds 3 baths1,792 sq. ft.
14846 S Steep Mountain Dr, Draper, UT 84020
MLS# 2147515Listed by: HALLMARK REAL ESTATE COMPANY OF UTAH $860,000Pending5 beds 4 baths3,672 sq. ft.
12761 S Whisper Bend Dr, Draper, UT 84020
MLS# 2147342Listed by: IMAGINE REAL ESTATE, LLC $849,000Active4 beds 4 baths3,618 sq. ft.
169 Manilla Dr, Draper, UT 84020
MLS# 2147336Listed by: REAL ESTATE ESSENTIALS $650,000Pending4 beds 4 baths2,267 sq. ft.
336 E Steep Mountain Dr, Draper, UT 84020
MLS# 2147290Listed by: REAL BROKER, LLC $1,698,800Active5 beds 5 baths7,098 sq. ft.
1209 E Bear Hollow Cv, Draper, UT 84020
MLS# 2147254Listed by: ERA BROKERS CONSOLIDATED (UTAH COUNTY) $665,000Pending4 beds 4 baths2,320 sq. ft.
14436 S Debrian Way E, Draper, UT 84020
MLS# 2147104Listed by: EQUITY REAL ESTATE (RESULTS) $685,000Active5 beds 3 baths2,849 sq. ft.
14301 S Elsbrook Cir, Draper, UT 84020
MLS# 2146881Listed by: JORDAN REAL ESTATE LLC $729,900Active4 beds 3 baths3,114 sq. ft.
12542 S Stonebridge Cir E, Draper, UT 84020
MLS# 2146792Listed by: MANSELL REAL ESTATE INC $575,000Pending4 beds 4 baths1,972 sq. ft.
1870 E Oak Bend Dr S, Draper, UT 84020
MLS# 2147213Listed by: UNITY GROUP REAL ESTATE (WASATCH BACK) $1,679,900Active6 beds 5 baths5,452 sq. ft.
13202 S Sunset Glen Way, Draper, UT 84020
MLS# 2146388Listed by: WEST REAL ESTATE LLC $1,350,000Pending5 beds 3 baths4,495 sq. ft.
14711 S Ravine Rock Way E, Draper, UT 84020
MLS# 2146204Listed by: SIGNATURE REAL ESTATE UTAH (COTTONWOOD HEIGHTS) $725,000Pending3 beds 3 baths2,538 sq. ft.
1434 E Blacksmith Ln S, Draper, UT 84020
MLS# 2146211Listed by: KW SOUTH VALLEY KELLER WILLIAMS $1,125,000Pending5 beds 4 baths4,240 sq. ft.
12182 S Pine Valley Way, Draper, UT 84020
MLS# 2123255Listed by: KW WESTFIELD $715,000Pending5 beds 4 baths2,280 sq. ft.
12152 S Gracie View Pl W, Draper, UT 84020
MLS# 2146058Listed by: WINDERMERE REAL ESTATE (DRAPER) $875,000Pending3 beds 3 baths3,708 sq. ft.
1083 E Skyler Dr, Draper, UT 84020
MLS# 2146073Listed by: NRE $899,000Pending4 beds 3 baths3,248 sq. ft.
12615 S 600 E, Draper, UT 84020
MLS# 2146125Listed by: REAL BROKER, LLC $756,500Pending5 beds 4 baths2,616 sq. ft.
392 Cranberry Hill Dr, Draper, UT 84020
MLS# 2146018Listed by: REDFIN CORPORATION $689,900Pending3 beds 3 baths2,684 sq. ft.
11437 S Engelmann Dr, Draper, UT 84020
MLS# 2145984Listed by: IVORY HOMES, LTD $664,000Active4 beds 3 baths3,152 sq. ft.
15139 S Auburn Ridge Ln, Draper, UT 84020
MLS# 2145812Listed by: CENTURY 21 EVEREST $6,500,000Active8 beds 9 baths19,442 sq. ft.
14249 S Canyon Vine Cv, Draper, UT 84020
MLS# 2145739Listed by: MANSELL REAL ESTATE INC $1,250,000Pending4 beds 4 baths3,698 sq. ft.
1287 E Corner View Ct, Draper, UT 84020
MLS# 2145679Listed by: KW WESTFIELD $1,600,000Pending6 beds 4 baths6,009 sq. ft.
329 E Brown Farm Ln S, Draper, UT 84020
MLS# 2145687Listed by: MANSELL REAL ESTATE INC $1,295,000Pending5 beds 4 baths4,849 sq. ft.
1653 E Pear Orchard Ct, Draper, UT 84020
MLS# 2145702Listed by: PRIMED REAL ESTATE LLC $1,220,000Pending6 beds 5 baths4,788 sq. ft.
587 W Cephus Rd S, Draper, UT 84020
MLS# 2144883Listed by: DOMAIN REAL ESTATE LLC $935,000Pending4 beds 4 baths3,352 sq. ft.
14679 S Glacial Peak Dr, Draper, UT 84020
MLS# 2144542Listed by: WINDERMERE REAL ESTATE (DRAPER) $1,275,000Active5 beds 4 baths4,649 sq. ft.
15866 S Mercer Cv, Draper, UT 84020
MLS# 2144271Listed by: CENTURY 21 WASATCH LIFE REALTY $824,900Active4 beds 3 baths3,898 sq. ft.
2158 E Bald Eagle Ct S, Draper (UT Cnty), UT 84020
MLS# 2144228Listed by: SIGNATURE GROUP REAL ESTATE $1,199,900Active5 beds 4 baths4,665 sq. ft.
2016 E Graystone Ln S, Draper, UT 84020
MLS# 2144193Listed by: COLDWELL BANKER REALTY (UNION HEIGHTS) $2,695,000Pending6 beds 6 baths7,254 sq. ft.
13454 S Tuscalee Way E, Draper, UT 84020
MLS# 2144199Listed by: COLDWELL BANKER REALTY (HEBER) $530,000Active3 beds 2 baths1,780 sq. ft.
264 W 13165 S, Draper, UT 84020
MLS# 2144107Listed by: REAL BROKER, LLC (DRAPER) $1,499,900Active5 beds 4 baths5,219 sq. ft.
11708 S Engelmann Dr, Draper, UT 84020
MLS# 2143901Listed by: ERA BROKERS CONSOLIDATED (UTAH COUNTY) $3,249,000Active6 beds 8 baths6,582 sq. ft.
714 E Draper Heights Way, Draper, UT 84020
MLS# 2143397Listed by: RLS REAL ESTATE LLC $1,100,000Pending4 beds 3 baths3,844 sq. ft.
1139 E Sunscape Ln S, Draper, UT 84020
MLS# 2143231Listed by: REAL BROKER, LLC $1,250,000Pending6 beds 4 baths4,942 sq. ft.
1907 E Aspen Leaf Pl S, Draper, UT 84020
MLS# 2143236Listed by: SUMMIT SOTHEBY'S INTERNATIONAL REALTY $1,490,000Active5 beds 5 baths6,071 sq. ft.
724 W Maple Drift Ln, Draper, UT 84020
MLS# 2143040Listed by: COLDWELL BANKER REALTY (UNION HEIGHTS) $2,150,000Active5 beds 6 baths6,280 sq. ft.
13543 S Aintree Ave, Draper, UT 84020
MLS# 2143023Listed by: RE/MAX ASSOCIATES $1,150,000Active5 beds 4 baths4,000 sq. ft.
1285 E Manfield Way, Draper, UT 84020
MLS# 2142989Listed by: COLDWELL BANKER REALTY (UNION HEIGHTS) $895,000Active6 beds 3 baths3,515 sq. ft.
13176 S Day Ct E, Draper, UT 84020
MLS# 2142725Listed by: PORTER ONE REALTY LLC $2,185,000Pending6 beds 4 baths4,897 sq. ft.
1103 E Lone Peak Ln, Draper, UT 84020
MLS# 2142369Listed by: BERKSHIRE HATHAWAY HOMESERVICES ELITE REAL ESTATE $1,225,000Active6 beds 4 baths4,350 sq. ft.
12298 S Graystone Ct E, Draper, UT 84020
MLS# 2142335Listed by: NETLOGIX REALTY $1,200,000Pending3 beds 4 baths3,051 sq. ft.
12062 S 540 E, Draper, UT 84020
MLS# 2142226Listed by: SUMMIT SOTHEBY'S INTERNATIONAL REALTY $995,000Pending5 beds 4 baths3,223 sq. ft.
23 E Manilla Cir, Draper, UT 84020
MLS# 2142119Listed by: AMERICA'S BEST REAL ESTATE $1,575,000Pending6 beds 5 baths5,020 sq. ft.
13208 S Sunset Glen Way, Draper, UT 84020
MLS# 2141970Listed by: MANSELL REAL ESTATE INC (SALT LAKE) $1,295,000Pending5 beds 4 baths4,104 sq. ft.
528 E 13710 S, Draper, UT 84020
MLS# 2141275Listed by: MOVE UTAH REAL ESTATE $719,900Pending4 beds 3 baths2,131 sq. ft.
13818 S Vestry Rd #59, Draper, UT 84020
MLS# 2141741Listed by: DESERT BLOSSOM REALTY LC $949,000Pending6 beds 4 baths3,815 sq. ft.
584 E Camden Pointe Cv, Draper, UT 84020
MLS# 2141441Listed by: REAL BROKER, LLC $1,075,000Pending6 beds 4 baths3,876 sq. ft.
14013 S Pine Mesa Dr E, Draper, UT 84020
MLS# 2141095Listed by: WINDERMERE REAL ESTATE $808,500Pending4 beds 4 baths2,723 sq. ft.
15098 S Panguitch Pl, Draper, UT 84020
MLS# 2140916Listed by: ZANDER REAL ESTATE TEAM PLLC $1,499,999Pending5 beds 4 baths4,940 sq. ft.
1518 E Stanford Ct, Draper, UT 84020
MLS# 2140878Listed by: LEGACY GROUP REAL ESTATE PLLC $995,000Pending5 beds 4 baths3,682 sq. ft.
311 E Unchartered Ln S, Draper, UT 84020
MLS# 2140317Listed by: COLDWELL BANKER REALTY (SALT LAKE-SUGAR HOUSE) $2,399,000Pending6 beds 7 baths7,572 sq. ft.
12268 S Raleigh Ct, Draper, UT 84020
MLS# 2140326Listed by: CHAPMAN-RICHARDS & ASSOCIATES, INC. $1,129,000Pending4 beds 3 baths4,400 sq. ft.
15724 S Rolling Bluff Dr, Draper (UT Cnty), UT 84020
MLS# 2140216Listed by: FLAT RATE HOMES $1,500,000Pending6 beds 4 baths5,703 sq. ft.
2403 E Bear Hills Cir, Draper, UT 84020
MLS# 2139413Listed by: KW UTAH REALTORS KELLER WILLIAMS $749,000Active4 beds 3 baths3,450 sq. ft.
352 E Haven Crest Rd, Draper, UT 84020
MLS# 2140028Listed by: PRESIDIO REAL ESTATE (RIVER HEIGHTS) $2,890,000Active5 beds 7 baths7,206 sq. ft.
12056 S Cortina Crest Dr, Draper, UT 84020
MLS# 2139802Listed by: SUMMIT SOTHEBY'S INTERNATIONAL REALTY $635,000Pending3 beds 3 baths2,921 sq. ft.
13888 S Wheadon Ct, Draper, UT 84020
MLS# 2139740Listed by: ELITE PROPERTY MANAGEMENT & REAL ESTATE $1,799,900Pending7 beds 6 baths5,265 sq. ft.
11872 S Ridge Oak Ln, Draper, UT 84020
MLS# 2138264Listed by: RE/MAX ASSOCIATES $755,000Active4 beds 3 baths4,215 sq. ft.
337 E Brayden Way, Draper, UT 84020
MLS# 2138091Listed by: BLACK DIAMOND REALTY $1,099,000Pending7 beds 5 baths5,086 sq. ft.
1536 E Lantern Ln, Draper, UT 84020
MLS# 2138015Listed by: BANGERTER BROTHERS REALTY, LLC $1,099,999Pending6 beds 4 baths5,058 sq. ft.
1917 E Aspen Leaf Pl, Draper, UT 84020
MLS# 2137499Listed by: PRESIDIO REAL ESTATE $1,800,000Pending5 beds 4 baths4,852 sq. ft.
1536 E Trail Crest Ct, Draper, UT 84020
MLS# 2137426Listed by: RE/MAX ASSOCIATES $1,499,900Active5 beds 4 baths4,474 sq. ft.
11617 S Wildrye Field Way, Draper, UT 84020
MLS# 2136913Listed by: BERKSHIRE HATHAWAY HOMESERVICES ELITE REAL ESTATE $1,249,000Pending4 beds 4 baths4,107 sq. ft.
657 E Vandalay Ln S, Draper, UT 84020
MLS# 2136229Listed by: AXIS REALTY GROUP $687,500Active4 beds 3 baths2,892 sq. ft.
1370 E Meadow Valley Dr, Draper, UT 84020
MLS# 2130583Listed by: EQUITY REAL ESTATE (PREMIER ELITE) $2,350,000Active6 beds 5 baths5,030 sq. ft.
1306 E Victor Ln, Draper, UT 84020
MLS# 2135787Listed by: UTAH REALTY $785,000Pending5 beds 4 baths3,886 sq. ft.
624 E Rocky Knoll Ln S, Draper, UT 84020
MLS# 2135536Listed by: HOMIE $1,150,000Pending4 beds 4 baths4,919 sq. ft.
14132 S Canyon Vista Ln, Draper, UT 84020
MLS# 2135524Listed by: REAL BROKER, LLC $1,125,000Pending5 beds 5 baths4,917 sq. ft.
1483 E Tumbleweed Way, Draper, UT 84020
MLS# 2135354Listed by: LAKEBRIDGE REALTY LLC $1,100,000Pending4 beds 3 baths3,570 sq. ft.
12567 S Blacksmith Ln, Draper, UT 84020
MLS# 2135057Listed by: R AND R REALTY LLC $925,000Pending4 beds 3 baths3,676 sq. ft.
2433 E Springtime Rd, Draper (UT Cnty), UT 84020
MLS# 2134844Listed by: REAL BROKER, LLC $949,900Pending4 beds 3 baths4,936 sq. ft.
14948 S Springtime Rd, Draper, UT 84020
MLS# 2134275Listed by: EQUITY REAL ESTATE (SOLID) $1,435,000Pending7 beds 5 baths5,484 sq. ft.
13520 S Lone Rock Dr, Draper, UT 84020
MLS# 2135327Listed by: REAL BROKER, LLC (FARMINGTON) $989,000Pending5 beds 3 baths3,900 sq. ft.
645 E Rocky Mouth Ln, Draper, UT 84020
MLS# 2134040Listed by: WINDERMERE REAL ESTATE (DAYBREAK) $564,900Pending4 beds 3 baths1,766 sq. ft.
269 W Beverlee Ann Dr #11720, Draper, UT 84020
MLS# 2133967Listed by: EQUITY SUMMIT GROUP PC $1,059,847Active3 beds 3 baths4,285 sq. ft.
11749 S Halls Rd, Draper, UT 84020
MLS# 2133782Listed by: IVORY HOMES, LTD $1,029,119Active3 beds 3 baths3,652 sq. ft.
11781 S Halls Rd, Draper, UT 84020
MLS# 2133787Listed by: IVORY HOMES, LTD $650,000Pending3 beds 3 baths2,604 sq. ft.
1154 E Parkstone Dr #125, Draper, UT 84020
MLS# 2133793Listed by: REALTY ONE GROUP SIGNATURE (SOUTH VALLEY) $1,228,478Pending4 beds 3 baths4,056 sq. ft.
11566 S Junegrass Dr, Draper, UT 84020
MLS# 2133798Listed by: IVORY HOMES, LTD $1,249,260Active6 beds 4 baths4,949 sq. ft.
11711 S Halls Rd, Draper, UT 84020
MLS# 2133761Listed by: IVORY HOMES, LTD $1,099,395Pending4 beds 3 baths4,056 sq. ft.
11737 S Halls Rd, Draper, UT 84020
MLS# 2133777Listed by: IVORY HOMES, LTD $635,000Active3 beds 3 baths2,893 sq. ft.
16065 S Timber Brook Dr E, Draper (UT Cnty), UT 84020
MLS# 2133605Listed by: ERA BROKERS CONSOLIDATED (SALT LAKE) $639,995Active6 beds 2 baths2,116 sq. ft.
13160 S 300 E, Draper, UT 84020
MLS# 2133600Listed by: EXCLUSIVE REAL ESTATE LLC $925,000Pending4 beds 3 baths3,961 sq. ft.
168 E Harvest Berry Pl, Draper, UT 84020
MLS# 2133328Listed by: EQUITY REAL ESTATE (PREMIER ELITE) $725,000Pending6 beds 4 baths3,303 sq. ft.
2043 E Brookings Dr, Draper (UT Cnty), UT 84020
MLS# 2132481Listed by: MANSELL REAL ESTATE INC (UTAH COUNTY) $700,000Pending3 beds 3 baths3,408 sq. ft.
157 E Kimballfield Ln, Draper, UT 84020
MLS# 2132251Listed by: SELLING SALT LAKE $669,900Pending5 beds 4 baths2,613 sq. ft.
1887 E Chimney Stone Rd, Draper (UT Cnty), UT 84020
MLS# 2132204Listed by: REALTYPATH LLC (SOUTH VALLEY) $1,983,790Pending6 beds 5 baths7,032 sq. ft.
11618 S Rolands Dr W #316, Draper, UT 84020
MLS# 2131933Listed by: WRIGHT REALTY, LC $995,000Pending6 beds 4 baths4,305 sq. ft.
12321 S Graystone Ct, Draper, UT 84020
MLS# 2131444Listed by: BERKSHIRE HATHAWAY HOMESERVICES UTAH PROPERTIES (SALT LAKE) $549,000Pending4 beds 2 baths2,082 sq. ft.
12640 S Relation St E, Draper, UT 84020
MLS# 2131400Listed by: WINDERMERE REAL ESTATE $1,195,000Active8 beds 4 baths4,765 sq. ft.
552 W Sunset Crest Way S, Draper, UT 84020
MLS# 2130815Listed by: UTAH SELECT REALTY PC $1,795,000Pending4 beds 4 baths6,971 sq. ft.
11552 S Sweet Grass Ct, Draper, UT 84020
MLS# 2130720Listed by: CENTURY 21 EVEREST $739,900Pending5 beds 3 baths3,164 sq. ft.
102 E Manilla Dr, Draper, UT 84020
MLS# 2130630Listed by: EXP REALTY, LLC $1,150,000Pending4 beds 3 baths4,400 sq. ft.
15734 S Rolling Bluff Dr, Draper (UT Cnty), UT 84020
MLS# 2130618Listed by: FLAT RATE HOMES $1,700,000Pending5 beds 5 baths7,567 sq. ft.
15579 S Mercer Ct, Draper (UT Cnty), UT 84020
MLS# 2130427Listed by: WINDERMERE REAL ESTATE (DRAPER) $1,750,000Pending5 beds 5 baths5,113 sq. ft.
13287 S Old Farm Cv, Draper, UT 84020
MLS# 2129910Listed by: REALTY ONE GROUP SIGNATURE $884,900Pending3 beds 3 baths4,370 sq. ft.
11979 S Draper Ridge Dr, Draper, UT 84020
MLS# 2129914Listed by: HARDEY REALTY GROUP $1,250,000Pending5 beds 6 baths5,591 sq. ft.
1694 E Apple Orchard Ct S, Draper, UT 84020
MLS# 2129612Listed by: WINDERMERE REAL ESTATE $999,000Active4 beds 4 baths4,113 sq. ft.
14133 S Spyglass Hill Dr, Draper, UT 84020
MLS# 2129536Listed by: EQUITY REAL ESTATE (PREMIER ELITE) $664,900Pending5 beds 4 baths2,846 sq. ft.
16073 S Fielding Ln, Draper, UT 84020
MLS# 2129540Listed by: KW UTAH REALTORS KELLER WILLIAMS $1,100,000Pending6 beds 4 baths4,075 sq. ft.
14832 S Springtime Rd, Draper (UT Cnty), UT 84020
MLS# 2129444Listed by: COLDWELL BANKER REALTY (UNION HEIGHTS) $1,100,000Pending6 beds 4 baths4,653 sq. ft.
14648 S Pristine View Cv, Draper, UT 84020
MLS# 2128554Listed by: UTAH FIRST REALTY $640,000Pending4 beds 3 baths2,150 sq. ft.
721 E Shading Ln, Draper, UT 84020
MLS# 2128379Listed by: MANSELL REAL ESTATE INC $1,050,000Pending4 beds 3 baths4,571 sq. ft.
1501 E Stanford Ct S, Draper, UT 84020
MLS# 2128246Listed by: SUMMIT SOTHEBY'S INTERNATIONAL REALTY $1,250,000Active4 beds 2 baths2,212 sq. ft.
11743 S 700 E, Draper, UT 84020
MLS# 2128102Listed by: WILLIAMS REALTY PC $1,098,750Pending5 beds 3 baths3,950 sq. ft.
261 E Concord Farm Ln #6, Draper, UT 84020
MLS# 2127172Listed by: PRIMED REAL ESTATE LLC $699,000Pending5 beds 2 baths2,340 sq. ft.
527 W 11400 S, Draper, UT 84020
MLS# 2127023Listed by: PRESIDIO REAL ESTATE (SOUTH VALLEY) $985,000Pending4 beds 3 baths4,120 sq. ft.
2154 E Viscaya Dr, Draper (UT Cnty), UT 84020
MLS# 2126800Listed by: LARSON & COMPANY REAL ESTATE $4,499,000Active6 beds 6 baths8,123 sq. ft.
1468 E Trail Crest Ct, Draper, UT 84020
MLS# 2126709Listed by: WOODLEY REAL ESTATE $1,230,000Active3 beds 5 baths4,344 sq. ft.
11618 S Douglas Dr, Draper, UT 84020
MLS# 2126130Listed by: EQUITY REAL ESTATE (RESULTS) $682,270Pending3 beds 3 baths3,072 sq. ft.
11538 S Engelmann Dr, Draper, UT 84020
MLS# 2126046Listed by: IVORY HOMES, LTD $1,299,000Pending6 beds 4 baths4,126 sq. ft.
284 E Concord Farm Ln #8, Draper, UT 84020
MLS# 2125263Listed by: PRIMED REAL ESTATE LLC $1,650,000Pending6 beds 5 baths5,240 sq. ft.
13353 S Peach Orchard Ct, Draper, UT 84020
MLS# 2124955Listed by: UTAH REAL ESTATE PC $2,249,000Pending6 beds 6 baths5,754 sq. ft.
14658 S Shortcut Dr, Draper, UT 84020
MLS# 2124912Listed by: WINDERMERE REAL ESTATE (DRAPER) $683,000Pending4 beds 2 baths2,128 sq. ft.
544 E 11900 S, Draper, UT 84020
MLS# 2124279Listed by: DELUXE UTAH REAL ESTATE (NORTH) $834,900Active3 beds 3 baths2,955 sq. ft.
352 E Mistilake Ln #20, Draper, UT 84020
MLS# 2124237Listed by: C.W. MANAGEMENT CORPORATION $997,000Pending5 beds 4 baths3,559 sq. ft.
479 E Fox Farm Pl S, Draper, UT 84020
MLS# 2123993Listed by: NVS REAL ESTATE, INC. $1,102,952Pending8 beds 8 baths11,417 sq. ft.
13052 S Green Clover Rd, Draper, UT 84020
MLS# 2123848Listed by: SUMMIT REALTY, INC. $2,999,000Active5 beds 6 baths6,793 sq. ft.
12958 S 300 E, Draper, UT 84020
MLS# 2123526Listed by: UTAH REAL ESTATE PC $850,000Pending4 beds 5 baths5,316 sq. ft.
14678 S Silver Blossom Way E, Draper, UT 84020
MLS# 2123299Listed by: WINDERMERE REAL ESTATE (DRAPER) $850,000Pending4 beds 3 baths3,597 sq. ft.
14726 S Snow Blossom Way E, Draper, UT 84020
MLS# 2122976Listed by: WINDERMERE REAL ESTATE (DRAPER) $1,800,000Pending5 beds 5 baths5,277 sq. ft.
2412 E Bear Hills Dr S, Draper, UT 84020
MLS# 2122768Listed by: SUMMIT SOTHEBY'S INTERNATIONAL REALTY $1,979,000Pending6 beds 5 baths6,522 sq. ft.
13302 S Corner Wood Dr, Draper, UT 84020
MLS# 2122248Listed by: BERKSHIRE HATHAWAY HOMESERVICES UTAH PROPERTIES (SALT LAKE) $929,900Pending5 beds 3 baths4,011 sq. ft.
1422 E Cherry Canyon Way, Draper, UT 84020
MLS# 2122079Listed by: EQUITY REAL ESTATE (PREMIER ELITE) $1,199,999Pending3 beds 3 baths4,400 sq. ft.
11534 S Sweet Grass Ct, Draper, UT 84020
MLS# 2121688Listed by: UNITY GROUP REAL ESTATE LLC $850,000Pending6 beds 4 baths3,703 sq. ft.
14023 S Hawberry Rd, Draper, UT 84020
MLS# 2121695Listed by: SUMMIT SOTHEBY'S INTERNATIONAL REALTY $779,900Pending5 beds 3 baths2,982 sq. ft.
179 Stonepark Cir, Draper, UT 84020
MLS# 2121186Listed by: MANSELL REAL ESTATE INC $677,000Pending4 beds 4 baths2,214 sq. ft.
14345 S Lapis Dr E, Draper, UT 84020
MLS# 2120858Listed by: REALTYPATH LLC (PLATINUM) $485,000Pending3 beds 2 baths1,378 sq. ft.
11880 S Landou Dr W, Draper, UT 84020
MLS# 2120821Listed by: PRESIDIO REAL ESTATE (MOUNTAIN VIEW) $1,500,000Active7 beds 6 baths6,753 sq. ft.
1263 E Wild Maple Ct, Draper, UT 84020
MLS# 2120594Listed by: SUMMIT SOTHEBY'S INTERNATIONAL REALTY $1,150,000Pending7 beds 4 baths4,227 sq. ft.
13448 S Saddle Ridge Dr E, Draper, UT 84020
MLS# 2120461Listed by: BERKSHIRE HATHAWAY HOMESERVICES UTAH PROPERTIES (SALT LAKE) $699,500Pending4 beds 4 baths2,604 sq. ft.
427 E Parowan, Draper, UT 84020
MLS# 2120263Listed by: EXP REALTY, LLC $649,900Pending5 beds 3 baths3,087 sq. ft.
14971 S Winged Bluff Ln, Draper, UT 84020
MLS# 2120061Listed by: UTAH HOME EXPERTS, LLC $1,550,000Pending6 beds 4 baths5,854 sq. ft.
2026 E Tivoli Hills Ct, Draper, UT 84020
MLS# 2119928Listed by: ULRICH REALTORS, INC. $1,150,000Pending4 beds 3 baths4,355 sq. ft.
11699 S Halls Creek Rd, Draper, UT 84020
MLS# 2119795Listed by: IVORY HOMES, LTD $1,298,000Pending7 beds 5 baths5,699 sq. ft.
1807 Standing Oak Dr, Draper, UT 84020
MLS# 2119029Listed by: REAL ESTATE ESSENTIALS $767,530Pending3 beds 3 baths3,011 sq. ft.
11559 S Junegrass Dr, Draper, UT 84020
MLS# 2118946Listed by: IVORY HOMES, LTD $579,000Pending4 beds 3 baths1,924 sq. ft.
1137 E Parkstone Dr, Draper, UT 84020
MLS# 2118579Listed by: FLAT RATE HOMES $925,000Pending5 beds 3 baths4,667 sq. ft.
13128 S Day Meadow Dr E, Draper, UT 84020
MLS# 2117990Listed by: COLDWELL BANKER REALTY (UNION HEIGHTS) $679,999Pending6 beds 3 baths3,164 sq. ft.
913 E Spiers Ln, Draper, UT 84020
MLS# 2117925Listed by: FATHOM REALTY (UNION PARK) $3,599,000Active8 beds 7 baths7,724 sq. ft.
14691 S Canyon Peak Dr #40, Draper, UT 84020
MLS# 2117933Listed by: CENTURY 21 EVEREST $694,000Pending5 beds 4 baths3,861 sq. ft.
1871 E Chimney Stone Ct S, Draper, UT 84020
MLS# 2117859Listed by: COLDWELL BANKER REALTY (UNION HEIGHTS) $487,000Pending2 beds 1 baths816 sq. ft.
13040 S 1300 E, Draper, UT 84020
MLS# 2117788Listed by: PRESIDIO REAL ESTATE (SOUTH VALLEY) $2,950,000Pending6 beds 6 baths9,275 sq. ft.
14687 S Nestled Cv E, Draper, UT 84020
MLS# 2117692Listed by: SUMMIT SOTHEBY'S INTERNATIONAL REALTY $1,549,999Pending4 beds 5 baths5,629 sq. ft.
12882 S Ellerbeck Ln #12882, Draper, UT 84020
MLS# 2117025Listed by: REALTYPATH LLC (CACHE VALLEY) $815,000Pending3 beds 3 baths3,372 sq. ft.
12543 S Forge Way, Draper, UT 84020
MLS# 2116708Listed by: KW SOUTH VALLEY KELLER WILLIAMS $1,560,000Active7 beds 4 baths4,506 sq. ft.
14637 S Canyon Pointe Rd, Draper (UT Cnty), UT 84020
MLS# 2116676Listed by: SUMMIT SOTHEBY'S INTERNATIONAL REALTY $1,175,000Pending5 beds 3 baths4,584 sq. ft.
587 E Corner Canyon Dr, Draper, UT 84020
MLS# 2116416Listed by: FATHOM REALTY (OREM) $1,185,000Pending5 beds 4 baths3,818 sq. ft.
283 E Concord Farm Ln S #2, Draper, UT 84020
MLS# 2116293Listed by: PRIMED REAL ESTATE LLC $629,000Pending5 beds 3 baths2,408 sq. ft.
291 W Bubbling Brook Ln, Draper, UT 84020
MLS# 2116200Listed by: RANLIFE REAL ESTATE INC $2,199,999Pending6 beds 5 baths7,272 sq. ft.
1481 E Meadow Bluff Ln, Draper, UT 84020
MLS# 2115670Listed by: JMF REAL ESTATE SERVICES $995,000Pending7 beds 4 baths4,472 sq. ft.
1267 E Hickenlooper Way S, Draper, UT 84020
MLS# 2115577Listed by: REAL BROKER, LLC (PARK CITY) $655,000Pending4 beds 3 baths3,484 sq. ft.
13213 S 245 W, Draper, UT 84020
MLS# 2115471Listed by: REALTY ONE GROUP SIGNATURE (SOUTH VALLEY) $925,000Pending6 beds 4 baths4,146 sq. ft.
480 E Foxstone Cv, Draper, UT 84020
MLS# 2115460Listed by: SUMMIT SOTHEBY'S INTERNATIONAL REALTY $975,000Pending4 beds 4 baths4,212 sq. ft.
1945 E Seven Oaks Ln, Draper, UT 84020
MLS# 2115234Listed by: MANSELL REAL ESTATE INC $659,000Pending4 beds 3 baths2,726 sq. ft.
16047 S Timber Brook Dr, Draper, UT 84020
MLS# 2132684Listed by: REAL BROKER, LLC $949,000Pending5 beds 4 baths3,754 sq. ft.
259 E Red Leaf Dr S, Draper, UT 84020
MLS# 2113960Listed by: COLDWELL BANKER REALTY (UNION HEIGHTS) $649,900Pending5 beds 4 baths2,453 sq. ft.
795 E Sunrise View Dr, Draper, UT 84020
MLS# 2113666Listed by: COLDWELL BANKER REALTY (PARK CITY-NEWPARK) $595,000Pending3 beds 2 baths2,824 sq. ft.
1823 E Walnut Grove Dr S, Draper, UT 84020
MLS# 2104406Listed by: CAPITAL INVESTMENT REAL ESTATE LLC $850,000Pending5 beds 4 baths3,377 sq. ft.
15185 Briar Crest Ct, Draper, UT 84020
MLS# 2112336Listed by: WINDERMERE REAL ESTATE (DRAPER) $1,899,900Pending5 beds 5 baths5,842 sq. ft.
848 E Rosefield, Draper, UT 84020
MLS# 2112087Listed by: PRIDE AND PROPERTY REALTY LLC $500,000Pending4 beds 2 baths1,568 sq. ft.
407 W Election Rd S, Draper, UT 84020
MLS# 2111909Listed by: WISER REAL ESTATE, LLC
Local realty services provided by:CENTURY 21 Lifestyle Real Estate, CENTURY 21 Everest
The information provided is for consumers' personal, non-commercial use and may not be used for any purpose other than to identify prospective properties consumers may be interested in purchasing. All properties are subject to prior sale or withdrawal. All information provided is deemed reliable but is not guaranteed accurate, and should be independently verified. The multiple listing information is provided by Park City Board of REALTORS<REGISTERED_LOGO> from a copyrighted compilation of listings. The compilation of listings and each individual listing are 2026 Park City Board of REALTORS<REGISTERED_LOGO>, All Rights Reserved. Access to the multiple listing information through this website is made available by CENTURY 21 Everest as a member of the Park City Board of REALTORS<REGISTERED_LOGO> multiple listing service. UT_PCBR Member Broker: Russel Orchard
Neighborhoods near Draper, UT
Zip codes near Draper, UT
- 84003 homes for sale
- 84004 homes for sale
- 84009 homes for sale
- 84020 homes for sale
- 84043 homes for sale
- 84047 homes for sale
- 84048 homes for sale
- 84062 homes for sale
- 84065 homes for sale
- 84070 homes for sale
- 84084 homes for sale
- 84088 homes for sale
- 84092 homes for sale
- 84093 homes for sale
- 84094 homes for sale
- 84095 homes for sale
- 84096 homes for sale
- 84107 homes for sale
- 84117 homes for sale
- 84123 homes for sale
Popular searches near Draper, UT
- Alpine homes for sale
- American Fork homes for sale
- American Fork-Pleasant Grove homes for sale
- Bluffdale homes for sale
- Cedar Hills homes for sale
- Cottonwood Heights homes for sale
- Granite homes for sale
- Herriman homes for sale
- Highland homes for sale
- Holladay homes for sale
- Lehi homes for sale
- Midvale homes for sale
- Murray homes for sale
- Pleasant Grove homes for sale
- Riverton homes for sale
- Sandy homes for sale
- Saratoga Springs homes for sale
- South Jordan homes for sale
- West Jordan homes for sale
- White City homes for sale
Protect your home and budget from life's surprises with an Assurant Home Warranty, backed by a partner that supports you through every step of homeownership. Explore Plans.
©2026 Century 21 Real Estate LLC. All rights reserved. CENTURY 21®, the CENTURY 21 Logo and C21® are service marks owned by Century 21 Real Estate LLC. Century 21 Real Estate LLC fully supports the principles of the Fair Housing Act and the Equal Opportunity Act. Each office is independently owned and operated. Listing information is deemed reliable but not guaranteed accurate.