- Cedar Heights, Colorado Springs homes for sale
- Forest Edge Park, Woodland Park homes for sale
- Kissing Camels, Colorado Springs homes for sale
- Kissing Camels Estates, Colorado Springs homes for sale
- Manitou Springs, Manitou Springs homes for sale
- Mt. Herman Estates, Monument homes for sale
- Mount Woodmen Estates, Colorado Springs homes for sale
- Mountain Shadows, Colorado Springs homes for sale
- Northwest Colorado Springs, Colorado Springs homes for sale
- Oak Valley, Colorado Springs homes for sale
- Oak Valley Ranch, Colorado Springs homes for sale
- Palmer Lake, Palmer Lake homes for sale
- Peregrine, Colorado Springs homes for sale
- Pinon Valley, Colorado Springs homes for sale
- Pleasant Valley, Colorado Springs homes for sale
- Red Rocks Ranch, Monument homes for sale
- Shining Mountain, Woodland Park homes for sale
- Upper Skyway, Colorado Springs homes for sale
- West Colorado Springs, Colorado Springs homes for sale
- Westmoor Park, Colorado Springs homes for sale
Florissant, CO - homes for sale
6 of 6 results displayed
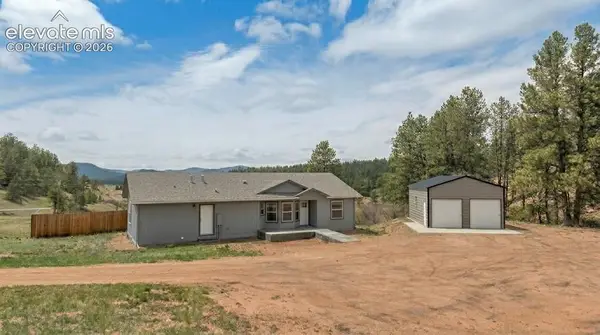 $499,000Active3 beds 2 baths1,595 sq. ft.
740 Crystal Peak Road, Florissant, CO 80816
MLS# 5173736Listed by: COLDWELL BANKER 1ST CHOICE REALTY
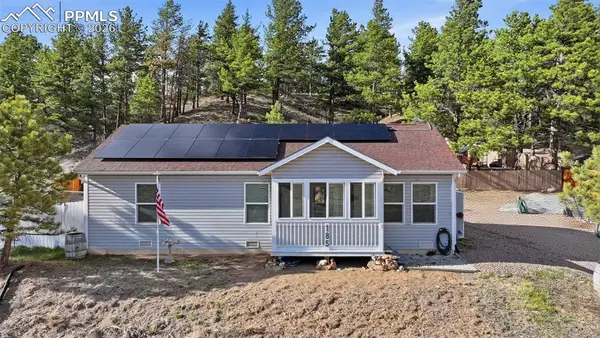 $385,000Active3 beds 2 baths1,056 sq. ft.
185 Circle Drive, Florissant, CO 80816
MLS# 8453765Listed by: RANGER REAL ESTATE LLC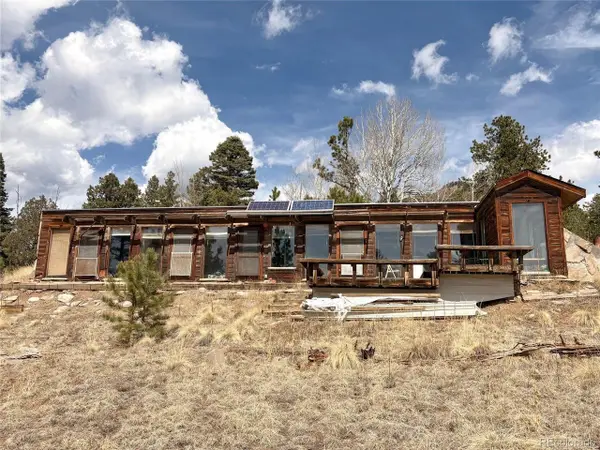 $450,000Active2 beds 1 baths1,026 sq. ft.
2121 Cr 1, Florissant, CO 80816
MLS# 9591491Listed by: MODUS Real Estate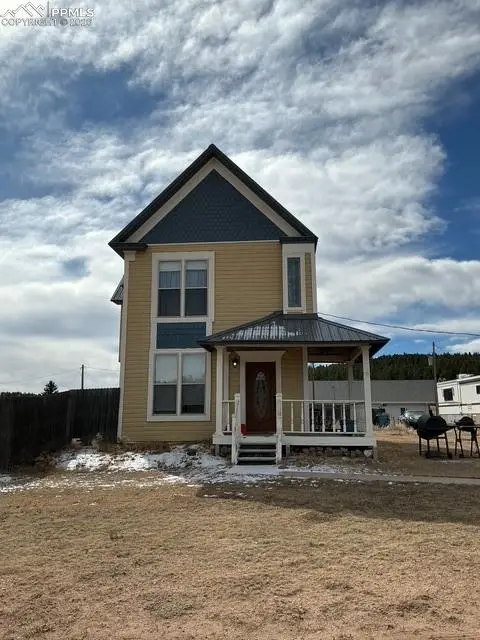 $350,000Pending2 beds 3 baths1,665 sq. ft.
102 2nd Street, Florissant, CO 80816
MLS# 9795606Listed by: HOMESMART $2,400,000Active6 beds 5 baths7,615 sq. ft.
4687 W Highway 24, Florissant, CO 80816
MLS# 3908371Listed by: WORTH CLARK REALTY $339,900Active3 beds 1 baths1,118 sq. ft.
281 Mesa Drive, Florissant, CO 80816
MLS# 6522610Listed by: PIKES PEAK DREAM HOMES REALTY
Local realty services provided by:CENTURY 21 Top Dog Properties, CENTURY 21 CapRock Real Estate
The information being provided by Pikes Peak REALTOR® Services Corp. is for the consumer's personal, non-commercial use and may not be used for any purpose other than to identify prospective properties consumer may be interested in purchasing. Any information relating to real estate for sale referenced on this web site comes from the Internet Data Exchange (IDX) program of the Pikes Peak REALTOR® Services Corp.. CENTURY 21 Top Dog Properties is not a Multiple Listing Service (MLS), nor does it offer MLS access. This website is a service of CENTURY 21 Top Dog Properties, a broker participant of Pikes Peak REALTOR® Services Corp.. This web site may reference real estate listing(s) held by a brokerage firm other than the broker and/or agent who owns this web site.
The accuracy of all information, regardless of source, including but not limited to open house information, square footages and lot sizes, is deemed reliable but not guaranteed and should be personally verified through personal inspection by and/or with the appropriate professionals. The data contained herein is copyrighted by Pikes Peak REALTOR® Services Corp. and is protected by all applicable copyright laws. Any unauthorized dissemination of this information is in violation of copyright laws and is strictly prohibited.
The real estate listing information and related content displayed on this site is provided exclusively for consumers' personal, non-commercial use and may not be used for any purpose other than to identify prospective properties consumers may be interested in purchasing. This information and related content is deemed reliable but is not guaranteed accurate by the Pikes Peak REALTOR® Services Corp.
Copyright 2026 Pikes Peak REALTOR® Services Corp. All rights reserved.
The real estate listing information and related content displayed on this site is provided exclusively for consumer's personal, non-commercial use and may not be used for any purpose other than to identify prospective properties consumers may be interested in purchasing. This information and related content is deemed reliable but is not guaranteed accurate by Information and Real Estate Services, LLC.
Information source: Information and Real Estate Services, LLC. Provided for limited non-commercial use only under IRES Rules © Copyright IRES. The information being provided by Information and Real Estate Services is for the consumer's personal, non-commercial use and may not be used for any purpose other than to identify prospective properties consumer may be interested in purchasing. Any information relating to real estate for sale referenced on this web site comes from the Internet Data Exchange (IDX) program of the Information and Real Estate Services. This web site may reference real estate listing(s) held by a brokerage firm other than the broker and/or agent who owns this web site.
The accuracy of all information, regardless of source, including but not limited to open house information, square footages and lot sizes, is deemed reliable but not guaranteed and should be personally verified through personal inspection by and/or with the appropriate professionals. The data contained herein is copyrighted by Information and Real Estate Services and is protected by all applicable copyright laws. Any unauthorized dissemination of this information is in violation of copyright laws and is strictly prohibited.
Neighborhoods near Florissant, CO
Zip codes near Florissant, CO
- 80118 homes for sale
- 80132 homes for sale
- 80133 homes for sale
- 80135 homes for sale
- 80809 homes for sale
- 80813 homes for sale
- 80814 homes for sale
- 80816 homes for sale
- 80819 homes for sale
- 80820 homes for sale
- 80827 homes for sale
- 80829 homes for sale
- 80860 homes for sale
- 80863 homes for sale
- 80904 homes for sale
- 80905 homes for sale
- 80906 homes for sale
- 80907 homes for sale
- 80919 homes for sale
- 80921 homes for sale
Popular searches near Florissant, CO
- Cascade homes for sale
- Cascade-Chipita Park homes for sale
- Colorado Springs homes for sale
- Cripple Creek homes for sale
- Divide homes for sale
- Gleneagle homes for sale
- Green Mountain Falls homes for sale
- Guffey homes for sale
- Lake George homes for sale
- Manitou Springs homes for sale
- Manitou Springs homes for sale
- Midland homes for sale
- Monument homes for sale
- Palmer Lake homes for sale
- Perry Park homes for sale
- Pikes Peak homes for sale
- Victor homes for sale
- Westcreek homes for sale
- Woodland Park homes for sale
- Woodmoor homes for sale
Protect your home and budget from life's surprises with an Assurant Home Warranty, backed by a partner that supports you through every step of homeownership. Explore Plans.
©2026 Century 21 Real Estate LLC. All rights reserved. CENTURY 21®, the CENTURY 21 Logo and C21® are service marks owned by Century 21 Real Estate LLC. Century 21 Real Estate LLC fully supports the principles of the Fair Housing Act and the Equal Opportunity Act. Each office is independently owned and operated. Listing information is deemed reliable but not guaranteed accurate.