- Arcadia Hills, Greenville homes for sale
- Bonnie Brae, Greenville homes for sale
- Brutontown, Greenville homes for sale
- Greater Sullivan, Greenville homes for sale
- Green Avenue, Greenville homes for sale
- Greenline, Greenville homes for sale
- Hartness, Greenville homes for sale
- Haynie, Greenville homes for sale
- Holly Tree, Simpsonville homes for sale
- Neely Farm, Simpsonville homes for sale
- Nicholtown, Greenville homes for sale
- Piedmont, Piedmont homes for sale
- Pleasant Valley, Greenville homes for sale
- Remington, Simpsonville homes for sale
- Riverplace, Greenville homes for sale
- Rolling Green Village, Greenville homes for sale
- Sans Souci, Greenville homes for sale
- Southernside, Greenville homes for sale
- Sterling, Greenville homes for sale
- West Greenville, Greenville homes for sale
Gantt, SC - homes for sale
69 of 69 results displayed
- New
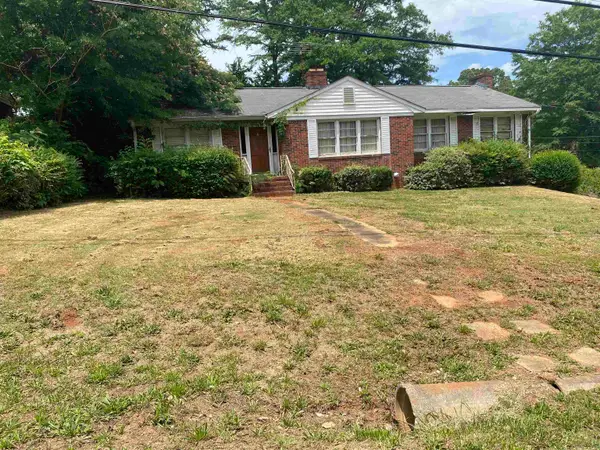 $200,000Active3 beds 3 baths1,836 sq. ft.
1 Cashmere Drive, Greenville, SC 29605
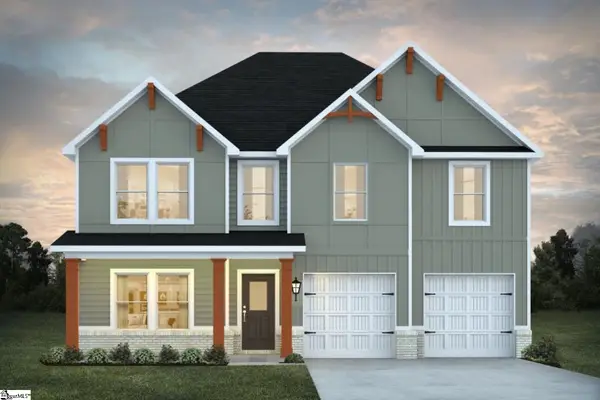
MLS# 338041Listed by: SOLID GROUND PROPERTIES 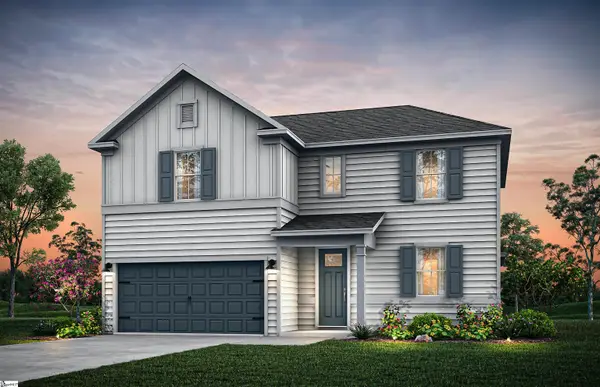 $457,880Pending4 beds 4 baths
102 Dansby Court #Lot 686, Greenville, SC 29605
MLS# 1594040Listed by: PULTE HOME COMPANY- New
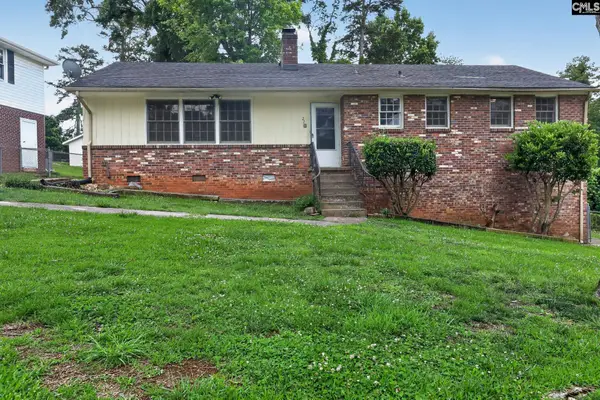 $219,900Active3 beds 2 baths2,675 sq. ft.
22 Westbrook Lane, Greenville, SC 29605
MLS# 635864Listed by: TRELORA REALTY INC - New
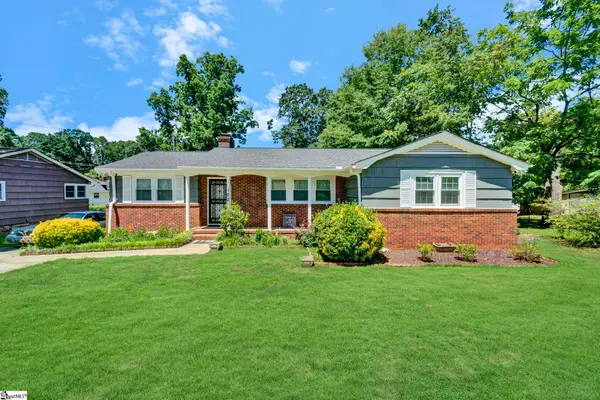 $299,900Active3 beds 2 baths
122 Marlboro Drive, Greenville, SC 29605-3426
MLS# 1593925Listed by: KELLER WILLIAMS DRIVE  $250,000Pending4 beds 3 baths
415 Artrage Court, Piedmont, SC 29673
MLS# 1592718Listed by: EXP REALTY LLC $499,900Active3 beds 3 baths
202 Kennedy Drive, Greenville, SC 29605
MLS# 1592581Listed by: RE/MAX EXECUTIVE $285,000Active3 beds 3 baths
52 Uneeda Drive, Greenville, SC 29605
MLS# 1592573Listed by: EXP REALTY LLC $280,000Active3 beds 2 baths
17 Crestwood Pines Trail, Piedmont, SC 29673
MLS# 1592353Listed by: KELLER WILLIAMS GRV UPST $255,000Active2 beds 1 baths
20 Milton Drive, Greenville, SC 29605
MLS# 1592266Listed by: EXPERT REAL ESTATE TEAM $1,400,496Pending4 beds 4 baths
105 Hidden Hills Drive, Greenville, SC 29605
MLS# 1592260Listed by: COLDWELL BANKER CAINE/WILLIAMS $1,995,000Pending4 beds 4 baths
14 Chanticleer Drive, Greenville, SC 29605
MLS# 1591943Listed by: COLDWELL BANKER CAINE/WILLIAMS $1,595,000Active4 beds 5 baths
8 De Braham Court, Greenville, SC 29605
MLS# 1591846Listed by: WILSON ASSOCIATES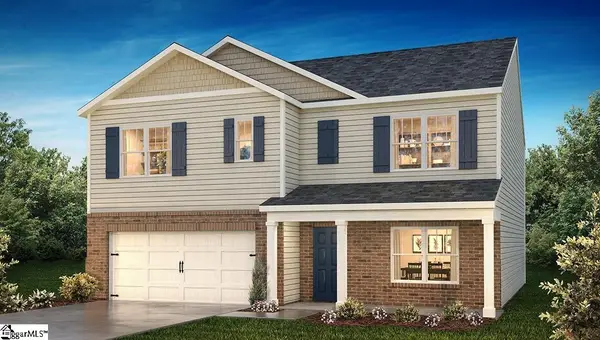 $358,900Active5 beds 3 baths
1610 Castlen Court, Piedmont, SC 29673
MLS# 1591792Listed by: D.R. HORTON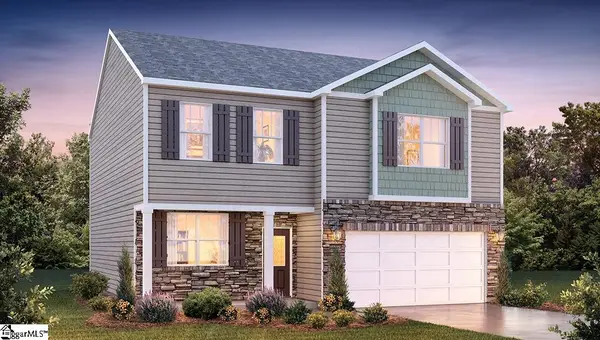 $339,900Active3 beds 3 baths
1612 Castlen Court, Piedmont, SC 29673
MLS# 1591795Listed by: D.R. HORTON $291,900Active4 beds 3 baths
520 Mills Hill Way, Greenville, SC 29605
MLS# 1591781Listed by: BHHS C DAN JOYNER - MIDTOWN $317,499Active4 beds 3 baths
208 Harvest Hill Lane, Greenville, SC 29605
MLS# 1591667Listed by: BRACKEN REAL ESTATE $373,900Active5 beds 4 baths
1611 Castlen Court, Piedmont, SC 29673
MLS# 1591693Listed by: D.R. HORTON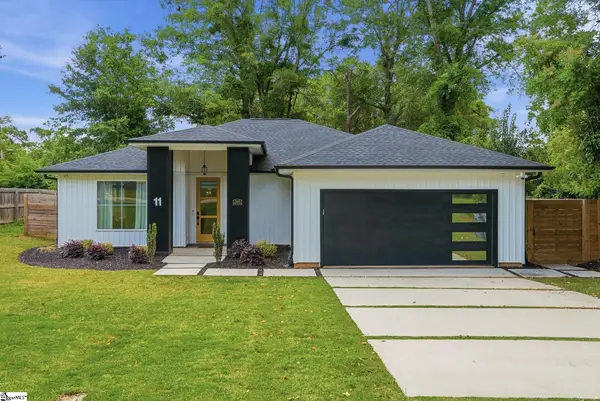 $489,000Active3 beds 2 baths
11 Milton Drive, Greenville, SC 29605
MLS# 1591622Listed by: XSELL UPSTATE $367,900Active5 beds 3 baths2,674 sq. ft.
113 Blooming Meadow Road, Piedmont, SC 29673
MLS# 337044Listed by: MTH SC REALTY, LLC $304,900Pending3 beds 2 baths1,648 sq. ft.
109 Blooming Meadow Road, Piedmont, SC 29673
MLS# 337045Listed by: MTH SC REALTY, LLC $504,900Active3 beds 3 baths
124 Cashmere Drive, Greenville, SC 29605
MLS# 1591022Listed by: RE/MAX REACH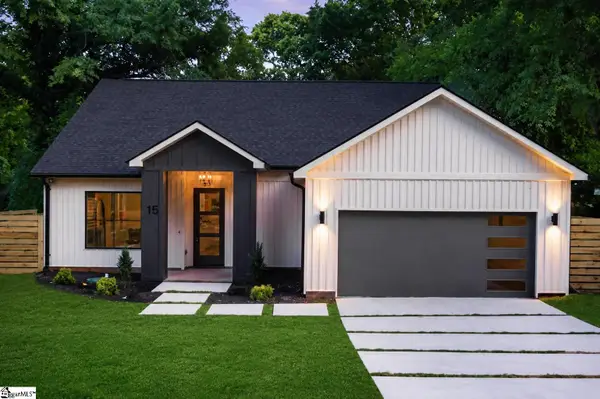 $525,000Active3 beds 2 baths
15 Milton Drive, Greenville, SC 29605
MLS# 1590982Listed by: BHHS C DAN JOYNER - AUGUSTA RD $420,000Pending3 beds 2 baths
134 Cashmere Drive, Greenville, SC 29605
MLS# 1590887Listed by: BHHS C DAN JOYNER - MIDTOWN $449,000Active5 beds 3 baths
119 Freestone Street, Greenville, SC 29605
MLS# 1590795Listed by: LISTWITHFREEDOM.COM $239,900Active3 beds 2 baths1,354 sq. ft.
615 Pine Creek Drive, Greenville, SC 29605
MLS# 633381Listed by: TRELORA REALTY INC- Open Sat, 12 to 4pm
 $417,920Pending3 beds 3 baths
302 Snow Quilt Court #Lot 678, Greenville, SC 29605
MLS# 1588474Listed by: PULTE HOME COMPANY  $335,000Active3 beds 3 baths
45 Ridgeway Drive, Greenville, SC 29605
MLS# 1590463Listed by: SERVUS REALTY GROUP- Open Wed, 10am to 6pm
 $338,390Active5 beds 3 baths
613 Silver Fir Street, Piedmont, SC 29673
MLS# 1590371Listed by: DFH REALTY GEORGIA, LLC  $338,890Active5 beds 3 baths
619 Silver Fir Street, Piedmont, SC 29673
MLS# 1590244Listed by: DFH REALTY GEORGIA, LLC $250,000Pending3 beds 3 baths
508 Mills Hill Way, Greenville, SC 29605
MLS# 1589969Listed by: RE/MAX EXECUTIVE $378,290Pending5 beds 3 baths
739 Meadowpark Drive, Greenville, SC 29605
MLS# 1589674Listed by: D.R. HORTON $375,000Pending5 beds 3 baths
121 Silicon Drive, Greenville, SC 29605
MLS# 1588728Listed by: NEST REALTY $2,995,605Active4 beds 7 baths
309 Hidden Hills Drive, Greenville, SC 29605
MLS# 1588112Listed by: HERLONG SOTHEBY'S INTERNATIONAL REALTY $349,900Active4 beds 2 baths
341 Cypress Hollow Trail, Piedmont, SC 29673
MLS# 1587349Listed by: KELLER WILLIAMS GREENVILLE CENTRAL $1,399,000Pending4 beds 4 baths
30 Porcher Circle, Greenville, SC 29605
MLS# 1587282Listed by: REEDY PROPERTY GROUP, LLC - RESIDENTIAL $279,900Active3 beds 2 baths1,440 sq. ft.
121 Davis Grove Ln, Piedmont, SC 29673
MLS# 335501Listed by: CEF AND CO $269,900Active3 beds 3 baths
501 Mills Hill Way, Greenville, SC 29605-2513
MLS# 1587099Listed by: BHHS C DAN JOYNER - MIDTOWN $189,900Pending3 beds 2 baths1,325 sq. ft.
6 June Lane, Greenville, SC 29605
MLS# 630728Listed by: TRELORA REALTY INC
 $309,900Active4 beds 3 baths1,900 sq. ft.
11 Davis Grove Lane, Piedmont, SC 29673
MLS# 335385Listed by: CENTURY 21 BLACKWELL & CO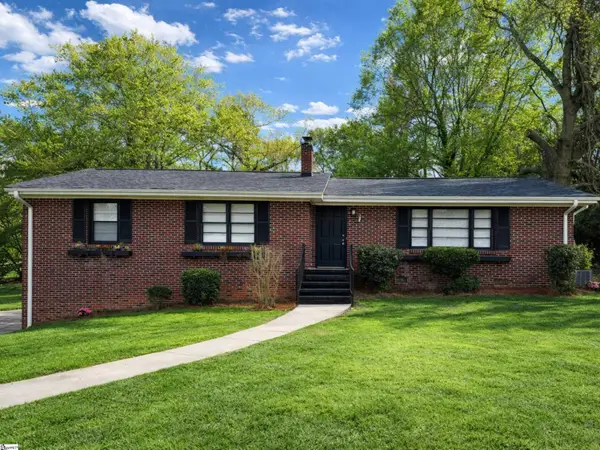 $344,950Active4 beds 2 baths
49 Foxhall Road, Greenville, SC 29605
MLS# 1586787Listed by: THE PROPERTY LOUNGE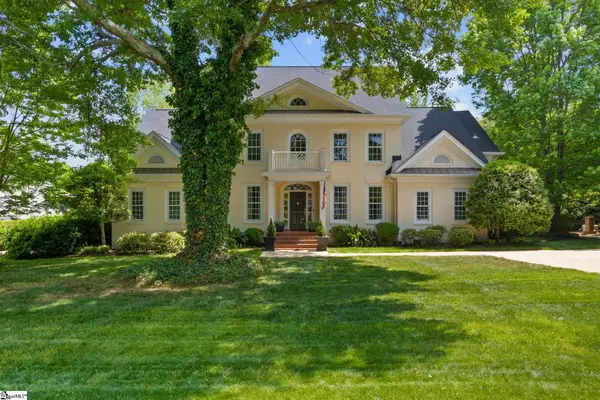 $2,125,605Active4 beds 4 baths
416 Hidden Hills Drive, Greenville, SC 29605
MLS# 1586067Listed by: HERLONG SOTHEBY'S INTERNATIONAL REALTY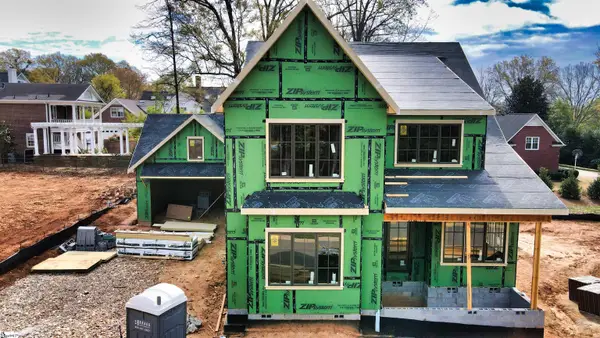 $1,455,000Pending4 beds 4 baths
38 Porcher Circle, Greenville, SC 29605
MLS# 1585878Listed by: REEDY PROPERTY GROUP, LLC - RESIDENTIAL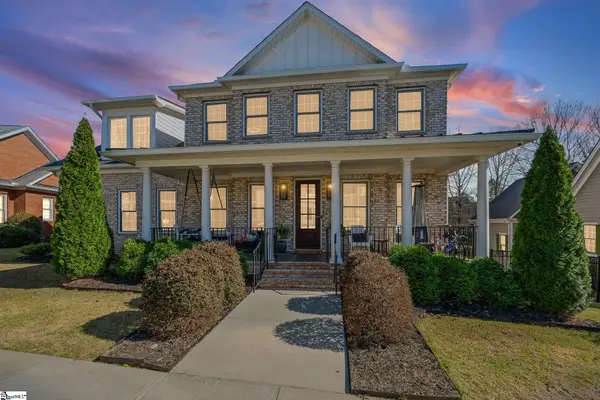 $1,375,000Active5 beds 5 baths
615 Berkmans Lane, Greenville, SC 29605
MLS# 1585107Listed by: CAROLINA MOVES, LLC $355,000Active4 beds 2 baths
3 Bracken Woods Way, Piedmont, SC 29673
MLS# 1584793Listed by: KELLER WILLIAMS GREENVILLE CENTRAL $205,000Active3 beds 2 baths
632 Old Augusta Road, Greenville, SC 29605
MLS# 1584124Listed by: KELLER WILLIAMS DRIVE $210,000Pending3 beds 2 baths
102 Pinefield Drive, Greenville, SC 29605
MLS# 1583634Listed by: KELLER WILLIAMS GREENVILLE CENTRAL $310,040Active3 beds 2 baths
614 Silver Fir Street, Piedmont, SC 29673
MLS# 1583172Listed by: DFH REALTY GEORGIA, LLC $388,929Active3 beds 2 baths
593 Camden Drive, Piedmont, SC 29673
MLS# 1582674Listed by: JUBILEE REALTY, LLC $435,787Active3 beds 2 baths
597 Camden Drive, Piedmont, SC 29673
MLS# 1582671Listed by: JUBILEE REALTY, LLC $259,900Pending3 beds 2 baths
303 Willimon Drive, Piedmont, SC 29673
MLS# 1582637Listed by: REALTY ONE GROUP FREEDOM $325,000Pending3 beds 2 baths
220 E Belvedere Road, Greenville, SC 29605
MLS# 1581950Listed by: THE PROPERTY BAR, LLC $314,900Active4 beds 3 baths
216 Wintersweet Way, Greenville, SC 29605
MLS# 1581893Listed by: KELLER WILLIAMS DRIVE $299,999Pending3 beds 2 baths1,600 sq. ft.
1 Pine Creek Court, Greenville, SC 29605
MLS# 333272Listed by: WONDRACEK REALTY GROUP, LLC $289,900Active3 beds 2 baths
201 Stratford Road, Greenville, SC 29605
MLS# 1578326Listed by: XSELL UPSTATE $3,390,605Active5 beds 4 baths
504 Hidden Hills Drive, Greenville, SC 29605
MLS# 1577735Listed by: HERLONG SOTHEBY'S INTERNATIONAL REALTY $435,000Active4 beds 3 baths
10 Valley View Lane, Greenville, SC 29605
MLS# 1577454Listed by: CAROLINA MOVES, LLC $273,000Active3 beds 2 baths
17 Rosemond Drive, Greenville, SC 29605
MLS# 1576772Listed by: AGAPE REAL ESTATE SOLUTIONS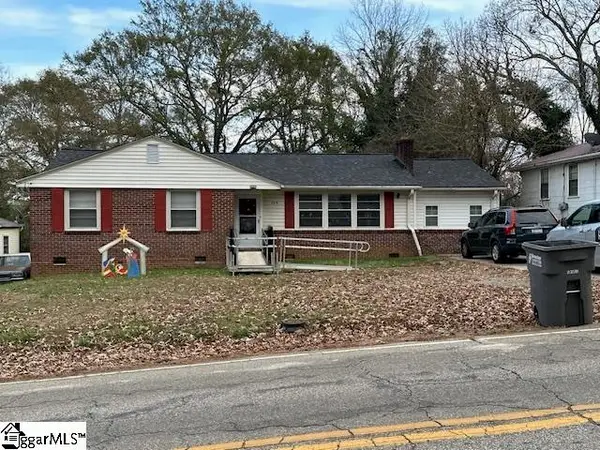 $273,000Active4 beds 3 baths
509 Crestfield Road, Greenville, SC 29605
MLS# 1576697Listed by: AGAPE REAL ESTATE SOLUTIONS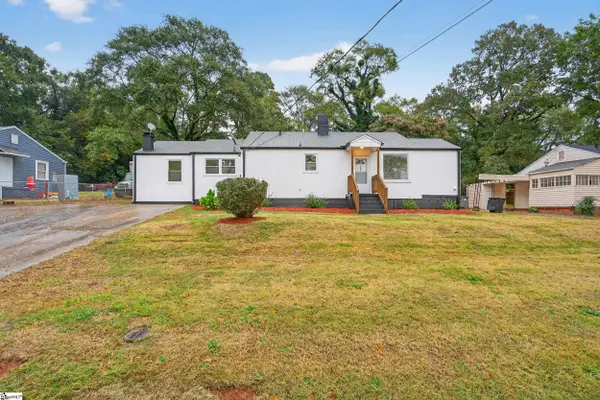 $230,000Active3 beds 2 baths
105 S Estate Drive, Greenville, SC 29605
MLS# 1573555Listed by: REAL BROKER, LLC- Open Wed, 10am to 6pm
 $339,790Active5 beds 3 baths
609 Silver Fir Street, Piedmont, SC 29673
MLS# 1573371Listed by: DFH REALTY GEORGIA, LLC  $270,000Active3 beds 2 baths
202 W Dorchester Boulevard, Greenville, SC 29605
MLS# 1570890Listed by: REDCLIFFE REALTY, LLC $309,000Active3 beds 2 baths
6520 Augusta Road, Greenville, SC 29605
MLS# 1570408Listed by: COLDWELL BANKER CAINE/WILLIAMS $235,000Active4 beds 2 baths
4 Arturo Road, Piedmont, SC 29673
MLS# 1570265Listed by: CASEY GROUP REAL ESTATE, LLC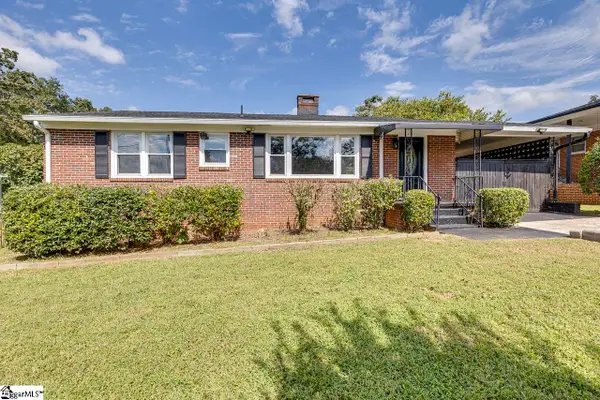 $279,900Active3 beds 2 baths
24 Maudie Street, Greenville, SC 29605
MLS# 1568196Listed by: NORTH GROUP REAL ESTATE $274,000Active3 beds 2 baths
226 Kahlen Court, Piedmont, SC 29673
MLS# 1567759Listed by: KELLER WILLIAMS UPSTATE LEGACY- Open Wed, 10am to 6pm
 $349,715Active5 beds 3 baths
621 Silver Fir Street, Piedmont, SC 29673
MLS# 1563126Listed by: DFH REALTY GEORGIA, LLC  $347,170Active5 beds 3 baths
615 Silver Fir Street, Piedmont, SC 29673
MLS# 1563127Listed by: DFH REALTY GEORGIA, LLC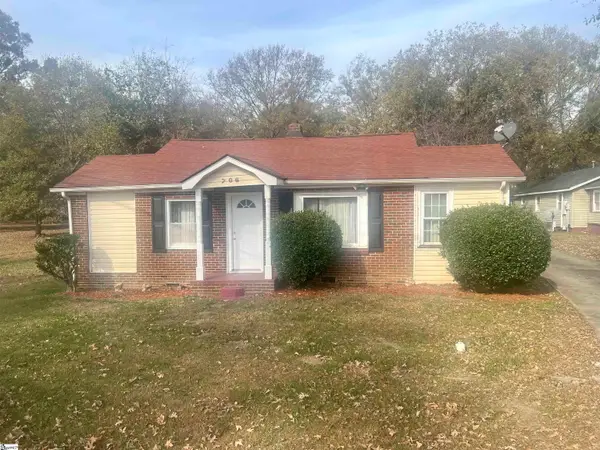 $189,990Pending3 beds 2 baths
706 White Horse Road, Greenville, SC 29605
MLS# 1552739Listed by: JOY REAL ESTATE $388,000Active3 beds 2 baths
105 Monteith Circle, Greenville, SC 29605
MLS# 1517926Listed by: EXP REALTY LLC
Local realty services provided by:CENTURY 21 The Harrelson Group, CENTURY 21 Triangle Group, CENTURY 21 803
Last Updated: June 6, 2026 The data relating to real estate on this Web site derive in part from the Carolina Multiple Listing Services, Inc. IDX program. Brokers make an effort to deliver accurate information, but buyers should independently verify any information on which they will rely in a transaction. All properties are subject to prior sale, change or withdrawal. Neither CENTURY 21 803nor any listing broker shall be responsible for any typographical errors, misinformation, or misprints, and they shall be held totally harmless from any damages arising from reliance upon this data. This data is provided exclusively for consumers' personal, non-commercial use and may not be used for any purpose other than to identify prospective properties they may be interested in purchasing. Copyright 2026 Carolina Multiple Listing Services, Inc.
Neighborhoods near Gantt, SC
Zip codes near Gantt, SC
- 29601 homes for sale
- 29605 homes for sale
- 29607 homes for sale
- 29609 homes for sale
- 29611 homes for sale
- 29615 homes for sale
- 29617 homes for sale
- 29640 homes for sale
- 29642 homes for sale
- 29644 homes for sale
- 29650 homes for sale
- 29651 homes for sale
- 29657 homes for sale
- 29662 homes for sale
- 29669 homes for sale
- 29673 homes for sale
- 29680 homes for sale
- 29681 homes for sale
- 29687 homes for sale
- 29697 homes for sale
Popular searches near Gantt, SC
- Berea homes for sale
- City View homes for sale
- Conestee homes for sale
- Dunean homes for sale
- Five Forks homes for sale
- Golden Grove homes for sale
- Greenville homes for sale
- Judson homes for sale
- Mauldin homes for sale
- Parker homes for sale
- Pelzer homes for sale
- Piedmont homes for sale
- Piedmont homes for sale
- Powdersville homes for sale
- Powdersville-Piedmont homes for sale
- Sans Souci homes for sale
- Simpsonville homes for sale
- Wade Hampton homes for sale
- Welcome homes for sale
- West Pelzer homes for sale
Protect your home and budget from life's surprises with an Assurant Home Warranty, backed by a partner that supports you through every step of homeownership. Explore Plans.
©2026 Century 21 Real Estate LLC. All rights reserved. CENTURY 21®, the CENTURY 21 Logo and C21® are service marks owned by Century 21 Real Estate LLC. Century 21 Real Estate LLC fully supports the principles of the Fair Housing Act and the Equal Opportunity Act. Each office is independently owned and operated. Listing information is deemed reliable but not guaranteed accurate.