- Aldan, Clifton Heights homes for sale
- Ardmore, Ardmore homes for sale
- Bryn Mawr, Bryn Mawr homes for sale
- Carroll Park, Philadelphia homes for sale
- Cathedral Park, Philadelphia homes for sale
- Clifton Heights, Clifton Heights homes for sale
- Cobbs Creek, Philadelphia homes for sale
- Collingdale, Darby homes for sale
- Darby, Darby homes for sale
- East Lansdowne, East Lansdowne homes for sale
- Haddington, Philadelphia homes for sale
- Haverford, Haverford homes for sale
- Merion Station, Merion Station homes for sale
- Narberth, Narberth homes for sale
- Overbrook, Philadelphia homes for sale
- Penn Wynne, Wynnewood homes for sale
- West Philadelphia, Philadelphia homes for sale
- Wynnefield, Philadelphia homes for sale
- Wynnewood, Wynnewood homes for sale
- Yeadon, Lansdowne homes for sale
Havertown, PA - homes for sale
15 of 15 results displayed
- New
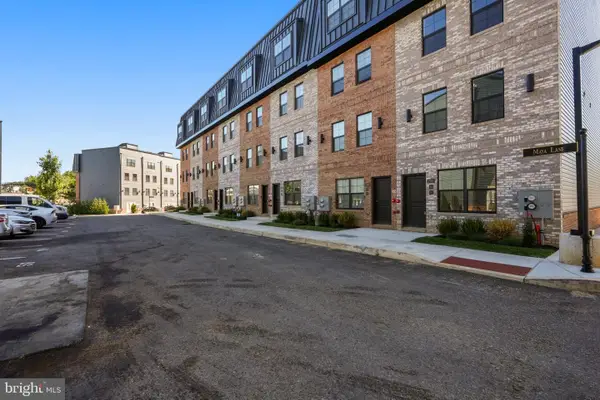 $329,999Active2 beds 2 baths1,300 sq. ft.
4013 Marilyn Dr #a95, PHILADELPHIA, PA 19131
MLS# PAPH2631012Listed by: SPACE & COMPANY - New
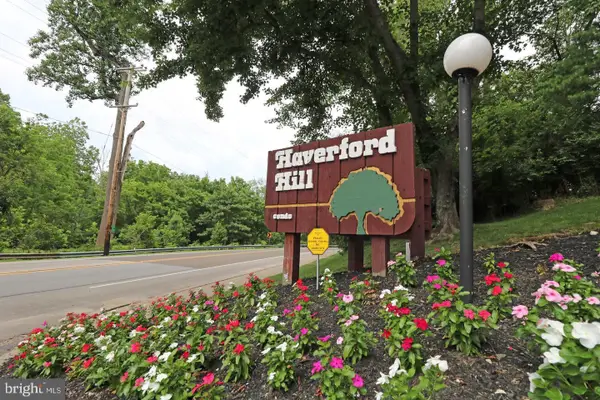
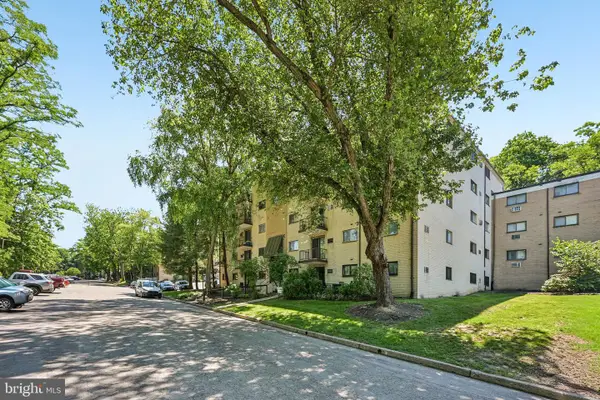 $179,000Active2 beds 2 baths1,288 sq. ft.
400 Glendale Rd #c31, HAVERTOWN, PA 19083
MLS# PADE2116678Listed by: REDFIN CORPORATION - Coming Soon
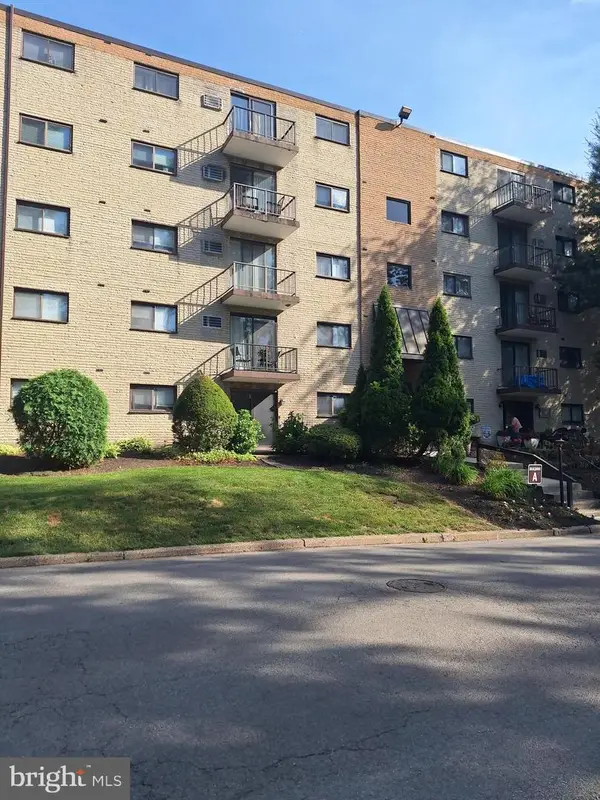 $190,000Coming Soon2 beds 2 baths
400 Glendale Rd #34, HAVERTOWN, PA 19083
MLS# PADE2116852Listed by: KACZOR REAL ESTATE, INC. - New
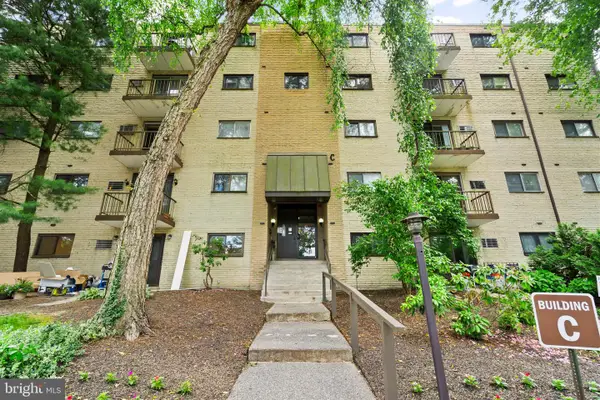 $199,999Active2 beds 2 baths1,104 sq. ft.
400 Glendale Rd #35c, HAVERTOWN, PA 19083
MLS# PADE2116186Listed by: KW EMPOWER 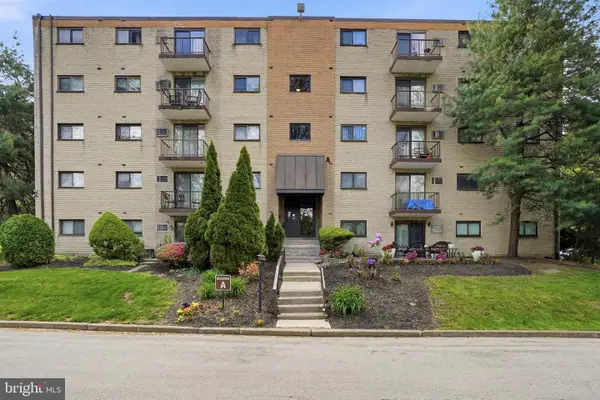 $154,900Pending1 beds 1 baths772 sq. ft.
400 Glendale Rd #a22, HAVERTOWN, PA 19083
MLS# PADE2115410Listed by: COMPASS PENNSYLVANIA, LLC- Coming Soon
 $214,900Coming Soon2 beds 2 baths
400 Glendale Rd #f13, HAVERTOWN, PA 19083
MLS# PADE2115598Listed by: KELLER WILLIAMS REAL ESTATE - MEDIA 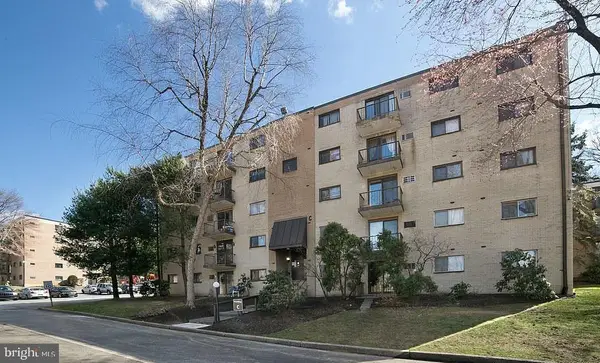 $165,000Active1 beds 1 baths772 sq. ft.
400 Glendale Rd #32c, HAVERTOWN, PA 19083
MLS# PADE2115050Listed by: COMPASS PENNSYLVANIA, LLC $175,000Pending2 beds 2 baths1,104 sq. ft.
400 Glendale Rd #g-45, HAVERTOWN, PA 19083
MLS# PADE2115038Listed by: KELLER WILLIAMS REAL ESTATE - WEST CHESTER $339,999Pending2 beds 2 baths1,300 sq. ft.
4019 Marilyn Dr #a90, PHILADELPHIA, PA 19131
MLS# PAPH2610944Listed by: KW EMPOWER- Open Sun, 10:30am to 3pm
 $299,999Active2 beds 2 baths1,100 sq. ft.
4015 Marilyn Dr #a93, PHILADELPHIA, PA 19131
MLS# PAPH2610970Listed by: KW EMPOWER - Open Sun, 10:30am to 3pm
 $299,999Active2 beds 2 baths1,100 sq. ft.
4013 Marilyn Dr #a95, PHILADELPHIA, PA 19131
MLS# PAPH2610986Listed by: KW EMPOWER  $223,000Pending2 beds 2 baths1,104 sq. ft.
400 Glendale Rd #e34, HAVERTOWN, PA 19083
MLS# PADE2110362Listed by: KELLER WILLIAMS REAL ESTATE - MEDIA $319,999Pending2 beds 2 baths1,100 sq. ft.
4019 Marilyn Dr #a89, PHILADELPHIA, PA 19131
MLS# PAPH2601478Listed by: KW EMPOWER $339,999Pending2 beds 2 baths1,300 sq. ft.
4017 Marilyn Dr #a92, PHILADELPHIA, PA 19131
MLS# PAPH2598362Listed by: KW EMPOWER $215,000Pending2 beds 2 baths1,104 sq. ft.
400 Glendale Rd #a54, HAVERTOWN, PA 19083
MLS# PADE2110528Listed by: KELLER WILLIAMS MAIN LINE
Local realty services provided by:CENTURY 21 Reilly Realtors
Neighborhoods near Havertown, PA
Zip codes near Havertown, PA
- 19003 homes for sale
- 19008 homes for sale
- 19010 homes for sale
- 19018 homes for sale
- 19023 homes for sale
- 19026 homes for sale
- 19036 homes for sale
- 19041 homes for sale
- 19050 homes for sale
- 19064 homes for sale
- 19066 homes for sale
- 19070 homes for sale
- 19072 homes for sale
- 19082 homes for sale
- 19083 homes for sale
- 19085 homes for sale
- 19096 homes for sale
- 19131 homes for sale
- 19139 homes for sale
- 19151 homes for sale
Popular searches near Havertown, PA
- Aldan homes for sale
- Ardmore homes for sale
- Broomall homes for sale
- Bryn Mawr homes for sale
- Bryn Mawr homes for sale
- Clifton Heights homes for sale
- Drexel Hill homes for sale
- East Lansdowne homes for sale
- Haverford homes for sale
- Lansdowne homes for sale
- Lower Merion Township homes for sale
- Marple Township homes for sale
- Merion Station homes for sale
- Narberth homes for sale
- Penn Valley homes for sale
- Penn Wynne homes for sale
- Rosemont homes for sale
- Springfield homes for sale
- Upper Darby homes for sale
- Wynnewood homes for sale
Protect your home and budget from life's surprises with an Assurant Home Warranty, backed by a partner that supports you through every step of homeownership. Explore Plans.
©2026 Century 21 Real Estate LLC. All rights reserved. CENTURY 21®, the CENTURY 21 Logo and C21® are service marks owned by Century 21 Real Estate LLC. Century 21 Real Estate LLC fully supports the principles of the Fair Housing Act and the Equal Opportunity Act. Each office is independently owned and operated. Listing information is deemed reliable but not guaranteed accurate.