- Angeles Acres, Hesperia homes for sale
- Brentwood, Victorville homes for sale
- Cedarpines Park, Cedarpines Park homes for sale
- Country Club Manor, Apple Valley homes for sale
- Crestline, Crestline homes for sale
- Desert Knolls Estates, Apple Valley homes for sale
- Devore Heights, San Bernardino homes for sale
- Eagle Ranch, Victorville homes for sale
- Foxfire Ranch, Victorville homes for sale
- Green Tree, Victorville homes for sale
- Hesperia Palisades, Hesperia homes for sale
- Kiowa Park, Apple Valley homes for sale
- Lake Arrowhead, Lake Arrowhead homes for sale
- Lucky Star Ranchos, Hesperia homes for sale
- Mariposa Lodge, Apple Valley homes for sale
- Mission Crest, Hesperia homes for sale
- Spring Valley Lake, Victorville homes for sale
- Sun City Apple Valley, Apple Valley homes for sale
- Verdemont, San Bernardino homes for sale
- Victor Village, Victorville homes for sale
Hesperia, CA - homes for sale
300 of 383 results displayed
- New
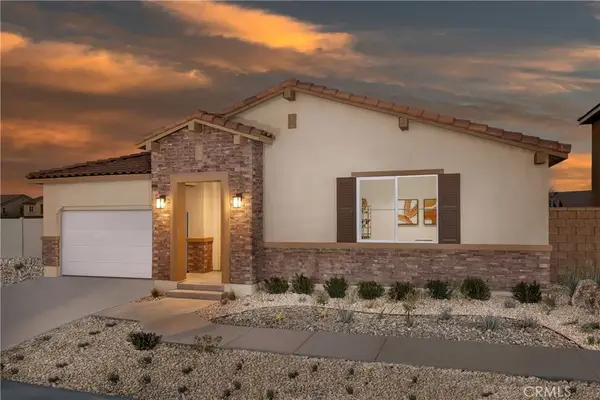
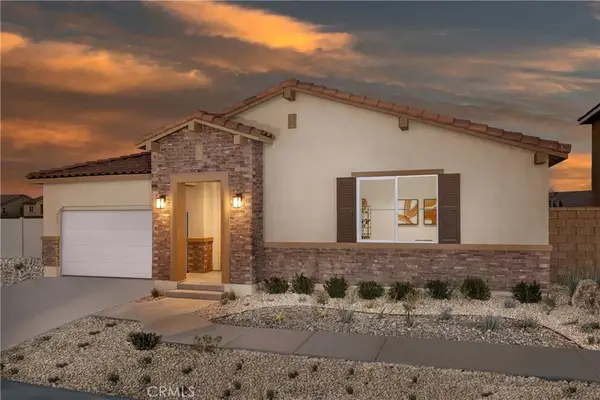
 $399,800Active3 beds 2 baths1,475 sq. ft.
10007 Victor, Hesperia, CA 92345
MLS# IV26084640Listed by: COLDWELL BANKER NEW CENTURY - New
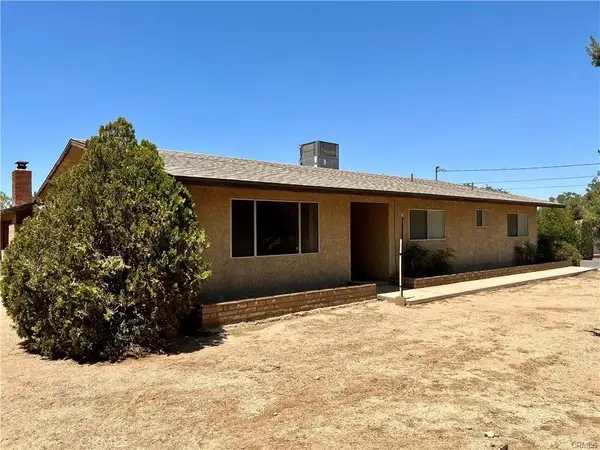
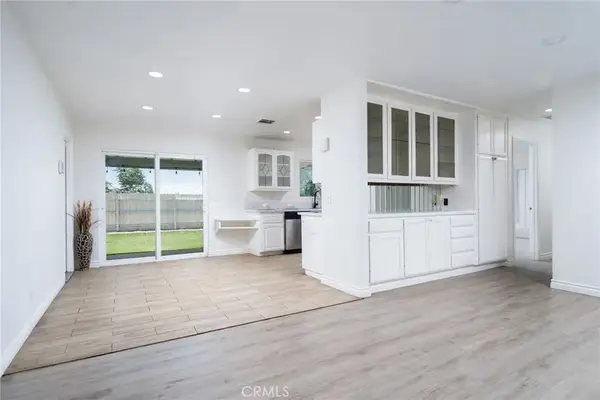
 $470,000Active3 beds 2 baths1,617 sq. ft.
18393 Mojave, Hesperia, CA 92345
MLS# IG26123533Listed by: J&C REAL ESTATE - New
 $425,000Active3 beds 2 baths1,233 sq. ft.
9354 Hickory Avenue, Hesperia, CA 92345
MLS# OC26122653Listed by: FIRST TEAM REAL ESTATE - New

 $549,999Active4 beds 3 baths2,260 sq. ft.
15921 Pine Street, Hesperia, CA 92345
MLS# CV26123440Listed by: CENTURY 21 SYNERGIA REALTY - New
 $399,900Active3 beds 2 baths1,242 sq. ft.
11890 Jacaranda, Hesperia, CA 92345
MLS# CV26123441Listed by: CHAMPIONS REAL ESTATE - New
 $499,900Active4 beds 2 baths2,793 sq. ft.
8309 Langdon, Hesperia, CA 92345
MLS# CV26123421Listed by: FIRST TEAM REAL ESTATE - New
 $499,900Active4 beds 2 baths2,009 sq. ft.
15129 Cedar Street, Hesperia, CA 92345
MLS# HD26123078Listed by: REALTY ONE GROUP EMPIRE - New
 $339,999Active3 beds 2 baths1,657 sq. ft.
18215 Carob, Hesperia, CA 92345
MLS# CV26122680Listed by: RE/MAX TIME REALTY - New
 $365,000Active2 beds 1 baths952 sq. ft.
11581 4th Avenue, Hesperia, CA 92345
MLS# CV26122707Listed by: ACEVEDO REAL ESTATE PROFESSIONALS - Coming Soon
 $450,000Coming Soon3 beds 2 baths
16011 Smoke Tree, Hesperia, CA 92345
MLS# HD26122843Listed by: KELLER WILLIAMS VICTOR VALLEY - New
 $349,950Active2 beds 1 baths1,334 sq. ft.
9268 9th, Hesperia, CA 92345
MLS# CV26121867Listed by: GUSHUE REAL ESTATE - New
 $399,000Active3 beds 3 baths1,731 sq. ft.
16709 Deodar, Hesperia, CA 92345
MLS# IV26121639Listed by: COUNTRY REALTY - Coming Soon
 $510,000Coming Soon3 beds 2 baths
13097 Saratoga, Hesperia, CA 92344
MLS# PW26122599Listed by: FIRST TEAM REAL ESTATE - New
 $659,000Active4 beds 3 baths2,768 sq. ft.
16810 Danbury, Hesperia, CA 92345
MLS# HD26121596Listed by: Z REALTY - New
 $355,000Active3 beds 2 baths2,367 sq. ft.
8511 C Avenue, Hesperia, CA 92345
MLS# CV26121726Listed by: THE R.R. NETWORK - New
 $1,700,000Active4 beds 4 baths3,904 sq. ft.
7560 Royal View, Oak Hills, CA 92344
MLS# IV26121518Listed by: VISMAR REAL ESTATE - New
 $385,000Active3 beds 2 baths1,190 sq. ft.
7623 Oxford, Hesperia, CA 92345
MLS# IV26121462Listed by: PACIFIC BAY ESTATES  $250,000Pending3 beds 2 baths1,207 sq. ft.
7776 Hemlock, Hesperia, CA 92345
MLS# CV26118349Listed by: CENTURY 21 PRIMETIME REALTORS $425,000Pending3 beds 2 baths1,304 sq. ft.
10373 Kern Avenue, Hesperia, CA 92345
MLS# HD26120540Listed by: COLDWELL BANKER ENVISION- New
 $509,000Active4 beds 3 baths2,320 sq. ft.
13816 Grant Way, Oak Hills, CA 92344
MLS# CV26111921Listed by: FIRST TEAM REAL ESTATE - New
 $634,900Active4 beds 3 baths2,225 sq. ft.
15162 Larch, Hesperia, CA 92345
MLS# IV26119970Listed by: WESTCOE REALTORS INC - New
 $520,000Active3 beds 2 baths1,780 sq. ft.
8755 Lassen Ave, Hesperia, CA 92345
MLS# IV26120433Listed by: FIRST TEAM REAL ESTATE - New
 $556,500Active4 beds 3 baths2,144 sq. ft.
10695 5th Avenue, Hesperia, CA 92345
MLS# IV26119787Listed by: REALHOME SERVICES & SOLUTIONS - New
 $599,000Active4 beds 3 baths2,448 sq. ft.
14587 Mulberry Street, Hesperia, CA 92345
MLS# HD26119344Listed by: RE/MAX FREEDOM - Coming SoonOpen Sat, 11am to 3pm
 $409,999Coming Soon3 beds 2 baths
18047 Yucca St, Hesperia, CA 92345
MLS# IG26118777Listed by: PONCE & PONCE REALTY, INC - Coming Soon$580,000Coming Soon4 beds 3 baths
8660 Chester, Hesperia, CA 92344
MLS# CV26119362Listed by: BLISSS LIFE ENTERPRISES - Open Sat, 10am to 5pmNew
 $574,990Active4 beds 3 baths2,700 sq. ft.
9056 Carson Avenue, Hesperia, CA 92344
MLS# SR26118725Listed by: PACIFIC COMMUNITIES BUILDER INC. - New
 $539,990Active4 beds 2 baths2,239 sq. ft.
9089 Carson Avenue, Hesperia, CA 92344
MLS# SR26118731Listed by: PACIFIC COMMUNITIES BUILDER INC. - New
 $579,990Active4 beds 3 baths2,700 sq. ft.
9067 Carson Avenue, Hesperia, CA 92344
MLS# SR26118741Listed by: PACIFIC COMMUNITIES BUILDER INC. - New
 $580,990Active4 beds 3 baths2,700 sq. ft.
9028 Carson Avenue, Hesperia, CA 92344
MLS# SR26118746Listed by: PACIFIC COMMUNITIES BUILDER INC. - New
 $529,000Active3 beds 2 baths1,951 sq. ft.
17760 Manzanita Street, Hesperia, CA 92345
MLS# HD26118407Listed by: EXP REALTY OF SOUTHERN CA INC. - New
 $515,000Active3 beds 3 baths2,120 sq. ft.
8978 7th, Hesperia, CA 92345
MLS# CV26117685Listed by: DUILIO MULLER, BROKER - New
 $418,000Active2 beds 1 baths988 sq. ft.
11945 Bornite Avenue, Hesperia, CA 92345
MLS# IV26114958Listed by: REALTY MASTERS & ASSOCIATES - New
 $530,000Active4 beds 3 baths3,050 sq. ft.
18621 Centennial Street, Hesperia, CA 92345
MLS# IV26103936Listed by: RE/MAX TIME REALTY  $239,000Pending2 beds 2 baths900 sq. ft.
14772 Cashew Street, Hesperia, CA 92345
MLS# PTP2604133Listed by: JL LENZ REAL ESTATE- New
 $449,000Active4 beds 2 baths1,474 sq. ft.
16725 Mission Street, Hesperia, CA 92345
MLS# HD26117021Listed by: COLDWELL BANKER HOME SOURCE  $239,000Pending2 beds 2 baths900 sq. ft.
14772 Cashew Street, Hesperia, CA 92345
MLS# PTP2604133Listed by: JL LENZ REAL ESTATE- New
 $418,000Active2 beds 1 baths988 sq. ft.
11945 Bornite Avenue, Hesperia, CA 92345
MLS# IV26114958Listed by: REALTY MASTERS & ASSOCIATES - New
 $559,000Active4 beds 3 baths1,817 sq. ft.
11442 Primrose, Hesperia, CA 92345
MLS# HD26115547Listed by: REALTY ONE GROUP EMPIRE - Coming Soon
 $575,000Coming Soon3 beds 3 baths
18641 Niles, Hesperia, CA 92345
MLS# CV26114508Listed by: THE AGENCY - New
 $409,000Active3 beds 2 baths1,588 sq. ft.
9205 9th, Hesperia, CA 92345
MLS# OC26113287Listed by: EXP REALTY OF SOUTHERN CALIFORNIA, INC - New
 $389,000Active4 beds 2 baths1,757 sq. ft.
9302 Jacaranda, Hesperia, CA 92345
MLS# DW26115591Listed by: CENTURY 21 LOTUS  $439,999Active3 beds 2 baths1,650 sq. ft.
17918 Catalpa Street, Hesperia, CA 92345
MLS# SW26113467Listed by: EXP REALTY OF CALIFORNIA, INC. $1,430,000Active3 beds 3 baths4,196 sq. ft.
18550 Eucalyptus, Hesperia, CA 92345
MLS# IG26113012Listed by: CALIFORNIA EMPIRE REAL ESTATE $449,999Active4 beds 3 baths1,996 sq. ft.
7596 Arcadia Avenue, Hesperia, CA 92345
MLS# SW26109341Listed by: EXP REALTY OF CALIFORNIA, INC.- Coming Soon
 $455,000Coming Soon4 beds 3 baths
13247 San Dimas, Hesperia, CA 92344
MLS# HD26110043Listed by: REALTY ONE GROUP EMPIRE  $449,999Active4 beds 3 baths1,996 sq. ft.
7596 Arcadia Avenue, Hesperia, CA 92345
MLS# SW26109341Listed by: EXP REALTY OF CALIFORNIA, INC. $405,000Active3 beds 2 baths1,352 sq. ft.
14383 Birchwood Drive, Hesperia, CA 92344
MLS# HD26112725Listed by: 1ST CLASS REALESTATE MAVERICKS $399,900Pending3 beds 2 baths1,368 sq. ft.
7335 Dayton Avenue, Hesperia, CA 92345
MLS# HD26112098Listed by: KELLER WILLIAMS HIGH DESERT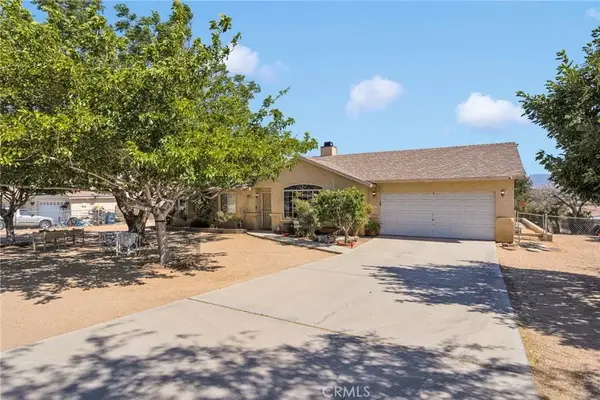 $415,000Active3 beds 2 baths1,368 sq. ft.
19147 Yucca Street, Hesperia, CA 92345
MLS# HD26111731Listed by: GIVE2GIVE REALTY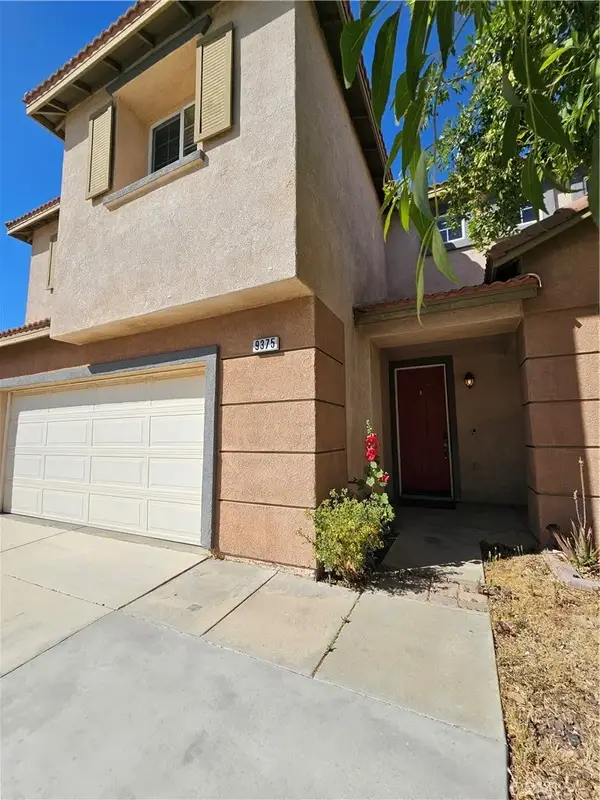 $510,000Active4 beds 3 baths2,977 sq. ft.
9375 Agave Drive, Hesperia, CA 92344
MLS# CV26111893Listed by: TOP PRODUCERS REALTY PARTNERS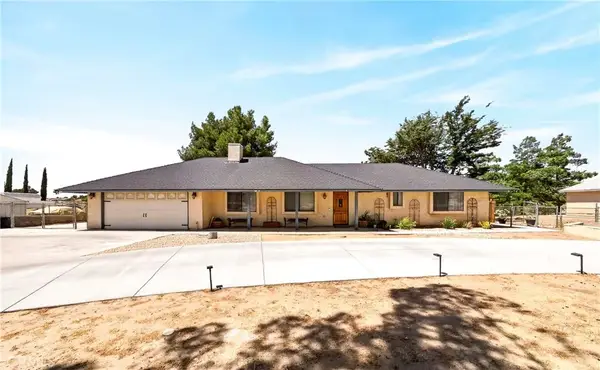 $434,900Active3 beds 2 baths1,320 sq. ft.
17930 Seaforth Street, Hesperia, CA 92345
MLS# CV26108621Listed by: ELEVATE REAL ESTATE AGENCY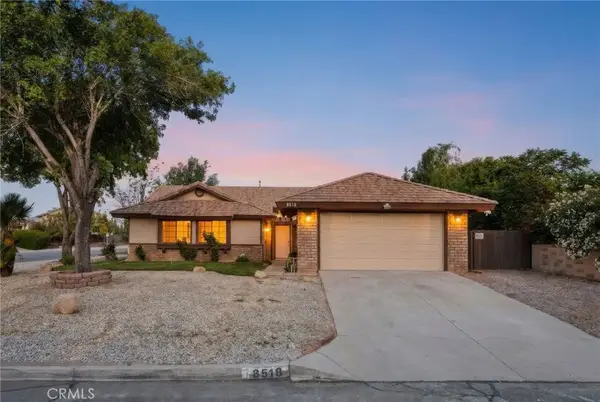 $460,000Active4 beds 2 baths1,821 sq. ft.
8518 Valley View, Hesperia, CA 92344
MLS# IV26111167Listed by: SIMPLE REAL ESTATE GROUP $439,950Pending3 beds 2 baths1,533 sq. ft.
7625 Windsor Avenue, Hesperia, CA 92345
MLS# HD26059766Listed by: REAL BROKERAGE TECHNOLOGIES $508,794Pending5 beds 3 baths2,691 sq. ft.
17605 Bassets Street, Hesperia, CA 92345
MLS# SW26111579Listed by: CENTURY 21 MASTERS- Coming Soon
 $810,000Coming Soon4 beds 3 baths
12771 Cedar, Hesperia, CA 92344
MLS# HD26111198Listed by: CENTURY 21 LEADERS REAL ESTATE  $399,000Active3 beds 2 baths1,032 sq. ft.
9670 Timberlane Avenue, Hesperia, CA 92345
MLS# IV26110671Listed by: KELLER WILLIAMS REALTY $789,000Active4 beds 4 baths2,763 sq. ft.
17840 Talisman Street, Hesperia, CA 92345
MLS# CV26110830Listed by: EXP REALTY OF SOUTHERN CALIFORNIA INC $465,000Pending3 beds 2 baths1,694 sq. ft.
17831 Pitache Street, Hesperia, CA 92345
MLS# HD26110710Listed by: MGR REAL ESTATE, INC $399,900Active3 beds 2 baths1,292 sq. ft.
17846 Orange, Hesperia, CA 92345
MLS# CV26110233Listed by: RE/MAX TIME REALTY $419,999Active3 beds 2 baths1,222 sq. ft.
18298 Danbury, Hesperia, CA 92345
MLS# IG26110099Listed by: KELLER WILLIAMS REALTY $510,000Pending4 beds 2 baths1,935 sq. ft.
8055 Newhall, Hesperia, CA 92345
MLS# CV26109908Listed by: ACEVEDO REAL ESTATE PROFESSIONALS $375,000Active2 beds 2 baths972 sq. ft.
16124 Mesa, Hesperia, CA 92345
MLS# DW26109029Listed by: EXCELLENCE RE REAL ESTATE, INC. $629,900Pending4 beds 3 baths2,111 sq. ft.
10361 Choiceana Avenue, Hesperia, CA 92345
MLS# HD26109400Listed by: REALTY ONE GROUP EMPIRE $499,000Active3 beds 2 baths1,376 sq. ft.
11906 Apatite Avenue, Hesperia, CA 92345
MLS# IV26108717Listed by: FIVE RIVERS REAL ESTATE INC. $850,000Active3 beds 4 baths1,992 sq. ft.
7008 Summit Valley, Hesperia, CA 92345
MLS# IV26108456Listed by: KELLER WILLIAMS RIVERSIDE CENT $589,000Active4 beds 2 baths1,576 sq. ft.
14780 Olive, Hesperia, CA 92345
MLS# IV26107638Listed by: NEST REAL ESTATE $489,000Active4 beds 3 baths2,538 sq. ft.
9329 Sable Ridge, Hesperia, CA 92345
MLS# PW26107314Listed by: BEST TEAM REAL ESTATE GROUP $555,000Active4 beds 3 baths2,628 sq. ft.
7592 Victor Ave, Hesperia, CA 92345
MLS# OC26107273Listed by: BULLOCK RUSSELL RE SERVICES $555,000Active4 beds 3 baths2,628 sq. ft.
7592 Victor Ave, Hesperia, CA 92345
MLS# OC26107273Listed by: BULLOCK RUSSELL RE SERVICES $488,000Active3 beds 2 baths1,428 sq. ft.
15185 Orange, Hesperia, CA 92345
MLS# HD26103905Listed by: EXP REALTY OF SOUTHERN CA INC. $450,000Active4 beds 2 baths1,830 sq. ft.
18376 Main, Hesperia, CA 92345
MLS# OC26106776Listed by: FRONTIER REALTY INC $688,000Active4 beds 2 baths2,414 sq. ft.
8026 Primrose Avenue, Oak Hills, CA 92344
MLS# HD26102872Listed by: EXCELLENCE RE REAL ESTATE $599,000Active6 beds 4 baths2,040 sq. ft.
6791 Redwood Avenue, Hesperia, CA 92345
MLS# HD26102694Listed by: GIVE2GIVE REALTY $465,000Pending3 beds 2 baths1,848 sq. ft.
13150 La Jolla, Hesperia, CA 92344
MLS# HD26105644Listed by: REALTY ONE GROUP EMPIRE $470,000Active3 beds 2 baths1,580 sq. ft.
11441 Hemlock, Hesperia, CA 92345
MLS# HD26105892Listed by: EXP REALTY OF SOUTHERN CA INC. $350,000Pending3 beds 3 baths2,229 sq. ft.
11744 Cottonwood, Hesperia, CA 92345
MLS# HD26105629Listed by: EXP REALTY OF SOUTHERN CA INC. $579,990Active4 beds 3 baths2,198 sq. ft.
18332 Catalpa, Hesperia, CA 92345
MLS# OC26098679Listed by: HOM REALTY GROUP, INC. $445,550Active3 beds 2 baths1,350 sq. ft.
8216 Buckthorn, Hesperia, CA 92345
MLS# IV26105506Listed by: PAK HOME REALTY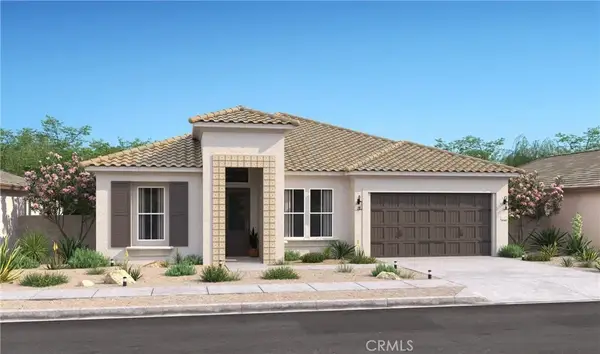 $668,990Active4 beds 4 baths2,747 sq. ft.
7191 Doheny Court, Hesperia, CA 92345
MLS# SW26105621Listed by: K. HOVNANIAN COMPANIES OF CA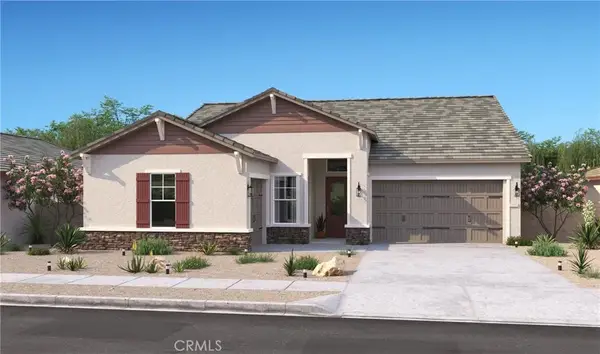 $648,990Active4 beds 3 baths2,406 sq. ft.
17714 Doheny Court, Hesperia, CA 92345
MLS# SW26105698Listed by: K. HOVNANIAN COMPANIES OF CA $410,000Active3 beds 2 baths1,232 sq. ft.
16150 Smoke Tree, Hesperia, CA 92345
MLS# CV26094987Listed by: HOMEQUEST REAL ESTATE $408,000Active4 beds 2 baths1,823 sq. ft.
18845 Madrone, Hesperia, CA 92345
MLS# CV26105100Listed by: FIRST TEAM REAL ESTATE $449,999Active4 beds 2 baths1,248 sq. ft.
9030 Roble, Hesperia, CA 92345
MLS# CV26104534Listed by: CALIFORNIA PRIME REAL ESTATE $409,900Active4 beds 2 baths1,466 sq. ft.
16491 Live Oak, Hesperia, CA 92345
MLS# IG26104290Listed by: EXP REALTY OF SOUTHERN CALIFORNIA- $567,990Active4 beds 3 baths2,650 sq. ft.
8834 Waltham, Hesperia, CA 92344
MLS# IG26104377Listed by: RICHMOND AMERICAN HOMES  $499,000Pending4 beds 3 baths2,092 sq. ft.
7454 Lyons Avenue, Hesperia, CA 92345
MLS# HD26104511Listed by: RE/MAX FREEDOM $535,000Active4 beds 3 baths2,888 sq. ft.
18346 Main, Hesperia, CA 92345
MLS# HD26103918Listed by: PERFORMANCE REALTY- Open Sat, 1 to 5pm
 $1,698,800Active4 beds 4 baths3,100 sq. ft.
18383 Tecate Street, Chino Hills, CA 91709
MLS# WS26101647Listed by: INFINITE SUN REALTY  $550,000Active3 beds 3 baths1,853 sq. ft.
17695 Linden St, Hesperia, CA 92345
MLS# DW26103799Listed by: EXCELLENCE PREMIER REAL ESTATE $515,000Pending4 beds 2 baths2,062 sq. ft.
15184 Walnut, Hesperia, CA 92345
MLS# HD26102473Listed by: REALTY ONE GROUP EMPIRE $499,000Active4 beds 2 baths1,857 sq. ft.
18936 Rocksprings, Hesperia, CA 92345
MLS# IV26102591Listed by: REALTY MASTERS & ASSOCIATES $499,999Active5 beds 3 baths2,602 sq. ft.
13532 Sage, Hesperia, CA 92344
MLS# SW26102793Listed by: EXIT ALLIANCE REALTY $530,000Active4 beds 3 baths2,711 sq. ft.
17788 Buckthorn, Hesperia, CA 92345
MLS# CV26101750Listed by: CENTURY 21 PRIMETIME REALTORS $599,999Active4 beds 3 baths2,950 sq. ft.
12987 Johannesburg, Hesperia, CA 92344
MLS# CV26094202Listed by: FATHOM REALTY GROUP INC $449,990Active3 beds 2 baths1,439 sq. ft.
11694 Pepper, Hesperia, CA 92345
MLS# SR26100969Listed by: BROADNAX PROPERTIES, INC. $599,999Active4 beds 3 baths2,950 sq. ft.
12987 Johannesburg, Hesperia, CA 92344
MLS# CV26094202Listed by: FATHOM REALTY GROUP INC $360,000Active3 beds 2 baths1,071 sq. ft.
18464 Vine Street, Hesperia, CA 92345
MLS# DW26099857Listed by: CENTURY 21 ALLSTARS $539,000Active4 beds 2 baths2,091 sq. ft.
8169 Lassen Avenue, Hesperia, CA 92345
MLS# HD26098377Listed by: VOLSCH ENTERPRISES, INC. $649,900Active4 beds 3 baths2,413 sq. ft.
11174 8th Avenue, Hesperia, CA 92345
MLS# HD26100258Listed by: ALAM REALTY $471,310Pending3 beds 2 baths1,494 sq. ft.
14382 Pepperdine Street, Hesperia, CA 92345
MLS# SW26100417Listed by: CENTURY 21 MASTERS $488,600Active4 beds 2 baths1,692 sq. ft.
7503 Pitzer Avenue, Hesperia, CA 92345
MLS# SW26100423Listed by: CENTURY 21 MASTERS $448,246Pending3 beds 2 baths1,404 sq. ft.
14381 Pepperdine Street, Hesperia, CA 92345
MLS# SW26100427Listed by: CENTURY 21 MASTERS $424,900Active3 beds 2 baths1,380 sq. ft.
16219 Manzanita, Hesperia, CA 92345
MLS# CV26099320Listed by: COLDWELL BANKER ICON $479,900Active4 beds 2 baths1,624 sq. ft.
15884 El Centro Road, Hesperia, CA 92345
MLS# CV26096518Listed by: NEXTHOME LIBERTY $476,239Active4 beds 3 baths2,099 sq. ft.
17913 Hawes Court, Hesperia, CA 92345
MLS# SW26099382Listed by: CENTURY 21 MASTERS $434,595Pending3 beds 2 baths1,700 sq. ft.
17924 Hawes Court, Hesperia, CA 92345
MLS# SW26099389Listed by: CENTURY 21 MASTERS $446,672Pending3 beds 2 baths1,539 sq. ft.
17882 Hawes Court, Hesperia, CA 92345
MLS# SW26099398Listed by: CENTURY 21 MASTERS $429,900Active4 beds 2 baths2,364 sq. ft.
8683 Bridgeport, Hesperia, CA 92344
MLS# CV26098750Listed by: COLDWELL BANKER ICON $434,900Active2 beds 2 baths1,196 sq. ft.
9327 9th, Hesperia, CA 92345
MLS# PW26098434Listed by: SEVENTY SEVEN MANAGEMENT GROUP $450,000Active3 beds 2 baths1,899 sq. ft.
7861 Madera Avenue, Hesperia, CA 92345
MLS# CV26098147Listed by: CENTURY 21 MASTERS $399,000Active3 beds 1 baths1,155 sq. ft.
15561 Ash Street, Hesperia, CA 92345
MLS# 26830303Listed by: VISTA SOTHEBY'S INTERNATIONAL REALTY $499,000Active3 beds 3 baths2,255 sq. ft.
10249 Jennifer, Hesperia, CA 92345
MLS# PW26106221Listed by: REDPOINT REALTY $499,999Pending3 beds 2 baths1,446 sq. ft.
9070 6th, Hesperia, CA 92345
MLS# HD26098177Listed by: CROWN REALTY SERVICES $375,000Pending3 beds 2 baths1,500 sq. ft.
11363 I, Hesperia, CA 92345
MLS# HD26094932Listed by: OASIS REALTY GROUP $725,000Active4 beds 3 baths2,622 sq. ft.
15045 Olive St, Hesperia, CA 92345
MLS# HD26097598Listed by: CENTURY 21 LEADERS REAL ESTATE $498,000Active4 beds 3 baths2,278 sq. ft.
13912 Pinellia, Hesperia, CA 92344
MLS# HD26096844Listed by: EXP REALTY OF SOUTHERN CA INC. $699,000Pending4 beds 3 baths2,400 sq. ft.
7737 3rd, Hesperia, CA 92345
MLS# OC26096358Listed by: RE/MAX TERRASOL $499,000Active5 beds 3 baths2,174 sq. ft.
8541 Dove Creek, Hesperia, CA 92344
MLS# CV26096238Listed by: LUIS SANCHEZ, BROKER $775,000Pending4 beds 3 baths3,132 sq. ft.
14201 Rodeo Road, Hesperia, CA 92344
MLS# HD26094753Listed by: EXP REALTY OF SOUTHERN CA INC. $492,500Active4 beds 3 baths2,815 sq. ft.
14373 Silent Spring, Hesperia, CA 92344
MLS# HD26095484Listed by: RE/MAX FREEDOM $410,000Active2 beds 1 baths1,039 sq. ft.
11968 Bornite, Hesperia, CA 92345
MLS# IV26095407Listed by: EXCELLENCE RE REAL ESTATE INC $410,000Active2 beds 1 baths1,039 sq. ft.
11968 Bornite, Hesperia, CA 92345
MLS# IV26095407Listed by: EXCELLENCE RE REAL ESTATE INC $474,900Active4 beds 3 baths2,050 sq. ft.
10156 Marissa Court, Hesperia, CA 92345
MLS# IV26095338Listed by: REALTY MASTERS & ASSOCIATES $460,000Pending4 beds 3 baths2,223 sq. ft.
18126 Fairburn, Hesperia, CA 92345
MLS# HD26093020Listed by: REALTY ONE GROUP EMPIRE $409,999Pending3 beds 2 baths1,623 sq. ft.
18419 Seaforth Street, Hesperia, CA 92345
MLS# CV26094366Listed by: SMART SELL REAL ESTATE $364,500Pending2 beds 1 baths852 sq. ft.
14665 Ranchero, Hesperia, CA 92345
MLS# PW26093392Listed by: NORTH HILLS REALTY- Open Sun, 11am to 4pm
 $649,990Pending4 beds 4 baths2,747 sq. ft.
17736 Palomar Court, Hesperia, CA 92345
MLS# SW26093691Listed by: K. HOVNANIAN COMPANIES OF CA  $550,000Active3 beds 2 baths2,042 sq. ft.
8305 Topaz, Hesperia, CA 92344
MLS# CV26092680Listed by: CROWN ROYAL REAL ESTATE, INC. $559,000Pending3 beds 2 baths2,048 sq. ft.
18669 Ranchero, Hesperia, CA 92345
MLS# HD26093180Listed by: EXP REALTY OF SOUTHERN CA INC. $510,000Active4 beds 3 baths1,780 sq. ft.
11837 11th, Hesperia, CA 92345
MLS# HD26091541Listed by: REAL BROKERAGE TECHNOLOGIES $624,900Active3 beds 2 baths2,149 sq. ft.
7144 Farmdale Avenue, Hesperia, CA 92345
MLS# IG26092204Listed by: ADAM CASTANEDA, BROKER $665,000Active4 beds 3 baths2,809 sq. ft.
17590 El Cajon Drive, Hesperia, CA 92345
MLS# 26791333Listed by: EXP REALTY OF CALIFORNIA INC $510,000Active4 beds 3 baths1,780 sq. ft.
11837 11th, Hesperia, CA 92345
MLS# HD26091541Listed by: REAL BROKERAGE TECHNOLOGIES $469,900Active3 beds 2 baths1,686 sq. ft.
8932 Hickory, Hesperia, CA 92345
MLS# CV26078128Listed by: DYNASTY REAL ESTATE $469,900Active3 beds 2 baths1,686 sq. ft.
8932 Hickory, Hesperia, CA 92345
MLS# CV26078128Listed by: DYNASTY REAL ESTATE $439,000Active4 beds 2 baths1,760 sq. ft.
18431 Westlawn, Hesperia, CA 92345
MLS# DW26090769Listed by: BETTER HOMES AND GARDENS RE $409,000Active3 beds 2 baths1,308 sq. ft.
18563 Yucca Street, Hesperia, CA 92345
MLS# HD26090682Listed by: CENTURY 21 MASTERS $449,950Active4 beds 2 baths1,896 sq. ft.
10065 Pyrite Avenue, Hesperia, CA 92345
MLS# P1-26727Listed by: AVIDA & ASSOCIATES $439,000Pending4 beds 2 baths1,501 sq. ft.
9327 Agave Drive, Hesperia, CA 92344
MLS# HD26090100Listed by: COLDWELL BANKER HOME SOURCE $475,000Active4 beds 2 baths1,850 sq. ft.
7602 Newhall Avenue, Hesperia, CA 92345
MLS# IV26089798Listed by: KELLER WILLIAMS REALTY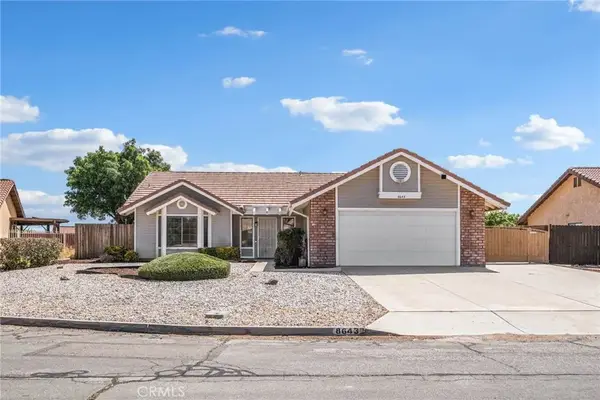 $422,000Pending3 beds 2 baths1,720 sq. ft.
8643 Panorama, Hesperia, CA 92344
MLS# CV26071880Listed by: KELLER WILLIAMS REALTY COLLEGE PARK $394,000Active3 beds 2 baths1,358 sq. ft.
9965 8th, Hesperia, CA 92345
MLS# HD26089447Listed by: RIVAS REALTY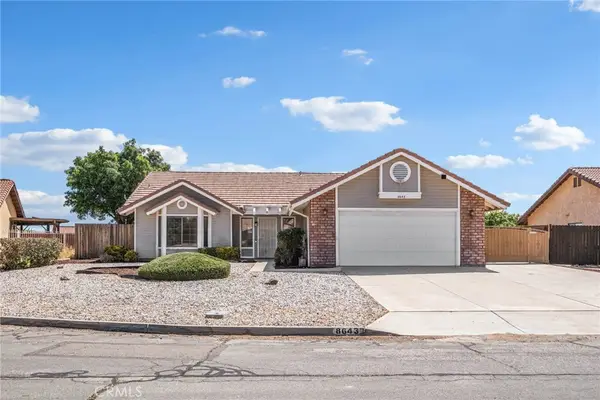 $422,000Pending3 beds 2 baths1,720 sq. ft.
8643 Panorama, Hesperia, CA 92344
MLS# CV26071880Listed by: KELLER WILLIAMS REALTY COLLEGE PARK $399,987Active3 beds 2 baths1,377 sq. ft.
10278 Balsam Avenue, Hesperia, CA 92345
MLS# OC26087562Listed by: DALTON REAL ESTATE $395,000Pending3 beds 2 baths1,352 sq. ft.
9979 5th Avenue, Hesperia, CA 92345
MLS# CV26088830Listed by: CHAMPIONS REAL ESTATE $489,999Pending4 beds 3 baths2,486 sq. ft.
8991 Guadalupe, Oak Hills, CA 92344
MLS# DW26088013Listed by: THE REAL ESTATE SOLUTION $469,950Pending3 beds 2 baths1,340 sq. ft.
8351 Lassen Avenue, Hesperia, CA 92345
MLS# HD26087260Listed by: FIRST TEAM REAL ESTATE-HIGHDES $479,900Active4 beds 2 baths2,364 sq. ft.
13364 Pleasant View, Hesperia, CA 92344
MLS# HD26087892Listed by: REALTY ONE GROUP EMPIRE $459,000Pending3 beds 2 baths1,480 sq. ft.
7982 Cottonwood, Hesperia, CA 92345
MLS# CV26084276Listed by: VISMAR REAL ESTATE $485,000Active3 beds 2 baths1,836 sq. ft.
7337 Jenkins Avenue, Hesperia, CA 92345
MLS# HD26081972Listed by: COLDWELL BANKER HOME SOURCE $549,999Active3 beds 2 baths2,192 sq. ft.
18312 Talisman, Hesperia, CA 92345
MLS# DW26087648Listed by: BIG BLOCK POWERHOUSE REALTY $519,000Active4 beds 3 baths2,724 sq. ft.
14637 Sequoia, Hesperia, CA 92345
MLS# HD26087587Listed by: RICHARD BOUNCE, BROKER $492,500Active3 beds 2 baths1,645 sq. ft.
6736 Summit Valley, Hesperia, CA 92345
MLS# HD26087128Listed by: IH REAL ESTATE, INC $510,000Pending3 beds 2 baths2,349 sq. ft.
18236 Cherry Street, Hesperia, CA 92345
MLS# HD26087390Listed by: KELLER WILLIAMS HIGH DESERT $500,000Active3 beds 2 baths1,712 sq. ft.
14980 Larch Street, Hesperia, CA 92345
MLS# DW26086833Listed by: EHOMES $399,990Active3 beds 2 baths1,161 sq. ft.
8441 Dove Creek, Hesperia, CA 92344
MLS# CV26084205Listed by: NEXTHOME LIBERTY $487,000Active4 beds 3 baths2,836 sq. ft.
9053 Calico Court, Oak Hills, CA 92344
MLS# HD26086151Listed by: PROVEST REALTY INC. $434,000Pending3 beds 3 baths1,597 sq. ft.
7064 11th Avenue, Hesperia, CA 92345
MLS# HD26078657Listed by: COLDWELL BANKER ENVISION $689,900Active4 beds 3 baths2,100 sq. ft.
18702 Atlantic Street, Hesperia, CA 92345
MLS# IV26085565Listed by: KELLER WILLIAMS EMPIRE ESTATES $597,500Pending4 beds 3 baths2,111 sq. ft.
18090 Hinton Street, Hesperia, CA 92345
MLS# HD26084697Listed by: REALTY ONE GROUP EMPIRE $449,950Active4 beds 2 baths1,896 sq. ft.
10065 Pyrite Avenue, Hesperia, CA 92345
MLS# P1-26727Listed by: AVIDA & ASSOCIATES $559,000Active3 beds 3 baths2,117 sq. ft.
18595 Verano, Hesperia, CA 92345
MLS# HD26083033Listed by: RE/MAX FREEDOM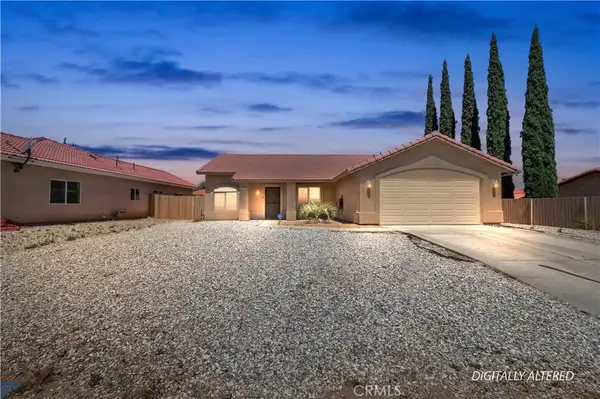 $415,000Active3 beds 2 baths1,678 sq. ft.
10312 Primrose, Hesperia, CA 92345
MLS# IV26083789Listed by: TOWER AGENCY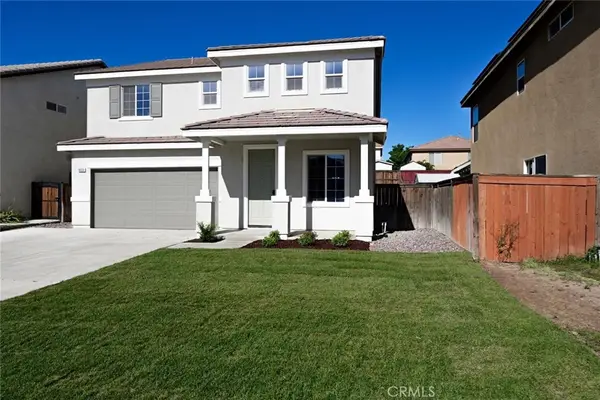 $499,000Pending5 beds 3 baths2,602 sq. ft.
9454 Apricot Court, Hesperia, CA 92345
MLS# HD26083020Listed by: VOLSCH ENTERPRISES, INC.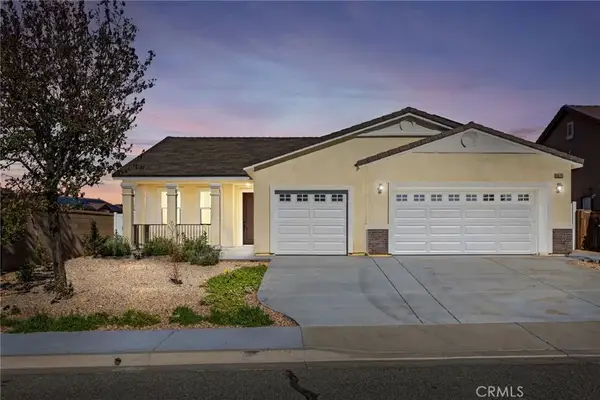 $549,900Active4 beds 2 baths2,111 sq. ft.
8575 Stockton Avenue, Hesperia, CA 92344
MLS# CV26081593Listed by: EXP REALTY OF SOUTHERN CALIFORNIA INC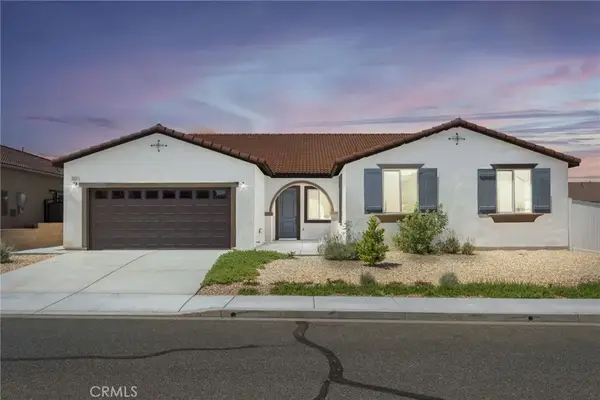 $689,950Active5 beds 3 baths2,914 sq. ft.
8534 Stockton Avenue, Hesperia, CA 92344
MLS# CV26081587Listed by: EXP REALTY OF SOUTHERN CALIFORNIA INC $545,000Active4 beds 3 baths2,532 sq. ft.
14201 Fir Street, Oak Hills, CA 92344
MLS# DW26082746Listed by: EHOMES $535,000Active4 beds 2 baths1,893 sq. ft.
16461 Fremontia, Hesperia, CA 92345
MLS# CV26082076Listed by: COLDWELL BANKER ICON $465,000Active5 beds 4 baths1,296 sq. ft.
17185 Fremontia Street, Hesperia, CA 92345
MLS# HD26067358Listed by: LANDCORE REALTY $399,000Active3 beds 2 baths1,495 sq. ft.
19014 Vine, Hesperia, CA 92345
MLS# HD26081510Listed by: THE PROPERTY CONNECTION $444,500Pending3 beds 2 baths1,620 sq. ft.
8173 Mono, Hesperia, CA 92345
MLS# HD26076948Listed by: EXP REALTY OF SOUTHERN CA INC. $289,000Pending2 beds 2 baths918 sq. ft.
16345 Cashew, Hesperia, CA 92345
MLS# HD26080379Listed by: REAL BROKERAGE TECHNOLOGIES $629,000Active4 beds 3 baths2,274 sq. ft.
15640 Lime, Hesperia, CA 92345
MLS# IV26053767Listed by: KELLER WILLIAMS REALTY $558,415Pending4 beds 3 baths2,583 sq. ft.
7438 Bucknell Avenue, Hesperia, CA 92345
MLS# SW26080562Listed by: CENTURY 21 MASTERS $741,250Pending5 beds 4 baths4,133 sq. ft.
14307 Chaffey Street, Hesperia, CA 92345
MLS# SW26080586Listed by: CENTURY 21 MASTERS $495,000Active4 beds 3 baths2,869 sq. ft.
13017 Cerritos Court, Hesperia, CA 92344
MLS# IV26078380Listed by: ADRIANA'S REALTY GROUP $519,900Pending5 beds 3 baths2,957 sq. ft.
14126 Tiger Lily Court, Hesperia, CA 92344
MLS# HD26079843Listed by: CENTURY 21 MASTERS $525,000Active3 beds 2 baths2,008 sq. ft.
18616 Plumas Street, Hesperia, CA 92345
MLS# HD26072998Listed by: EXCELLENCE RE REAL ESTATE $460,000Active3 beds 3 baths2,014 sq. ft.
10760 Morgan Court, Hesperia, CA 92345
MLS# HD26079196Listed by: KELLER WILLIAMS HIGH DESERT $575,000Active5 beds 3 baths2,752 sq. ft.
12934 Pearblossom Street, Hesperia, CA 92344
MLS# IV26078349Listed by: RYLANDER REALTY $459,500Pending3 beds 2 baths1,584 sq. ft.
14837 Melbourne, Hesperia, CA 92345
MLS# HD26078744Listed by: CENTURY 21 LEADERS REAL ESTATE $600,000Active4 beds 3 baths2,532 sq. ft.
14102 Chapman, Hesperia, CA 92344
MLS# HD26078379Listed by: KELLER WILLIAMS VICTOR VALLEY $374,900Pending4 beds 3 baths1,539 sq. ft.
9116 G Avenue, Hesperia, CA 92345
MLS# CV26078195Listed by: COLDWELL BANKER ICON $589,000Pending4 beds 2 baths2,584 sq. ft.
7518 San Bruno, Hesperia, CA 92345
MLS# HD26078154Listed by: RE/MAX FREEDOM $415,000Active3 beds 2 baths977 sq. ft.
9356 Nolina, Hesperia, CA 92344
MLS# CV26076609Listed by: ROA CALIFORNIA INC $473,000Pending3 beds 2 baths1,292 sq. ft.
10292 Kern, Hesperia, CA 92345
MLS# IV26077979Listed by: HOMESMART KEY REALTY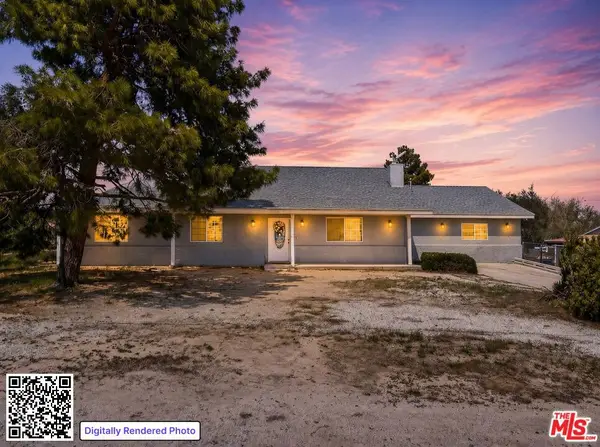 $549,900Active4 beds 3 baths2,947 sq. ft.
18060 Walnut Street, Hesperia, CA 92345
MLS# 26701201Listed by: REAL BROKER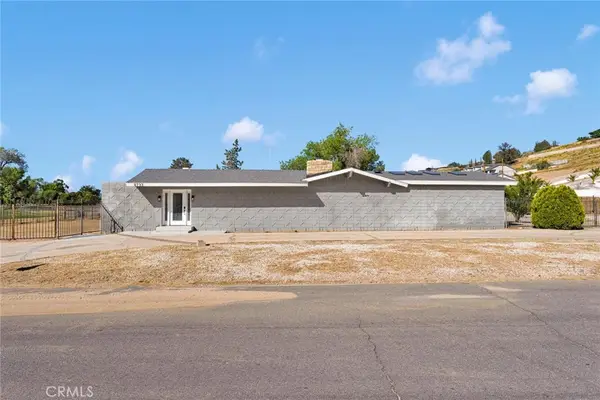 $499,000Pending5 beds 3 baths3,851 sq. ft.
8732 Pico Avenue, Hesperia, CA 92345
MLS# HD26077641Listed by: COLDWELL BANKER HOME SOURCE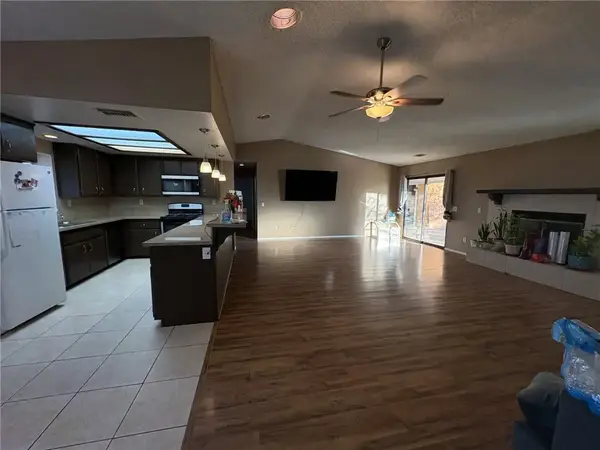 $415,000Active3 beds 2 baths1,668 sq. ft.
18603 Yucca, Hesperia, CA 92345
MLS# MB26077356Listed by: DIVERSIFIED WORKS $565,200Active3 beds 2 baths2,245 sq. ft.
17340 Buckthorn, Hesperia, CA 92345
MLS# HD26075256Listed by: KELLER WILLIAMS VICTOR VALLEY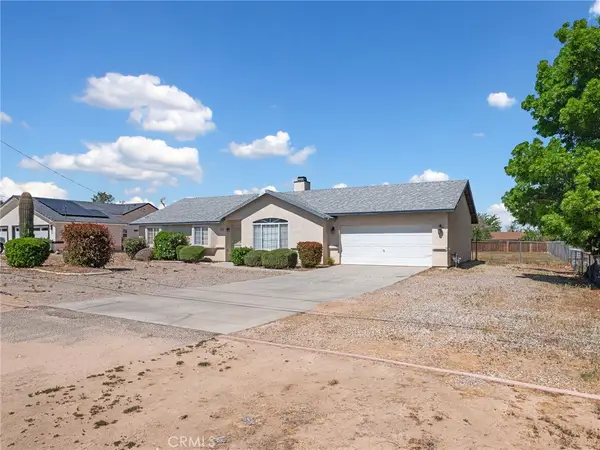 $398,000Pending3 beds 2 baths1,368 sq. ft.
19068 Goleta Street, Hesperia, CA 92345
MLS# HD26076782Listed by: COLDWELL BANKER HOME SOURCE $389,900Active2 beds 2 baths1,324 sq. ft.
16116 Cajon, Hesperia, CA 92345
MLS# HD26076827Listed by: CENTURY 21 LEADERS REAL ESTATE $465,000Active3 beds 2 baths1,353 sq. ft.
17047 Eucalyptus, Hesperia, CA 92345
MLS# OC26073089Listed by: HOMEQUEST REAL ESTATE $429,000Pending3 beds 2 baths1,596 sq. ft.
17747 Walnut Street, Hesperia, CA 92345
MLS# CV26076502Listed by: QUALITY HOMES & LOANS, INC. $620,000Pending4 beds 2 baths2,075 sq. ft.
7860 Alston, Hesperia, CA 92345
MLS# IG26076352Listed by: KELLER WILLIAMS REALTY $570,000Active4 beds 2 baths2,105 sq. ft.
11375 4th, Hesperia, CA 92345
MLS# PW26076218Listed by: COAST TO COAST REALTY $410,000Active3 beds 2 baths1,688 sq. ft.
7187 Dalscote, Hesperia, CA 92345
MLS# IG26075960Listed by: TOWN & COUNTRY REAL ESTATE- New
 $593,990Active4 beds 3 baths3,110 sq. ft.
9075 Carson Avenue, Hesperia, CA 92344
MLS# SR26118735Listed by: PACIFIC COMMUNITIES BUILDER INC.  $475,000Active3 beds 2 baths1,798 sq. ft.
15011 Mission Street, Hesperia, CA 92345
MLS# IV26075191Listed by: OPENDOOR BROKERAGE INC. $675,000Active4 beds 2 baths1,950 sq. ft.
18155 Dunkirk, Hesperia, CA 92345
MLS# IV26075033Listed by: EXP REALTY OF CALIFORNIA INC $465,000Active3 beds 2 baths1,353 sq. ft.
17047 Eucalyptus, Hesperia, CA 92345
MLS# OC26073089Listed by: HOMEQUEST REAL ESTATE $359,000Pending2 beds 1 baths720 sq. ft.
11918 Hemlock, Hesperia, CA 92345
MLS# RS26073750Listed by: PAK HOME REALTY $445,000Active3 beds 2 baths1,393 sq. ft.
14411 Willow, Hesperia, CA 92345
MLS# OC26074080Listed by: PRIME NEST REALTY, INC.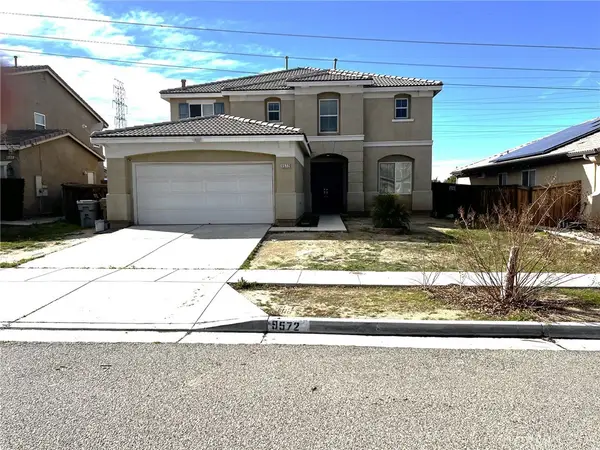 $505,000Pending4 beds 3 baths3,093 sq. ft.
9572 Peridot, Hesperia, CA 92344
MLS# SW26073872Listed by: SOUTHLAND MORTGAGE COMPANY $480,000Active3 beds 3 baths2,343 sq. ft.
8058 Gaylop, Hesperia, CA 92345
MLS# OC26073398Listed by: COMPASS $507,990Pending4 beds 3 baths2,160 sq. ft.
17421 Marion Mountain, Hesperia, CA 92345
MLS# IG26073134Listed by: RICHMOND AMERICAN HOMES $522,642Active4 beds 3 baths2,160 sq. ft.
6364 Basset Street, Hesperia, CA 92345
MLS# IG26073142Listed by: RICHMOND AMERICAN HOMES $506,106Active4 beds 3 baths2,070 sq. ft.
6334 Damascus Avenue, Hesperia, CA 92345
MLS# IG26073156Listed by: RICHMOND AMERICAN HOMES $509,696Pending4 beds 3 baths2,070 sq. ft.
6363 Damascus Avenue, Hesperia, CA 92345
MLS# IG26073146Listed by: RICHMOND AMERICAN HOMES $485,000Active4 beds 3 baths2,202 sq. ft.
10352 Primrose Court, Hesperia, CA 92345
MLS# SR26002211Listed by: WILLIE GENE HENDERSON $399,000Pending3 beds 1 baths1,081 sq. ft.
15683 Fir, Hesperia, CA 92345
MLS# PW26071074Listed by: KELLER WILLIAMS REALTY $639,000Active3 beds 3 baths2,684 sq. ft.
12830 Cedar, Hesperia, CA 92344
MLS# HD26069160Listed by: RICHARD BOUNCE, BROKER $385,500Active3 beds 2 baths1,224 sq. ft.
19145 Sheffield Street, Hesperia, CA 92345
MLS# PW26071529Listed by: REALTY ONE GROUP WEST $599,240Active3 beds 3 baths2,247 sq. ft.
6446 Marblebrook Avenue, Hesperia, CA 92345
MLS# IV26070256Listed by: SHINE REAL ESTATE AND MARKETING INC. $599,240Active3 beds 3 baths2,247 sq. ft.
6446 Marblebrook Avenue, Hesperia, CA 92345
MLS# IV26070256Listed by: SHINE REAL ESTATE AND MARKETING INC. $429,000Active3 beds 2 baths1,550 sq. ft.
7659 Arcadia Avenue, Hesperia, CA 92345
MLS# IV26041081Listed by: GS STRATEGIES, INC. $678,920Active4 beds 4 baths3,004 sq. ft.
6458 Marblebrook Avenue, Hesperia, CA 92345
MLS# IV26060461Listed by: SHINE REAL ESTATE AND MARKETING INC. $678,920Active4 beds 4 baths3,004 sq. ft.
6458 Marblebrook Avenue, Hesperia, CA 92345
MLS# IV26060461Listed by: SHINE REAL ESTATE AND MARKETING INC. $415,000Active2 beds 1 baths882 sq. ft.
11363 Maple, Hesperia, CA 92345
MLS# CV26068762Listed by: GOODSPEED GROUP INC. $519,950Active4 beds 2 baths1,763 sq. ft.
7838 Cataba Road, Hesperia, CA 92344
MLS# HD26058149Listed by: REAL BROKERAGE TECHNOLOGIES $438,000Active4 beds 3 baths2,236 sq. ft.
7589 Glider Ave, Hesperia, CA 92345
MLS# PW26068925Listed by: REAL BROKER $362,100Active4 beds 2 baths1,767 sq. ft.
18045 Juniper, Hesperia, CA 92345
MLS# DW26068414Listed by: YOUR HOME REAL ESTATE, INC. $429,000Active3 beds 2 baths1,550 sq. ft.
7659 Arcadia Avenue, Hesperia, CA 92345
MLS# IV26041081Listed by: GS STRATEGIES, INC.- Open Sat, 11am to 4pm
 $629,990Active4 beds 4 baths2,747 sq. ft.
7141 Doheny Court, Hesperia, CA 92345
MLS# SW26068040Listed by: K. HOVNANIAN COMPANIES OF CA  $364,990Active3 beds 2 baths1,090 sq. ft.
9922 Victor Avenue, Hesperia, CA 92345
MLS# CV26067274Listed by: MGR REAL ESTATE, INC. $559,000Pending4 beds 3 baths2,100 sq. ft.
17796 Valencia Street, Hesperia, CA 92345
MLS# HD26065285Listed by: COLDWELL BANKER HOME SOURCE $480,000Active4 beds 2 baths2,123 sq. ft.
9178 Goldenseal Court, Hesperia, CA 92344
MLS# HD26066325Listed by: REALTY ONE GROUP EMPIRE $399,999Active3 beds 2 baths1,616 sq. ft.
17986 Westlawn, Hesperia, CA 92345
MLS# CV26066156Listed by: REALTY MASTERS & ASSOCIATES, IN $399,999Active3 beds 2 baths1,616 sq. ft.
17986 Westlawn, Hesperia, CA 92345
MLS# CV26066156Listed by: REALTY MASTERS & ASSOCIATES, IN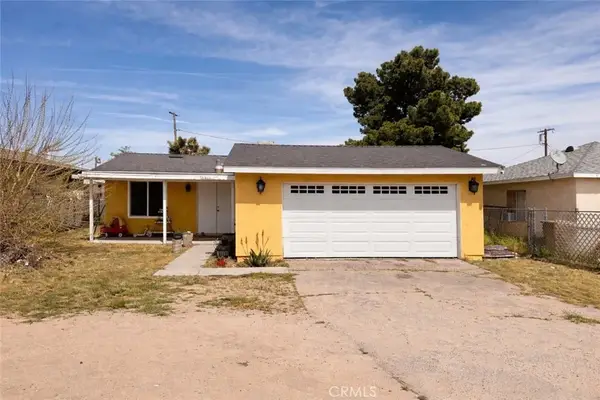 $325,000Pending2 beds 1 baths864 sq. ft.
16464 Orange, Hesperia, CA 92345
MLS# DW26066200Listed by: VIDA REAL ESTATE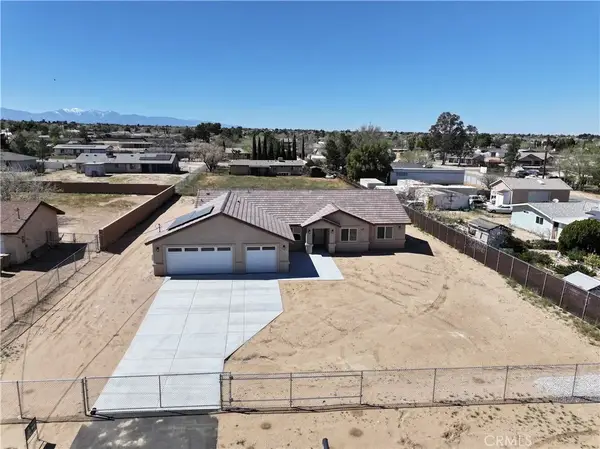 $577,700Active4 beds 3 baths2,111 sq. ft.
9432 Wasco, Hesperia, CA 92345
MLS# HD26065757Listed by: EXP REALTY OF SOUTHERN CA INC.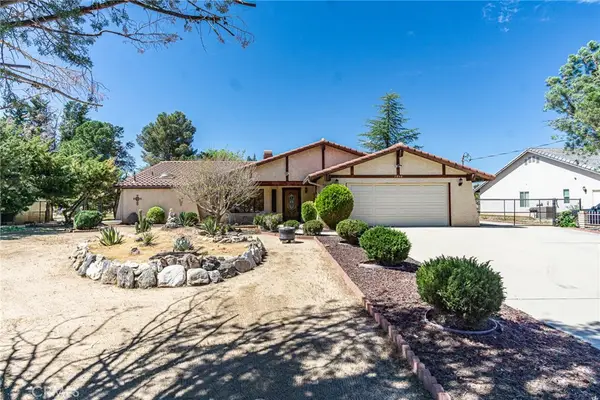 $529,900Active3 beds 3 baths1,804 sq. ft.
7040 Kenyon Avenue, Hesperia, CA 92345
MLS# HD26063290Listed by: CENTURY 21 MASTERS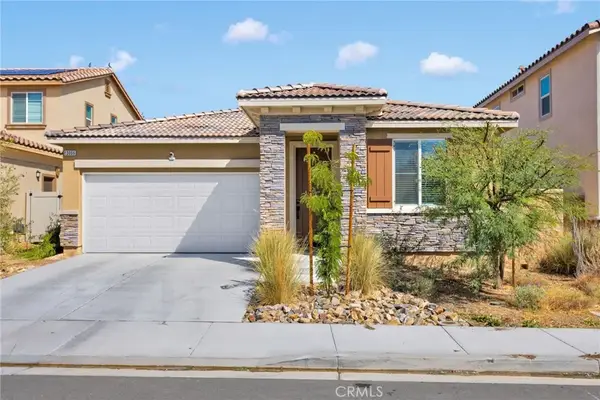 $499,999Active3 beds 2 baths1,625 sq. ft.
13056 Lancaster, Hesperia, CA 92344
MLS# HD26063067Listed by: FIRST TEAM REAL ESTATE-HIGHDES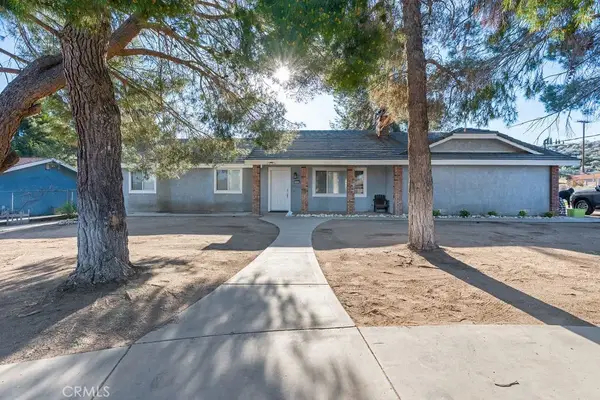 $499,999Active4 beds 3 baths1,628 sq. ft.
7365 Chase, Hesperia, CA 92345
MLS# IV26063131Listed by: TOWER AGENCY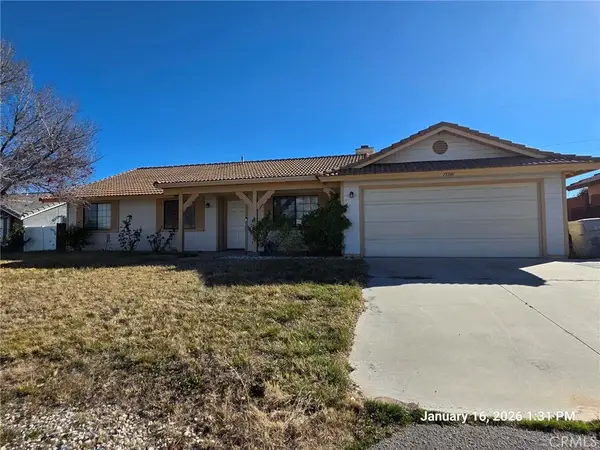 $405,000Active3 beds 2 baths1,378 sq. ft.
15501 Via Bahia Street, Hesperia, CA 92345
MLS# HD26062270Listed by: FIRST TEAM REAL ESTATE-HIGHDES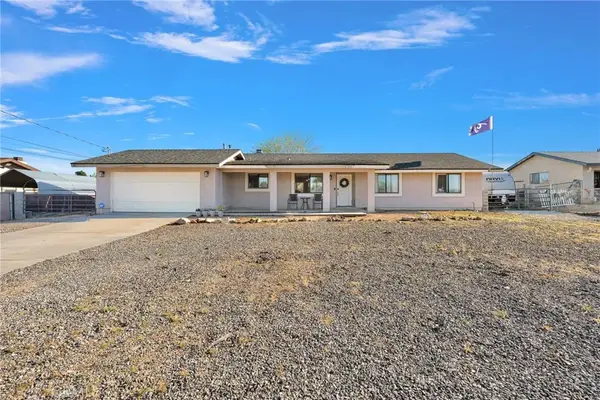 $424,900Pending3 beds 2 baths1,400 sq. ft.
15017 Cashew, Hesperia, CA 92345
MLS# HD26060128Listed by: REALTY ONE GROUP EMPIRE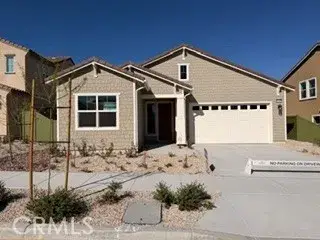 $522,678Active3 beds 3 baths1,824 sq. ft.
6318 Rainy Pass, Hesperia, CA 92345
MLS# IG26058910Listed by: RICHMOND AMERICAN HOMES $443,417Active3 beds 2 baths1,836 sq. ft.
17886 Mckenzie Court, Hesperia, CA 92345
MLS# SW26060357Listed by: CENTURY 21 MASTERS $425,000Active3 beds 2 baths1,359 sq. ft.
11890 10th, Hesperia, CA 92345
MLS# CV26059187Listed by: KELLER WILLIAMS COVINA $510,900Active4 beds 2 baths2,220 sq. ft.
13817 Grant Way, Oak Hills, CA 92344
MLS# IG26058807Listed by: ELEVATE REAL ESTATE AGENCY $449,000Pending3 beds 2 baths1,204 sq. ft.
8770 Glendale, Hesperia, CA 92345
MLS# HD26058934Listed by: REALTY ONE GROUP EMPIRE $645,000Active5 beds 4 baths2,363 sq. ft.
9037 5th Avenue, Hesperia, CA 92345
MLS# HD26058423Listed by: CENTURY 21 MASTERS $350,000Pending3 beds 2 baths1,143 sq. ft.
10703 Banning, Hesperia, CA 92345
MLS# CV26058063Listed by: GUSHUE REAL ESTATE $519,950Active4 beds 2 baths1,763 sq. ft.
7838 Cataba Road, Hesperia, CA 92344
MLS# HD26058149Listed by: REAL BROKERAGE TECHNOLOGIES $579,000Pending4 beds 3 baths2,212 sq. ft.
18756 Centennial Street, Hesperia, CA 92345
MLS# IV26051253Listed by: CENTURY 21 MASTERS $489,999Pending4 beds 2 baths2,023 sq. ft.
13577 Buena Vista Drive, Hesperia, CA 92344
MLS# IG26054237Listed by: ELEVATE REAL ESTATE AGENCY $584,000Active4 beds 4 baths3,094 sq. ft.
12971 Fawnskin, Hesperia, CA 92344
MLS# PW26056437Listed by: EMPIRE REALTY- Open Sun, 10am to 1pm
 $635,000Active4 beds 3 baths3,534 sq. ft.
18186 Bangor, Hesperia, CA 92345
MLS# HD26052982Listed by: COLDWELL BANKER HOME SOURCE  $573,280Active3 beds 3 baths2,247 sq. ft.
17127 Kent Street, Hesperia, CA 92345
MLS# IV26053840Listed by: SHINE REAL ESTATE AND MARKETING INC. $525,000Pending5 beds 3 baths2,316 sq. ft.
7829 Chase Avenue, Hesperia, CA 92345
MLS# CV26053697Listed by: REDFIN CORPORATION $450,000Active3 beds 2 baths1,420 sq. ft.
8878 Sabina, Hesperia, CA 92345
MLS# PT26054110Listed by: EXP REALTY OF SOUTHERN CALIF.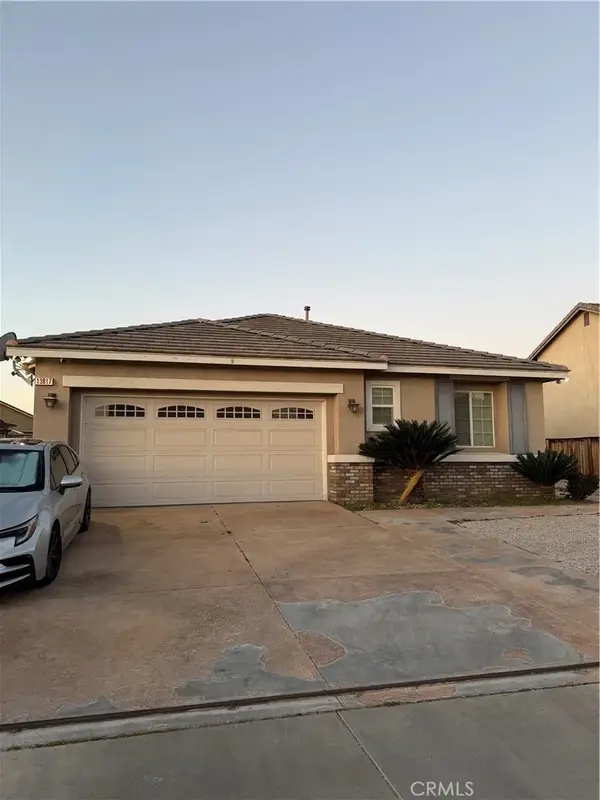 $499,900Active3 beds 2 baths2,020 sq. ft.
13817 Coolidge, Oak Hills, CA 92344
MLS# CV26048794Listed by: MI CASA BONITA, INC $424,000Pending3 beds 2 baths1,153 sq. ft.
16020 Lime, Hesperia, CA 92345
MLS# TR26039640Listed by: SARAVIA REALTY $435,000Active3 beds 2 baths1,708 sq. ft.
10401 Victor, Hesperia, CA 92345
MLS# CV26050086Listed by: WS REALTY, INC.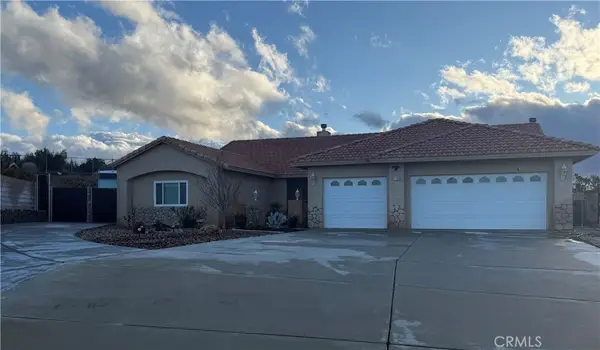 $615,000Active4 beds 3 baths3,004 sq. ft.
7153 Century Avenue, Hesperia, CA 92345
MLS# HD26039384Listed by: COLDWELL BANKER HOME SOURCE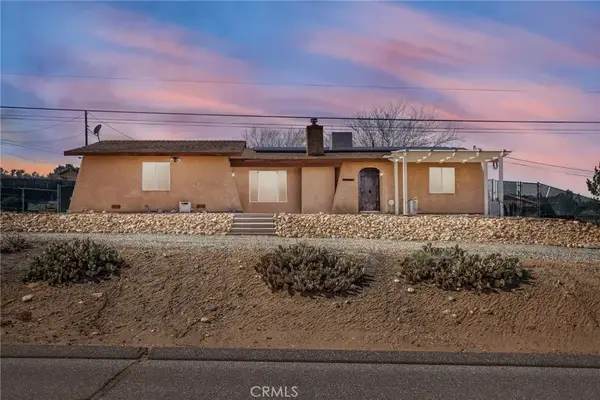 $389,800Active3 beds 2 baths1,230 sq. ft.
7929 Mono, Hesperia, CA 92345
MLS# CV26048964Listed by: PLEASANT HILL REAL ESTATE GROUP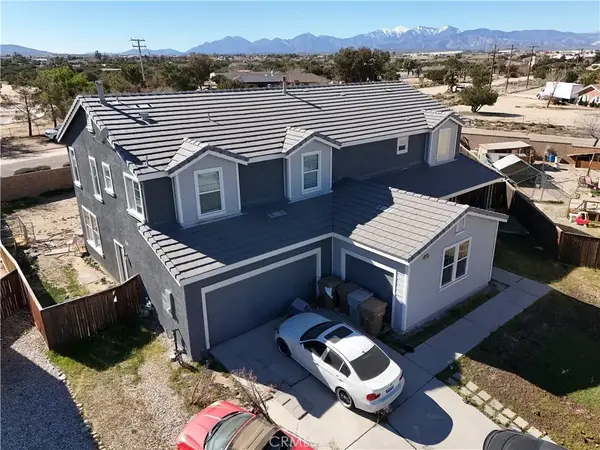 $430,670Pending5 beds 3 baths3,106 sq. ft.
12909 Pearblossom Street, Hesperia, CA 92344
MLS# OC26048675Listed by: REAL BROKER $379,000Pending3 beds 2 baths1,479 sq. ft.
18449 Hackberry, Hesperia, CA 92345
MLS# IG26047558Listed by: REALTY ONE GROUP EMPIRE $724,990Pending5 beds 4 baths4,133 sq. ft.
14180 Rollins Street, Hesperia, CA 92345
MLS# SW26047204Listed by: CENTURY 21 MASTERS $563,390Pending5 beds 3 baths3,010 sq. ft.
7483 Bucknell Avenue, Hesperia, CA 92345
MLS# SW26047214Listed by: CENTURY 21 MASTERS $600,000Active4 beds 3 baths2,150 sq. ft.
10704 11th Ave., Hesperia, CA 92345
MLS# HD26046063Listed by: CENTURY 21 LEADERS REAL ESTATE $520,769Pending4 beds 3 baths2,427 sq. ft.
17538 Bassets Street, Hesperia, CA 92345
MLS# SW26043290Listed by: CENTURY 21 MASTERS $280,000Active3 beds 1 baths1,071 sq. ft.
15823 Walnut, Hesperia, CA 92345
MLS# DW26042208Listed by: SUPREME REALTY $949,000Active6 beds 3 baths4,024 sq. ft.
9150 10th, Hesperia, CA 92345
MLS# GD26040978Listed by: THE ART IN REAL ESTATE $550,000Active4 beds 3 baths2,375 sq. ft.
10260 Torrey Court, Hesperia, CA 92345
MLS# DW26040860Listed by: FIRST FAMILY HOMES $671,990Active4 beds 4 baths2,747 sq. ft.
7181 Dohney Court, Hesperia, CA 92345
MLS# SW26040821Listed by: K. HOVNANIAN COMPANIES OF CA $360,000Active3 beds 2 baths1,516 sq. ft.
18104 Birch, Hesperia, CA 92345
MLS# IV26040980Listed by: COLDWELL BANKER LEADERS $415,000Active3 beds 2 baths1,159 sq. ft.
9105 Aspenwood, Hesperia, CA 92344
MLS# IV26039557Listed by: BRANT ENSWORTH, BROKER $425,000Active3 beds 2 baths1,625 sq. ft.
13042 Lancaster, Hesperia, CA 92344
MLS# DW26039964Listed by: EXP REALTY OF GREATER L.A $545,000Pending4 beds 3 baths2,992 sq. ft.
14068 Gold Street, Hesperia, CA 92344
MLS# HD26039116Listed by: CENTURY 21 MASTERS $502,000Active3 beds 2 baths1,378 sq. ft.
17775 Sultana Street, Hesperia, CA 92345
MLS# HD26039691Listed by: CENTURY 21 MASTERS $549,000Pending6 beds 3 baths3,513 sq. ft.
9495 Peridot, Hesperia, CA 92344
MLS# HD26038888Listed by: RE/MAX FREEDOM $725,000Pending4 beds 3 baths2,622 sq. ft.
15179 Olive St, Hesperia, CA 92345
MLS# HD26038976Listed by: CENTURY 21 LEADERS REAL ESTATE $725,000Pending4 beds 3 baths2,622 sq. ft.
15179 Olive St, Hesperia, CA 92345
MLS# HD26038976Listed by: CENTURY 21 LEADERS REAL ESTATE $435,000Pending3 beds 2 baths1,816 sq. ft.
9301 Creosote, Oak Hills, CA 92344
MLS# HD26035175Listed by: REALTY ONE GROUP EMPIRE $365,000Pending2 beds 2 baths1,450 sq. ft.
18622 Orange, Hesperia, CA 92345
MLS# HD26037569Listed by: FRED DOTTERRER, BROKER $420,000Active3 beds 2 baths1,812 sq. ft.
18062 Hackberry Street, Hesperia, CA 92345
MLS# PTP2601271Listed by: SDX REALTY AND MANAGEMENT $545,999Active5 beds 3 baths2,658 sq. ft.
13674 Buena Vista, Hesperia, CA 92344
MLS# IV26035387Listed by: ELEVATE REAL ESTATE AGENCY $340,000Active2 beds 1 baths1,396 sq. ft.
16366 Walnut, Hesperia, CA 92345
MLS# HD26035304Listed by: COLDWELL BANKER HOME SOURCE $375,000Pending3 beds 2 baths1,453 sq. ft.
14465 Linden, Hesperia, CA 92345
MLS# PW26033935Listed by: RE/MAX FREEDOM $640,000Active4 beds 3 baths2,169 sq. ft.
17850 Bangor Avenue, Hesperia, CA 92345
MLS# HD26032946Listed by: MESA PROPERTIES INC. $349,000Active2 beds 1 baths804 sq. ft.
18778 Valencia, Hesperia, CA 92345
MLS# OC26033557Listed by: RE/MAX TERRASOL $535,000Pending3 beds 2 baths2,105 sq. ft.
17041 Fairburn Street, Hesperia, CA 92345
MLS# DW26027829Listed by: CENTURY 21 LOTUS $469,000Active3 beds 2 baths1,978 sq. ft.
17482 Walnut, Hesperia, CA 92345
MLS# HD26032886Listed by: EXP REALTY OF SOUTHERN CA INC. $544,999Active3 beds 3 baths2,384 sq. ft.
18785 Talisman, Hesperia, CA 92345
MLS# CV26029836Listed by: FIRST TEAM REAL ESTATE $335,000Pending3 beds 2 baths1,701 sq. ft.
17405 Adobe, Hesperia, CA 92345
MLS# HD26031836Listed by: COLDWELL BANKER HOME SOURCE $455,000Active4 beds 2 baths1,661 sq. ft.
18804 Vine Street, Hesperia, CA 92345
MLS# HD26030203Listed by: COLDWELL BANKER ENVISION $440,000Pending5 beds 3 baths2,669 sq. ft.
12962 Newport, Hesperia, CA 92344
MLS# IV26031105Listed by: PREMIERE HOMES $599,000Active4 beds 3 baths2,532 sq. ft.
14219 Fir, Oak Hills, CA 92344
MLS# IV26030804Listed by: REMAX FOOTHILLS $469,000Pending4 beds 2 baths1,900 sq. ft.
12962 Tehachapi Street, Hesperia, CA 92344
MLS# CV26030684Listed by: VISMAR REAL ESTATE $1,120,000Active4 beds 4 baths3,216 sq. ft.
7172 Jargon St, Hesperia, CA 92344
MLS# PW26016957Listed by: CENTURY 21 ALLSTARS $430,000Active2 beds 1 baths972 sq. ft.
8915 3rd Avenue, Hesperia, CA 92345
MLS# CV26028019Listed by: ANOMALY REAL ESTATE $425,000Pending3 beds 2 baths1,453 sq. ft.
11497 2nd Avenue, Hesperia, CA 92345
MLS# IG26013655Listed by: PONCE & PONCE REALTY, INC $457,000Active4 beds 3 baths2,204 sq. ft.
8910 Newcastle, Hesperia, CA 92344
MLS# TR26025673Listed by: RE/MAX GALAXY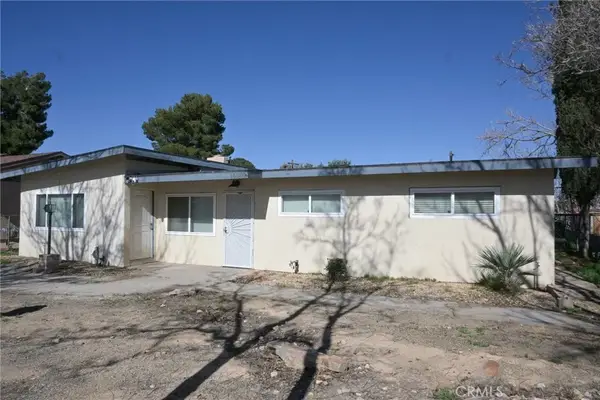 $350,000Pending4 beds 2 baths1,457 sq. ft.
16300 Live Oak, Hesperia, CA 92345
MLS# HD26024762Listed by: VESTA REALTY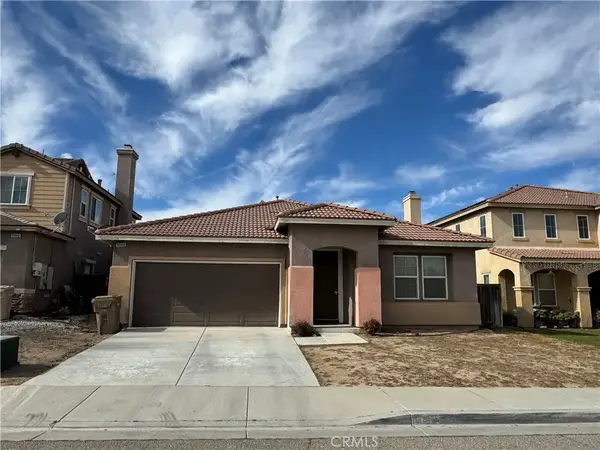 $465,000Active3 beds 2 baths2,160 sq. ft.
8848 Palo Alto, Hesperia, CA 92344
MLS# TR26023419Listed by: A + REALTY & MORTGAGE $549,900Active4 beds 5 baths2,637 sq. ft.
17820 Sycamore Street, Hesperia, CA 92345
MLS# CV26009667Listed by: PLEASANT HILL REAL ESTATE GROUP $475,000Active3 beds 2 baths1,685 sq. ft.
17355 La Junta Street, Hesperia, CA 92345
MLS# P1-25609Listed by: COMPASS $499,999Active4 beds 3 baths1,995 sq. ft.
7868 Arrowhead Lake Road, Hesperia, CA 92345
MLS# HD26015134Listed by: RIGEL CAPITAL
Local realty services provided by:CENTURY 21 Affiliated
This information is deemed reliable but not guaranteed. You should rely on this information only to decide whether or not to further investigate a particular property. BEFORE MAKING ANY OTHER DECISION, YOU SHOULD PERSONALLY INVESTIGATE THE FACTS (e.g. square footage and lot size) with the assistance of an appropriate professional. You may use this information only to identify properties you may be interested in investigating further. All uses except for personal, non-commercial use in accordance with the foregoing purpose are prohibited. Redistribution or copying of this information, any photographs or video tours is strictly prohibited. This information is derived from the Internet Data Exchange (IDX) service provided by San Diego MLS®. Displayed property listings may be held by a brokerage firm other than the broker and/or agent responsible for this display. The information and any photographs and video tours and the compilation from which they are derived is protected by copyright. Compilation © 2020 San Diego MLS®, Inc. SANDICOR Member Broker: Nikki Coppa
The information being provided by California Regional MLS (Southern California) is for the consumer's personal, non-commercial use and may not be used for any purpose other than to identify prospective properties consumer may be interested in purchasing. Any information relating to real estate for sale referenced on this web site comes from the Internet Data Exchange (IDX) program of the California Regional MLS (Southern California). CENTURY 21 Affiliated is not a Multiple Listing Service (MLS), nor does it offer MLS access. This website is a service of CENTURY 21 Affiliated, a broker participant of California Regional MLS (Southern California). This web site may reference real estate listing(s) held by a brokerage firm other than the broker and/or agent who owns this web site.
The accuracy of all information, regardless of source, including but not limited to open house information, square footages and lot sizes, is deemed reliable but not guaranteed and should be personally verified through personal inspection by and/or with the appropriate professionals. The data contained herein is copyrighted by California Regional MLS (Southern California) and is protected by all applicable copyright laws. Any unauthorized dissemination of this information is in violation of copyright laws and is strictly prohibited.
Copyright 2021 California Regional MLS (Southern California). All rights reserved. CRMLS Member Broker: Nikki Coppa
Neighborhoods near Hesperia, CA
Zip codes near Hesperia, CA
- 92308 homes for sale
- 92317 homes for sale
- 92321 homes for sale
- 92322 homes for sale
- 92325 homes for sale
- 92341 homes for sale
- 92344 homes for sale
- 92345 homes for sale
- 92352 homes for sale
- 92358 homes for sale
- 92371 homes for sale
- 92378 homes for sale
- 92382 homes for sale
- 92385 homes for sale
- 92391 homes for sale
- 92392 homes for sale
- 92394 homes for sale
- 92395 homes for sale
- 92404 homes for sale
- 92407 homes for sale
Popular searches near Hesperia, CA
- Adelanto homes for sale
- Apple Valley homes for sale
- Blue Jay homes for sale
- Cedar Glen homes for sale
- Cedarpines Park homes for sale
- Crestline homes for sale
- Lake Arrowhead homes for sale
- Lytle Creek homes for sale
- Mount Baldy-Wrightwood homes for sale
- Mountain View Acres homes for sale
- Muscoy homes for sale
- Oak Hills homes for sale
- Phelan homes for sale
- Rimforest homes for sale
- Running Springs homes for sale
- Skyforest homes for sale
- Spring Valley Lake homes for sale
- Twin Peaks homes for sale
- Victorville homes for sale
- Victorville-Hesperia homes for sale
Protect your home and budget from life's surprises with an Assurant Home Warranty, backed by a partner that supports you through every step of homeownership. Explore Plans.
©2026 Century 21 Real Estate LLC. All rights reserved. CENTURY 21®, the CENTURY 21 Logo and C21® are service marks owned by Century 21 Real Estate LLC. Century 21 Real Estate LLC fully supports the principles of the Fair Housing Act and the Equal Opportunity Act. Each office is independently owned and operated. Listing information is deemed reliable but not guaranteed accurate.