- Adams, Huntington Beach homes for sale
- Balearic Park, Costa Mesa homes for sale
- Beachwalk, Huntington Beach homes for sale
- Bolsa Chica-Heil, Huntington Beach homes for sale
- Downtown Huntington Beach, Huntington Beach homes for sale
- Garfield, Huntington Beach homes for sale
- Goldenwest, Huntington Beach homes for sale
- Holly-Seacliff, Huntington Beach homes for sale
- Lower Bird Streets, Costa Mesa homes for sale
- Mesa Verde, Costa Mesa homes for sale
- Newland, Huntington Beach homes for sale
- Oak View, Huntington Beach homes for sale
- Seabridge, Huntington Beach homes for sale
- Seacliff, Huntington Beach homes for sale
- Southeast Huntington Beach, Huntington Beach homes for sale
- The Island Streets, Costa Mesa homes for sale
- The State Streets, Costa Mesa homes for sale
- Washington, Huntington Beach homes for sale
- Wesley Park, Huntington Beach homes for sale
- Yorktown, Huntington Beach homes for sale
Huntington Beach, CA - homes for sale
138 of 138 results displayed
- New
 $899,000Active2 beds 1 baths1,025 sq. ft.
1200 Pacific Coast Highway #305, Huntington Beach, CA 92648
MLS# 26843577Listed by: COMPASS - Open Sat, 12 to 3pmNew
 $584,000Active1 beds 1 baths767 sq. ft.
20371 Bluffside, Huntington Beach, CA 92646
MLS# CV26122472Listed by: IVES LOPEZ, BROKER - Open Sun, 1 to 4pmNew
 $897,000Active2 beds 3 baths1,554 sq. ft.
16631 Algonquin Street, Huntington Beach, CA 92649
MLS# 26843253Listed by: COMPASS - Open Sat, 12 to 3pmNew
 $499,000Active1 beds 1 baths784 sq. ft.
8777 Coral Springs Court #11H, Huntington Beach, CA 92646
MLS# OC26121181Listed by: RE/MAX SELECT ONE - Open Sat, 1 to 4pmNew
 $895,000Active2 beds 2 baths1,056 sq. ft.
8566 Fallbrook, Huntington Beach, CA 92646
MLS# OC26120360Listed by: LIMA REAL ESTATE GROUP - Open Sat, 1 to 4pmNew
 $724,900Active2 beds 2 baths1,020 sq. ft.
9717 Pettswood #6 Drive, Huntington Beach, CA 92646
MLS# OC26118531Listed by: FIRST TEAM REAL ESTATE - Open Sat, 12 to 3pmNew
 $422,500Active1 beds 1 baths593 sq. ft.
18292 Parkview, Huntington Beach, CA 92648
MLS# OC26118796Listed by: COLDWELL BANKER-CAMPBELL RLTRS - Open Sat, 12 to 4pmNew
 $948,000Active2 beds 3 baths1,756 sq. ft.
7402 Yellowtail Drive #204 Drive #204, Huntington Beach, CA 92648
MLS# TR26073140Listed by: LS 1 REALTY - Coming SoonOpen Sat, 1 to 3pm
 $1,050,000Coming Soon2 beds 2 baths
3234 Anne, Huntington Beach, CA 92649
MLS# OC26119053Listed by: PACIFIC SOTHEBY'S INT'L REALTY - Coming SoonOpen Sun, 1 to 4pm
 $850,000Coming Soon2 beds 2 baths
18692 Maplewood Cir, Huntington Beach, CA 92646
MLS# OC26116921Listed by: RE/MAX SELECT ONE - New
 $749,000Active2 beds 2 baths1,056 sq. ft.
8932 Amador #1312A, Huntington Beach, CA 92646
MLS# PW26117746Listed by: THE CREM GROUP - New
 $1,590,000Active2 beds 3 baths1,843 sq. ft.
21331 Veleta Circle, Huntington Beach, 92648
MLS# 12662103Listed by: COMPASS
- New
 $789,000Active2 beds 2 baths1,149 sq. ft.
8192 Sandcove Cir #106, Huntington Beach, CA 92646
MLS# PW26116982Listed by: GMT REAL ESTATE - Open Sat, 1:30 to 4:30pmNew
 $785,000Active1 beds 1 baths693 sq. ft.
2000 Pacific Coast Highway #203, Huntington Beach, CA 92648
MLS# TR26115649Listed by: HOMECOIN.COM - Open Sat, 1 to 4pmNew
 $750,000Active1 beds 1 baths764 sq. ft.
17142 Pacific Coast #201, Huntington Beach, CA 92649
MLS# NP26113967Listed by: BERKSHIRE HATHAWAY HOMESERVICE - New
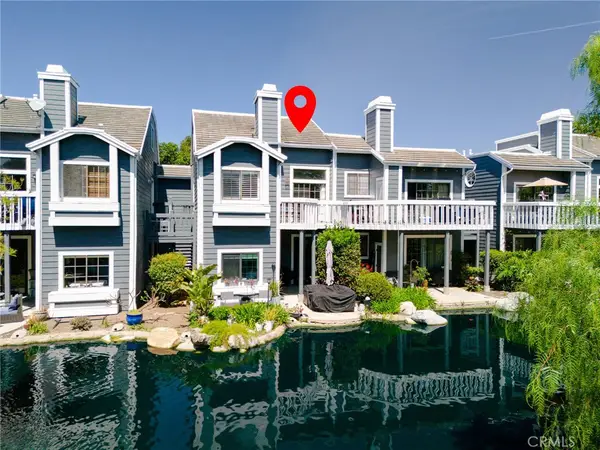
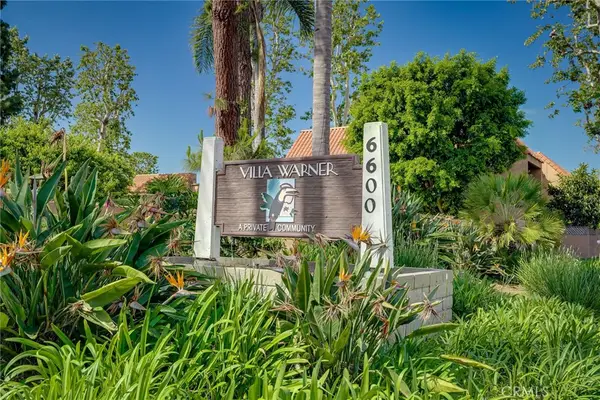
 $439,000Active1 beds 1 baths785 sq. ft.
6600 Warner Ave. #41, Huntington Beach, CA 92647
MLS# OC26111740Listed by: THE OC REAL ESTATE - New
 $1,433,000Active3 beds 3 baths2,444 sq. ft.
7309 Arcadia, Huntington Beach, CA 92648
MLS# DW26114957Listed by: CENTURY 21 JERVIS & ASSOCIATES - New
 $799,900Active2 beds 2 baths1,149 sq. ft.
8182 Mainsail #204, Huntington Beach, CA 92646
MLS# NP26113278Listed by: WEICHMAN REAL ESTATE - Open Sat, 2 to 4pm
 $679,000Active2 beds 2 baths1,037 sq. ft.
21372 Brookhurst #226, Huntington Beach, CA 92646
MLS# PW26111864Listed by: FIRST TEAM REAL ESTATE  $555,000Active2 beds 1 baths758 sq. ft.
16651 Arbor, Huntington Beach, CA 92647
MLS# OC26111924Listed by: HOMELENDING REAL ESTATE INC. $850,000Active2 beds 2 baths1,440 sq. ft.
16421 Poipu Ln., Huntington Beach, CA 92649
MLS# OC26108182Listed by: FIRST TEAM REAL ESTATE- Open Sun, 12 to 3pm
 $399,000Active1 beds 1 baths785 sq. ft.
6600 Warner Ave #42, Huntington Beach, CA 92647
MLS# OC26109994Listed by: SEVEN GABLES REAL ESTATE - Coming Soon
 $738,888Coming Soon3 beds 2 baths
9675 Adams Avenue, Huntington Beach, CA 92646
MLS# OC26107580Listed by: FIRST TEAM REAL ESTATE  $879,900Active1 beds 1 baths906 sq. ft.
200 Pacific Coast #M-9, Huntington Beach, CA 92648
MLS# OC26106612Listed by: HOMESMART, EVERGREEN REALTY $399,999Active1 beds 1 baths593 sq. ft.
18242 Parkview #106, Huntington Beach, CA 92648
MLS# IV26106654Listed by: RE/MAX TIME REALTY $725,000Active2 beds 2 baths1,250 sq. ft.
306 Coral Reef #54, Huntington Beach, CA 92648
MLS# OC26106298Listed by: RE/MAX SELECT ONE $599,888Active1 beds 1 baths767 sq. ft.
20191 Cape Coral Lane #3-114, Huntington Beach, CA 92646
MLS# PW26102702Listed by: ZF REALTY $650,000Active3 beds 2 baths1,130 sq. ft.
16507 Caballero Lane, Huntington Beach, CA 92649
MLS# OC26105326Listed by: COLDWELL BANKER REALTY- Open Sat, 12 to 2pm
 $569,900Active1 beds 1 baths880 sq. ft.
16858 Algonquin, Huntington Beach, CA 92649
MLS# IG26105375Listed by: CENTURY 21 MASTERS  $774,000Active2 beds 2 baths1,342 sq. ft.
5142 Warner Avenue #109, Huntington Beach, CA 92649
MLS# PW26101068Listed by: KATNIK BROTHERS R.E. SERVICES- Open Sun, 1 to 3pm
 $1,590,000Active2 beds 3 baths1,843 sq. ft.
21331 Veleta, Huntington Beach, CA 92648
MLS# NP26104574Listed by: COMPASS - Open Sat, 1 to 3pm
 $970,000Active3 beds 3 baths1,815 sq. ft.
8120 Baymist Drive #C, Huntington Beach, CA 92646
MLS# OC26102231Listed by: RE/MAX TERRASOL  $547,000Active2 beds 2 baths1,032 sq. ft.
8633 Portola Court #18F, Huntington Beach, CA 92646
MLS# OC26103755Listed by: RE/MAX SELECT ONE- Open Fri, 10am to 12pm
 $425,000Active1 beds 1 baths754 sq. ft.
6600 Warner #115, Huntington Beach, CA 92647
MLS# OC26102934Listed by: FIRST TEAM REAL ESTATE  $890,000Active1 beds 1 baths1,230 sq. ft.
200 Pacific Coast Hwy #110, Huntington Beach, CA 92648
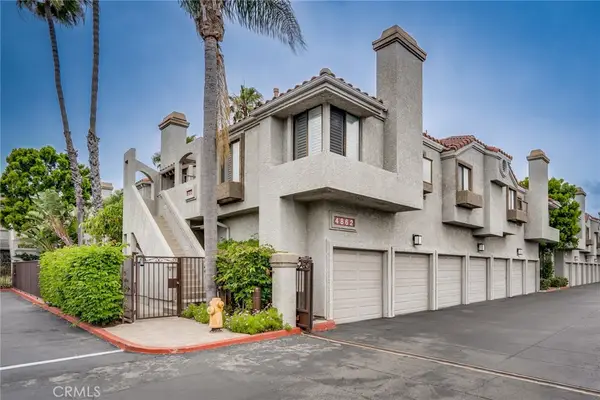
MLS# PW26050150Listed by: EMMET MCKUNE & ASSOCIATES. $789,000Active3 beds 2 baths1,234 sq. ft.
4682 Warner Avenue #C304, Huntington Beach, CA 92649
MLS# OC26101568Listed by: RE/MAX SELECT ONE $1,295,000Active2 beds 3 baths1,530 sq. ft.
414 Main St Unit 210, Huntington Beach, CA 92648
MLS# OC26100199Listed by: HUNTINGTON BEACH REALTY INC- Open Sat, 1 to 4pm
 $849,900Active1 beds 1 baths693 sq. ft.
2000 Pacific Coast Hwy #308, Huntington Beach, CA 92648
MLS# PW26101132Listed by: NEW EMPIRE REALTY  $789,900Pending2 beds 2 baths1,072 sq. ft.
8877 Tulare #313-B, Huntington Beach, CA 92646
MLS# OC26101032Listed by: HUNTINGTON LANDMARK REALTY $659,000Active2 beds 2 baths1,108 sq. ft.
16582 Nube, Huntington Beach, CA 92649
MLS# NP26100874Listed by: BEYOND LOCAL REAL ESTATE & DESIGN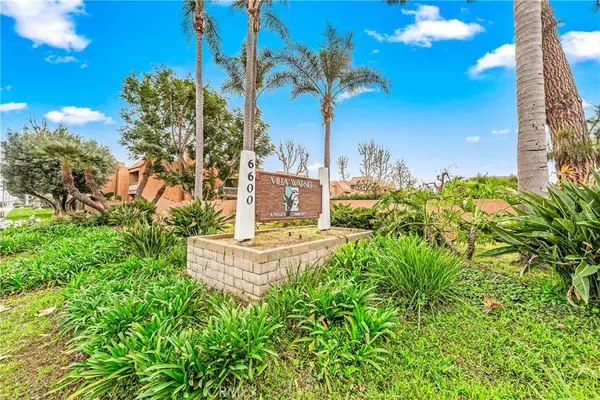 $429,000Active1 beds 1 baths785 sq. ft.
6600 Warner #94, Huntington Beach, CA 92647
MLS# OC26099834Listed by: SEVEN GABLES REAL ESTATE $1,029,000Active3 beds 4 baths1,454 sq. ft.
17536 Cameron Lane #105, Huntington Beach, CA 92647
MLS# PW26099260Listed by: SUPERIOR REAL ESTATE GROUP $690,000Active2 beds 2 baths1,002 sq. ft.
17202 Corbina #102, Huntington Beach, CA 92649
MLS# NP26099069Listed by: FIRST TEAM REAL ESTATE $739,000Active2 beds 2 baths1,002 sq. ft.
17191 Corbina, Huntington Beach, CA 92649
MLS# PW26098682Listed by: COMPASS $419,000Active1 beds 1 baths754 sq. ft.
6600 Warner #121, Huntington Beach, CA 92647
MLS# OC26097452Listed by: SAIL PROPERTIES, INC.- Open Sat, 1 to 3pm
 $699,000Active2 beds 2 baths1,009 sq. ft.
8933 Biscayne Court #220B, Huntington Beach, CA 92646
MLS# PW26094679Listed by: LIFETIME REALTY INC  $449,000Active1 beds 1 baths785 sq. ft.
6600 Warner Avenue #171, Huntington Beach, CA 92647
MLS# OC26094329Listed by: COMPASS $1,149,000Active2 beds 2 baths1,389 sq. ft.
16962 Agate Circle, Huntington Beach, CA 92649
MLS# 26829265Listed by: JEFFREY ALAN HILL, BROKER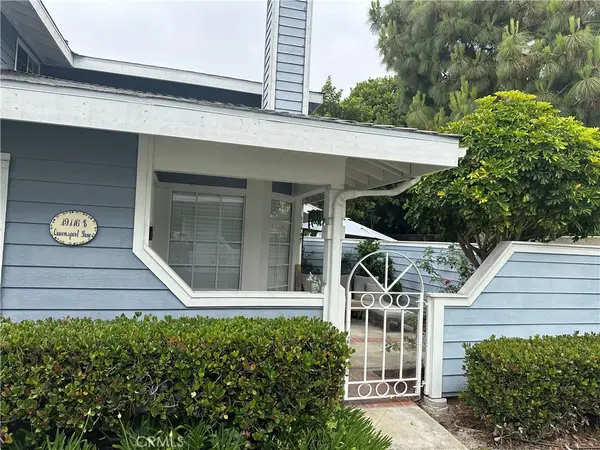 $995,000Pending3 beds 3 baths1,846 sq. ft.
19116 Queensport Lane #E, Huntington Beach, CA 92646
MLS# OC26095604Listed by: SEVEN GABLES REAL ESTATE $975,000Active2 beds 2 baths902 sq. ft.
205 13th Street #D, Huntington Beach, CA 92648
MLS# OC26089507Listed by: REAL BROKER $879,000Active2 beds 3 baths1,088 sq. ft.
606 Lake Street #22, Huntington Beach, CA 92648
MLS# OC26089903Listed by: COLDWELL BANKER REALTY- Open Sun, 11am to 2pm
 $795,000Active2 beds 2 baths1,056 sq. ft.
8645 Butte Circle #601E, Huntington Beach, CA 92646
MLS# OC26090881Listed by: DEDICATED PROPERTY MANAGEMENT  $1,150,000Active2 beds 3 baths1,258 sq. ft.
4006 Aladdin, Huntington Beach, CA 92649
MLS# OC26089545Listed by: COLDWELL BANKER-CAMPBELL RLTRS $1,264,900Active3 beds 3 baths1,672 sq. ft.
21038 Poolside Lane #5, Huntington Beach, CA 92648
MLS# PW26092435Listed by: CALIFORNIA REAL ESTATE COMPANY- Open Sun, 1 to 4pm
 $895,000Active3 beds 2 baths2,300 sq. ft.
4252 Lahaina Drive, Huntington Beach, CA 92649
MLS# OC26091443Listed by: GERALD T HENBERGER, BROKER  $878,999Pending2 beds 2 baths1,225 sq. ft.
19442 Sunray Ln #103, Huntington Beach, CA 92648
MLS# OC26090638Listed by: FIRST TEAM REAL ESTATE $765,000Active3 beds 2 baths1,094 sq. ft.
19752 Bromley Lane #9, Huntington Beach, CA 92646
MLS# OC26092628Listed by: SEVEN GABLES REAL ESTATE- Open Sat, 1 to 4pm
 $1,199,000Active2 beds 2 baths1,100 sq. ft.
1200 Pacific Coast Highway #209, Huntington Beach, CA 92648
MLS# OC26091992Listed by: COLDWELL BANKER REALTY  $575,000Active2 beds 1 baths837 sq. ft.
16436 Poco Circle, Huntington Beach, CA 92649
MLS# OC26092028Listed by: 1% LISTING BROKER $640,000Active2 beds 2 baths1,000 sq. ft.
17661 Sergio Circle #CI103, Huntington Beach, CA 92647
MLS# OC26091766Listed by: FIRST TEAM REAL ESTATE- Open Sun, 1 to 4pm
 $895,000Active3 beds 2 baths1,829 sq. ft.
16401 Napili Lane, Huntington Beach, CA 92649
MLS# OC26087503Listed by: GERALD T HENBERGER, BROKER  $575,000Active1 beds 1 baths760 sq. ft.
20251 Cape Coral Lane #101, Huntington Beach, CA 92646
MLS# OC26084661Listed by: THE L3 $629,999Active2 beds 2 baths971 sq. ft.
7851 Southlake #5, Huntington Beach, CA 92647
MLS# PW26089778Listed by: EXP REALTY OF CALIFORNIA INC $1,249,888Active3 beds 2 baths1,412 sq. ft.
4165 Warner Avenue #202, Huntington Beach, CA 92649
MLS# OC26089761Listed by: LAKESIDE FINANCIAL NETWORK INC $529,000Active2 beds 1 baths799 sq. ft.
7837 Arbor Circle #96D, Huntington Beach, CA 92647
MLS# PW26088737Listed by: Y REALTY $1,894,000Active2 beds 3 baths1,661 sq. ft.
414 Main #400, Huntington Beach, CA 92648
MLS# OC26087051Listed by: COMPASS- Open Sun, 1 to 4pm
 $949,000Active1 beds 1 baths781 sq. ft.
1200 Pacific Coast #426, Huntington Beach, CA 92648
MLS# OC26087134Listed by: COLDWELL BANKER REALTY  $619,900Active1 beds 1 baths844 sq. ft.
626 Lake Street #37, Huntington Beach, CA 92648
MLS# OC26087556Listed by: NATIONWIDE CAPITAL GROUP, INC $1,300,000Active2 beds 2 baths1,021 sq. ft.
1400 Pacific Coast #305, Huntington Beach, CA 92648
MLS# OC26087108Listed by: COLDWELL BANKER REALTY $739,999Active4 beds 2 baths1,254 sq. ft.
19861 Keswick, Huntington Beach, CA 92646
MLS# OC26085308Listed by: COLDWELL BANKER REALTY- Open Sat, 1 to 4pm
 $759,900Active2 beds 2 baths1,178 sq. ft.
17172 Abalone #211, Huntington Beach, CA 92649
MLS# OC26083649Listed by: COLDWELL BANKER REALTY  $549,000Active2 beds 1 baths835 sq. ft.
16713 Viewpoint Lane #138B, Huntington Beach, CA 92647
MLS# IG26083116Listed by: LPT REALTY, INC $659,999Active2 beds 2 baths1,055 sq. ft.
8877 Lauderdale Court #210-G, Huntington Beach, CA 92646
MLS# OC26082797Listed by: HUNTINGTON LANDMARK REALTY $799,000Active2 beds 3 baths1,644 sq. ft.
8125 Surfline Dr #A, Huntington Beach, CA 92646
MLS# PW26082659Listed by: RE/MAX SELECT ONE $539,000Pending1 beds 1 baths716 sq. ft.
215 Wichita Ave. #306, Huntington Beach, CA 92648
MLS# CV26083189Listed by: KALEO REAL ESTATE COMPANY $769,900Pending2 beds 2 baths1,091 sq. ft.
8566 Fallbrook Cir, 706-b, Huntington Beach, CA 92646
MLS# OC26082790Listed by: HUNTINGTON LANDMARK REALTY- Open Sat, 1 to 4pm
 $899,000Active2 beds 2 baths1,118 sq. ft.
400 Lake #105, Huntington Beach, CA 92648
MLS# OC26081057Listed by: COMPASS  $675,000Active2 beds 2 baths881 sq. ft.
4782 Tiara Dr. #104, Huntington Beach, CA 92649
MLS# OC26080644Listed by: SEVEN GABLES REAL ESTATE $589,000Pending3 beds 2 baths1,272 sq. ft.
16521 Grunion Lane #206, Huntington Beach, CA 92649
MLS# PW26079904Listed by: VISTA SOTHEBY'S INT'L REALTY $450,000Active1 beds 1 baths754 sq. ft.
6600 Warner #205, Huntington Beach, CA 92647
MLS# PW26080132Listed by: REDPOINT REALTY- Open Sat, 1 to 4pm
 $1,299,000Active3 beds 2 baths1,386 sq. ft.
7195 Little Harbor, Huntington Beach, CA 92648
MLS# OC26078103Listed by: COMPASS  $1,015,000Active3 beds 2 baths1,287 sq. ft.
8933 Amador Circle #1316e, Huntington Beach, CA 92646
MLS# DW26077023Listed by: 24 HOUR REAL ESTATE $650,000Active2 beds 2 baths1,064 sq. ft.
19152 Shoreline #7, Huntington Beach, CA 92648
MLS# NP26077961Listed by: SURTERRE PROPERTIES INC. $1,950,000Active4 beds 3 baths2,057 sq. ft.
3612 Windspun, Huntington Beach, CA 92649
MLS# OC26072661Listed by: SEVEN GABLES REAL ESTATE $599,900Active2 beds 2 baths1,063 sq. ft.
8566 Van Ness Court, Huntington Beach, CA 92646
MLS# OC26075917Listed by: COLDWELL BANKER REALTY- Open Sat, 1 to 4pm
 $710,000Active2 beds 2 baths1,248 sq. ft.
8192 Sandcove #204, Huntington Beach, CA 92646
MLS# OC26074566Listed by: REAL BROKER - Open Sat, 1 to 4pm
 $509,900Active2 beds 2 baths1,110 sq. ft.
6600 Warner #48, Huntington Beach, CA 92647
MLS# OC26075843Listed by: SEVEN GABLES REAL ESTATE  $899,000Pending2 beds 2 baths1,118 sq. ft.
8282 Artista Drive, Huntington Beach, CA 92646
MLS# CROC26061490Listed by: SEVEN GABLES REAL ESTATE $565,000Pending2 beds 1 baths837 sq. ft.
16406 Vista Roma # 115, Huntington Beach, CA 92649
MLS# SW26074403Listed by: REAL BROKERAGE TECHNOLOGIES- Open Sun, 11am to 2pm
 $674,900Active3 beds 2 baths1,166 sq. ft.
409 Utica #C-29, Huntington Beach, CA 92648
MLS# PW26071192Listed by: REALTY ONE GROUP WEST - Open Sat, 12 to 4pm
 $597,000Active1 beds 1 baths761 sq. ft.
5146 Dorado Drive #106, Huntington Beach, CA 92649
MLS# OC26074125Listed by: FIRST TEAM REAL ESTATE - Open Sat, 11:30am to 4pm
 $899,900Active2 beds 2 baths1,315 sq. ft.
1516 Pacific Coast, Huntington Beach, CA 92648
MLS# DW26073565Listed by: BK PLATINUM PROPERTIES  $548,000Active2 beds 2 baths1,056 sq. ft.
8633 Portola Court #17E, Huntington Beach, CA 92646
MLS# OC26073613Listed by: RE/MAX SELECT ONE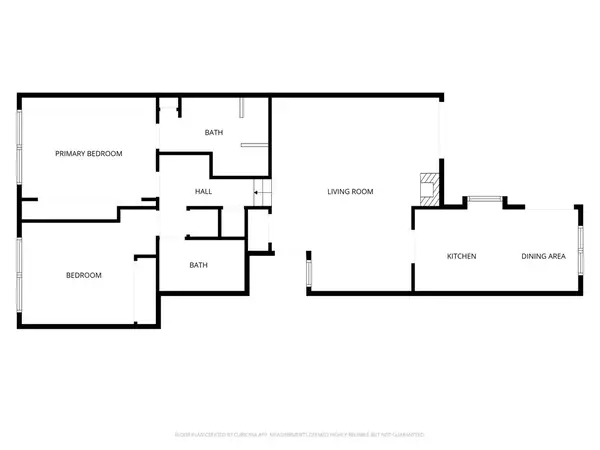 $743,000Active2 beds 2 baths1,104 sq. ft.
8171 Racepoint Drive #104, Huntington Beach, CA 92646
MLS# 26673509Listed by: LOFTWAY $899,000Active2 beds 2 baths1,415 sq. ft.
19401 Sunray Lane #204, Huntington Beach, CA 92648
MLS# OC26071771Listed by: COMPASS $1,050,000Active1 beds 2 baths1,100 sq. ft.
17110 Bluewater Lane, Huntington Beach, CA 92649
MLS# OC26073104Listed by: SEVEN GABLES REAL ESTATE $589,900Active2 beds 2 baths1,056 sq. ft.
8877 Lauderdale Court #209E, Huntington Beach, CA 92646
MLS# OC26072634Listed by: REALTY ONE GROUP WEST $475,000Pending2 beds 2 baths1,166 sq. ft.
4852 Cabana #104, Huntington Beach, CA 92649
MLS# OC26070751Listed by: SEVEN GABLES REAL ESTATE $599,900Pending1 beds 1 baths767 sq. ft.
20301 Bluffside Circle #315, Huntington Beach, CA 92646
MLS# PW26064482Listed by: KELLER WILLIAMS REALTY- Open Sun, 1 to 3pm
 $595,000Active1 beds 1 baths762 sq. ft.
4862 Tiara #204, Huntington Beach, CA 92649
MLS# OC26064110Listed by: THE OC REAL ESTATE  $1,948,000Active2 beds 3 baths1,535 sq. ft.
414 Main St. #410, Huntington Beach, CA 92648
MLS# OC26067089Listed by: COMPASS- Open Sat, 1 to 3:30pm
 $639,000Active2 beds 2 baths1,031 sq. ft.
4581 Warner Avenue #202, Huntington Beach, CA 92649
MLS# OC26061259Listed by: FIRST TEAM REAL ESTATE - Open Sat, 2 to 5pm
 $1,649,999Active2 beds 3 baths2,021 sq. ft.
4167 Warner #105, Huntington Beach, CA 92649
MLS# OC26061072Listed by: SEVEN GABLES REAL ESTATE - Open Sun, 11am to 2pm
 $999,999Active2 beds 2 baths1,146 sq. ft.
16580 Bordeaux, Huntington Beach, CA 92649
MLS# OC26060246Listed by: HUNTINGTON BEACH REALTY INC  $925,000Active2 beds 1 baths1,025 sq. ft.
1200 Pacific Coast Highway #305, Huntington Beach, CA 92648
MLS# CL26665571Listed by: COMPASS $825,000Active2 beds 2 baths1,104 sq. ft.
20321 Tidepool Cir #205, Huntington Beach, CA 92646
MLS# 260006509SDListed by: COLDWELL BANKER WEST $775,000Active2 beds 2 baths1,342 sq. ft.
5142 Warner Ave #209, Huntington Beach, CA 92649
MLS# OC26044411Listed by: SEVEN GABLES REAL ESTATE $648,000Active2 beds 2 baths1,226 sq. ft.
7735 Newman Avenue #104, Huntington Beach, CA 92647
MLS# PW26059176Listed by: STOP REALTY $560,000Active3 beds 2 baths1,272 sq. ft.
4852 Cabana Drive #202, Huntington Beach, CA 92649
MLS# CL26665599Listed by: JOHNHART CORP.- Open Sat, 1 to 4pm
 $979,000Active2 beds 2 baths1,046 sq. ft.
1200 Pacific Coast Highway #106, Huntington Beach, CA 92648
MLS# OC26054536Listed by: COLDWELL BANKER REALTY - Open Sun, 1 to 4pm
 $749,900Active2 beds 3 baths1,065 sq. ft.
8276 Constantine Drive, Huntington Beach, CA 92646
MLS# OC26048040Listed by: SEVEN GABLES REAL ESTATE - Open Sun, 1 to 3pm
 $899,000Active2 beds 2 baths1,046 sq. ft.
1200 Pacific Coast Highway #102, Huntington Beach, CA 92648
MLS# OC26042728Listed by: KELLER WILLIAMS REALTY  $549,000Active2 beds 2 baths867 sq. ft.
409 Utica D34 #D34, Huntington Beach, CA 92648
MLS# OC26040639Listed by: COMPASS $699,999Pending2 beds 2 baths1,031 sq. ft.
4561 Warner #203, Huntington Beach, CA 92649
MLS# OC26041365Listed by: RE/MAX SELECT ONE $680,000Active2 beds 2 baths1,059 sq. ft.
20191 Cape Coral Ln Unit #116, Huntington Beach, CA 92646
MLS# DW26038951Listed by: JOSEPH KIM $685,000Active3 beds 2 baths1,132 sq. ft.
6672 Sun Drive #C, Huntington Beach, CA 92647
MLS# OC26037603Listed by: 1% LISTING BROKER $1,875,000Active2 beds 3 baths1,396 sq. ft.
1314 Pacific Coast Highway #A, Huntington Beach, CA 92648
MLS# OC26030519Listed by: THE AGENCY- Open Sat, 1 to 4pm
 $859,000Active3 beds 2 baths1,300 sq. ft.
16912 Sims Lane #103, Huntington Beach, CA 92649
MLS# PW26029747Listed by: KELLER WILLIAMS PACIFIC ESTATE  $789,500Active2 beds 2 baths1,248 sq. ft.
8132 Atwater Circle #202, Huntington Beach, CA 92646
MLS# SR26033623Listed by: CENTURY 21 HOLLYWOOD $678,000Active2 beds 2 baths1,032 sq. ft.
8777 Coral Springs Court #8C, Huntington Beach, CA 92646
MLS# OC26006742Listed by: RE/MAX SELECT ONE $549,900Active2 beds 1 baths835 sq. ft.
16673 Arbor, Huntington Beach, CA 92647
MLS# OC26015130Listed by: CHOICE SERVICES GROUP, INC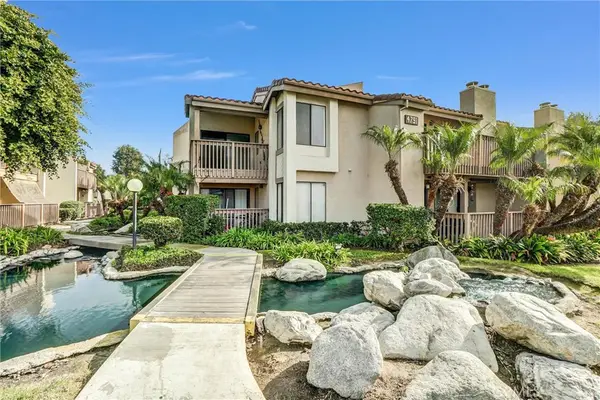 $525,500Active2 beds 2 baths1,272 sq. ft.
4791 Lago Drive #200, Huntington Beach, CA 92649
MLS# MB26002948Listed by: HOPE REALTY WHITTIER $1,589,000Active2 beds 3 baths1,661 sq. ft.
414 Main St #300, Huntington Beach, CA 92648
MLS# PW25276013Listed by: EXP REALTY OF CALIFORNIA INC $669,000Active2 beds 2 baths1,032 sq. ft.
8777 Coral Springs Court #2B, Huntington Beach, CA 92646
MLS# OC25273566Listed by: RE/MAX SELECT ONE $620,000Pending2 beds 2 baths1,110 sq. ft.
4731 Rey Drive #133, Huntington Beach, CA 92649
MLS# OC25265062Listed by: SAXTON REALTY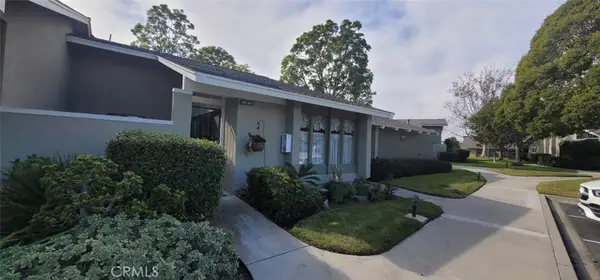 $755,000Pending2 beds 2 baths1,072 sq. ft.
8766 Tulare Drive #405B, Huntington Beach, CA 92646
MLS# OC25260349Listed by: RE/MAX SELECT ONE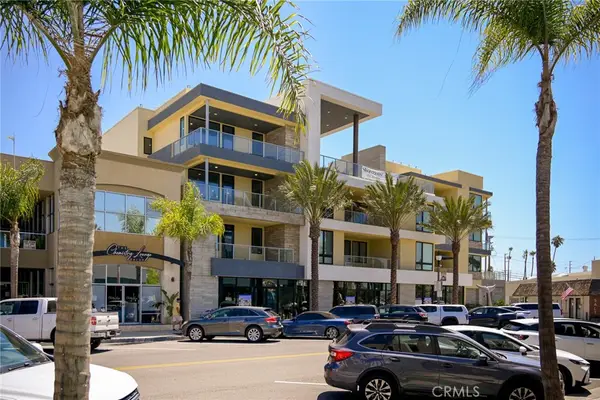 $1,325,000Active2 beds 3 baths1,535 sq. ft.
414 Main St. #310, Huntington Beach, CA 92648
MLS# OC26056175Listed by: COMPASS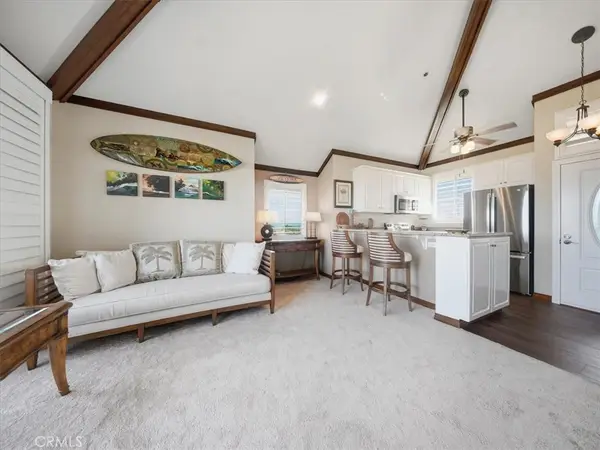 $549,000Active-- beds 1 baths600 sq. ft.
20331 Bluffside Circle #A411, Huntington Beach, CA 92646
MLS# OC25238615Listed by: LUXRE REALTY, INC. $1,395,000Active2 beds 2 baths968 sq. ft.
711 Pacific Coast Highway #206, Huntington Beach, CA 92648
MLS# 219136711DAListed by: EQUITY UNION $469,000Pending2 beds 2 baths1,166 sq. ft.
16551 Grunion Lane #304, Huntington Beach, CA 92649
MLS# CRPW25195240Listed by: LEGENDS REALTY $808,800Pending2 beds 2 baths1,056 sq. ft.
8565 Larkhall Circle #804 A, Huntington Beach, CA 92646
MLS# CRSR25235456Listed by: KELLER WILLIAMS ENCINO/SHERMAN OAKS $459,900Pending2 beds 2 baths1,166 sq. ft.
16581 Grunion Lane #204, Huntington Beach, CA 92649
MLS# PW26047590Listed by: COLDWELL BANKER REALTY $1,998,000Active2 beds 3 baths1,793 sq. ft.
414 Main Street #330, Huntington Beach, CA 92648
MLS# OC25199384Listed by: COMPASS $785,000Pending2 beds 2 baths1,056 sq. ft.
8756 Marin Circle #512B, Huntington Beach, CA 92646
MLS# CROC25197624Listed by: REALTY ONE GROUP WEST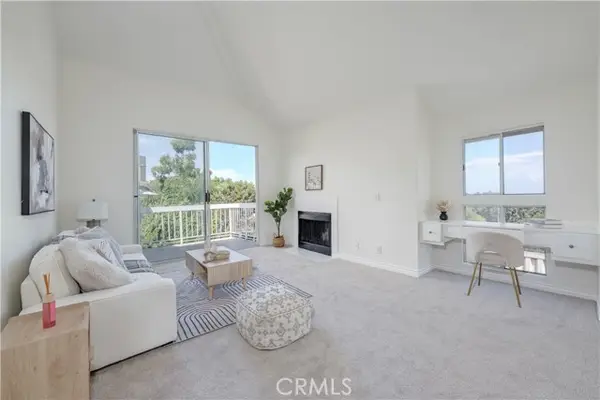 $525,000Pending1 beds 1 baths760 sq. ft.
20251 Cape Coral Lane #301, Huntington Beach, CA 92646
MLS# CROC25134487Listed by: KELLER WILLIAMS REALTY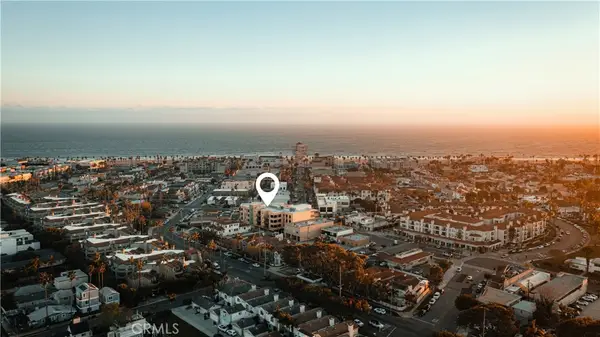 $1,988,000Active2 beds 2 baths1,618 sq. ft.
414 Main Street #420, Huntington Beach, CA 92648
MLS# OC25186260Listed by: COMPASS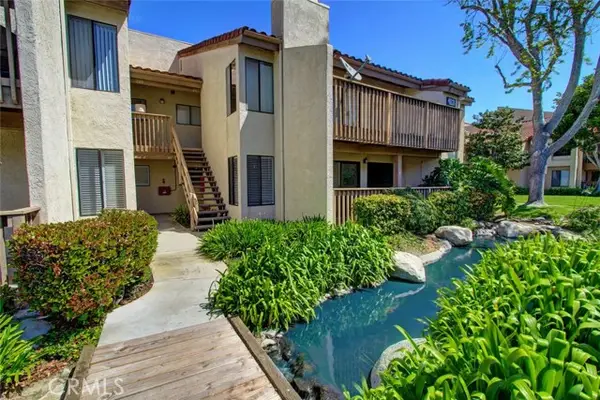 $469,000Pending3 beds 2 baths1,272 sq. ft.
4831 Lago Drive #107, Huntington Beach, CA 92649
MLS# CROC24082105Listed by: SEVEN GABLES REAL ESTATE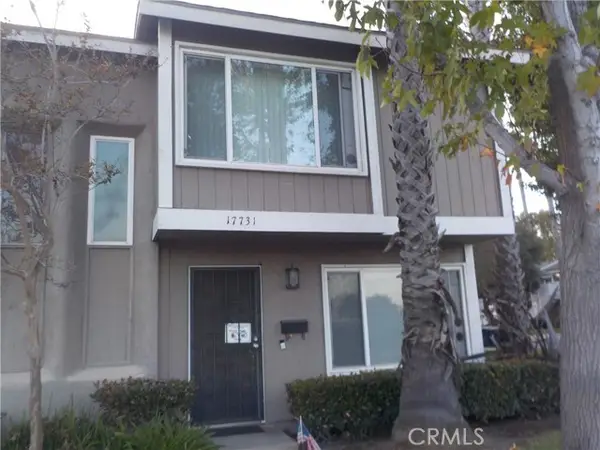 $612,000Pending3 beds 2 baths1,048 sq. ft.
17731 Newland Street #23, Huntington Beach, CA 92647
MLS# CROC24056381Listed by: REALTY ONE GROUP WEST
Local realty services provided by:CENTURY 21 Allstars, CENTURY 21 New Beginnings, CENTURY 21 Wildwood Properties, Inc.
The information being provided by California Regional MLS (Southern California) is for the consumer's personal, non-commercial use and may not be used for any purpose other than to identify prospective properties consumer may be interested in purchasing. Any information relating to real estate for sale referenced on this web site comes from the Internet Data Exchange (IDX) program of the California Regional MLS (Southern California). CENTURY 21 Allstars is not a Multiple Listing Service (MLS), nor does it offer MLS access. This website is a service of CENTURY 21 Allstars, a broker participant of California Regional MLS (Southern California). This web site may reference real estate listing(s) held by a brokerage firm other than the broker and/or agent who owns this web site.
The accuracy of all information, regardless of source, including but not limited to open house information, square footages and lot sizes, is deemed reliable but not guaranteed and should be personally verified through personal inspection by and/or with the appropriate professionals. The data contained herein is copyrighted by California Regional MLS (Southern California) and is protected by all applicable copyright laws. Any unauthorized dissemination of this information is in violation of copyright laws and is strictly prohibited.
Copyright 2021 California Regional MLS (Southern California). All rights reserved. CRMLS Member Broker: Joseph Villaescusa
Copyright 2026 Midwest Real Estate Data LLC. All rights reserved. The data relating to real estate for sale on this web site comes in part from the Broker Reciprocity Program of the Midwest Real Estate Data LLC. Listing information is deemed reliable but not guaranteed. MLSNI Member Broker: Vivian Galarza
Neighborhoods near Huntington Beach, CA
Zip codes near Huntington Beach, CA
- 90680 homes for sale
- 90740 homes for sale
- 90742 homes for sale
- 90743 homes for sale
- 92626 homes for sale
- 92627 homes for sale
- 92646 homes for sale
- 92647 homes for sale
- 92648 homes for sale
- 92649 homes for sale
- 92655 homes for sale
- 92663 homes for sale
- 92683 homes for sale
- 92703 homes for sale
- 92704 homes for sale
- 92708 homes for sale
- 92841 homes for sale
- 92843 homes for sale
- 92844 homes for sale
- 92845 homes for sale
Popular searches near Huntington Beach, CA
- Anaheim homes for sale
- Buena Park homes for sale
- Central Coast homes for sale
- Corona Del Mar homes for sale
- Costa Mesa homes for sale
- Cypress homes for sale
- Fountain Valley homes for sale
- Garden Grove homes for sale
- Hawaiian Gardens homes for sale
- Los Alamitos homes for sale
- Midway City homes for sale
- Newport Beach homes for sale
- North Coast homes for sale
- Rossmoor homes for sale
- Santa Ana homes for sale
- Seal Beach homes for sale
- Stanton homes for sale
- Sunset Beach homes for sale
- Surfside homes for sale
- Westminster homes for sale
Protect your home and budget from life's surprises with an Assurant Home Warranty, backed by a partner that supports you through every step of homeownership. Explore Plans.
©2026 Century 21 Real Estate LLC. All rights reserved. CENTURY 21®, the CENTURY 21 Logo and C21® are service marks owned by Century 21 Real Estate LLC. Century 21 Real Estate LLC fully supports the principles of the Fair Housing Act and the Equal Opportunity Act. Each office is independently owned and operated. Listing information is deemed reliable but not guaranteed accurate.