- Beacon Park, Irvine homes for sale
- Colony Club, Irvine homes for sale
- Cypress Village, Irvine homes for sale
- Deerfield, Irvine homes for sale
- Eastwood Village, Irvine homes for sale
- El Camino Real, Irvine homes for sale
- Great Park Neighborhoods, Irvine homes for sale
- Harvard Square, Irvine homes for sale
- Northwood, Irvine homes for sale
- Novel Park, Irvine homes for sale
- Oak Creek, Irvine homes for sale
- Orangetree, Irvine homes for sale
- Parasol Park, Irvine homes for sale
- Quail Hill, Irvine homes for sale
- Stonegate, Irvine homes for sale
- Tustin Field, Tustin homes for sale
- Walnut, Irvine homes for sale
- Woodbridge, Irvine homes for sale
- Woodbury, Irvine homes for sale
- Woodbury East, Irvine homes for sale
Irvine, CA - homes for sale
72 of 72 results displayed
- New
 $1,650,000Active3 beds 3 baths2,311 sq. ft.
120 Zawn, Irvine, CA 92618
MLS# CV26122853Listed by: ELEVATE REAL ESTATE AGENCY - New
 $1,688,000Active4 beds 3 baths2,791 sq. ft.
303 Baluster, Irvine, CA 92618
MLS# OC26122445Listed by: PINNACLE REAL ESTATE GROUP - New
 $1,378,000Active3 beds 3 baths1,610 sq. ft.
7 Sunup, Irvine, CA 92603
MLS# WS26117795Listed by: WETRUST REALTY - New
 $1,168,000Active2 beds 3 baths1,531 sq. ft.
49 Montanas Este #23, Irvine, CA 92612
MLS# OC26121670Listed by: EXP REALTY OF CALIFORNIA INC  $1,598,000Active4 beds 3 baths2,233 sq. ft.
56 Lakefront #52, Irvine, CA 92604
MLS# AR26092180Listed by: RE/MAX ELITE REALTY- New
 $1,320,000Active3 beds 3 baths2,038 sq. ft.
90 Renewal, Irvine, CA 92618
MLS# TR26119254Listed by: WETRUST REALTY - New
 $1,068,888Active2 beds 2 baths1,241 sq. ft.
14 Aldergrove #29, Irvine, CA 92604
MLS# OC26114531Listed by: FIRST TEAM REAL ESTATE - New
 $1,290,000Active3 beds 3 baths1,416 sq. ft.
62 Dovetail, Irvine, CA 92603
MLS# OC26114167Listed by: IMPACT - New
 $1,399,000Active3 beds 3 baths1,761 sq. ft.
14 Viejo #75, Irvine, CA 92612
MLS# OC26112119Listed by: HPT REALTY - Coming Soon
 $989,000Coming Soon2 beds 3 baths
115 Neptune, Irvine, CA 92618
MLS# OC26116378Listed by: LUXRE REALTY, INC.  $1,299,000Active2 beds 2 baths1,526 sq. ft.
36 Gingerwood, Irvine, CA 92603
MLS# NP26075703Listed by: COMPASS $1,299,000Active2 beds 2 baths1,526 sq. ft.
36 Gingerwood, Irvine, CA 92603
MLS# NP26075703Listed by: COMPASS $799,000Active2 beds 2 baths890 sq. ft.
387 Deerfield #77, Irvine, CA 92606
MLS# 260012254Listed by: COMPASS $1,095,000Active2 beds 2 baths1,042 sq. ft.
2 Evening Breeze, Irvine, CA 92603
MLS# OC26107827Listed by: COLDWELL BANKER REALTY $1,268,800Active3 beds 3 baths1,792 sq. ft.
49 Spanish Lace, Irvine, CA 92620
MLS# TR26107584Listed by: EASTWEST REALTY $1,225,000Active3 beds 3 baths1,897 sq. ft.
61 Origin, Irvine, CA 92618
MLS# PW26086727Listed by: ELEVATE REAL ESTATE AGENCY $1,225,000Active3 beds 3 baths1,897 sq. ft.
61 Origin, Irvine, CA 92618
MLS# PW26086727Listed by: ELEVATE REAL ESTATE AGENCY $1,349,000Active2 beds 3 baths1,525 sq. ft.
8 Moon Shadow #8, Irvine, CA 92603
MLS# OC26105574Listed by: STEVEN MULDOWNEY, BROKER $1,388,000Active4 beds 3 baths1,523 sq. ft.
56 Bay Layrel, Irvine, CA 92618
MLS# OC26095392Listed by: PINNACLE REAL ESTATE GROUP $869,000Pending2 beds 2 baths1,366 sq. ft.
104 Lakepines, Irvine, CA 92620
MLS# OC26102089Listed by: REAL ESTATE SOURCE, INC- Open Wed, 11am to 1pm
 $989,000Active2 beds 2 baths1,042 sq. ft.
15 Starshine, Irvine, CA 92603
MLS# OC26102611Listed by: RE/MAX CONNECTIONS  $1,348,999Active3 beds 3 baths1,646 sq. ft.
112 Walking Stick, Irvine, CA 92618
MLS# OC26101233Listed by: PINNACLE REALTY ADVISORS $1,170,000Active2 beds 2 baths1,532 sq. ft.
416 Quail Ridge, Irvine, CA 92603
MLS# PW26101131Listed by: HELP-U-SELL BEACHSIDE $865,000Active2 beds 2 baths1,098 sq. ft.
53 Thicket #38, Irvine, CA 92614
MLS# IV26101234Listed by: NATIONAL REALTY GROUP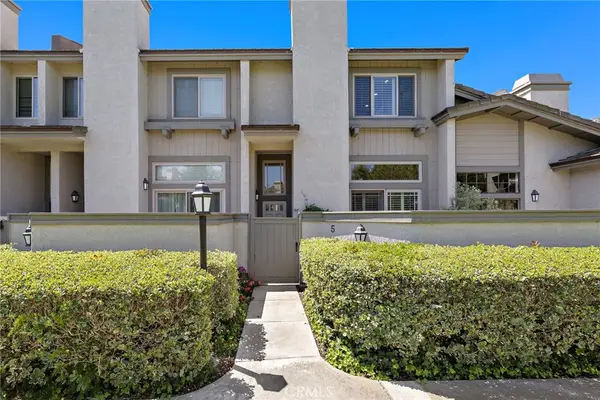 $1,388,000Active2 beds 3 baths1,740 sq. ft.
5 Morningside, Irvine, CA 92603
MLS# OC26100830Listed by: COMPASS $859,000Active2 beds 2 baths1,098 sq. ft.
52 Greenbough, Irvine, CA 92614
MLS# OC26095419Listed by: RE/MAX FINE HOMES $1,079,000Active3 beds 3 baths1,336 sq. ft.
198 Monroe, Irvine, CA 92620
MLS# OC26098543Listed by: KELLER WILLIAMS REALTY IRVINE $1,000,000Active3 beds 3 baths1,878 sq. ft.
19 Delancy, Irvine, CA 92612
MLS# PW26096263Listed by: ERA NORTH ORANGE COUNTY $1,695,000Active3 beds 4 baths2,318 sq. ft.
108 Rockefeller, Irvine, CA 92612
MLS# OC26095178Listed by: LINOUR GROUP $1,695,000Active3 beds 4 baths2,140 sq. ft.
222 Ashby, Irvine, CA 92618
MLS# OC26092442Listed by: MF REALTY $1,320,000Active3 beds 3 baths1,773 sq. ft.
71 Nature, Irvine, CA 92620
MLS# OC26094122Listed by: HARVEST REALTY DEVELOPMENT $595,000Active1 beds 1 baths934 sq. ft.
204 Pineview, Irvine, CA 92620
MLS# OC26082879Listed by: FIRST TEAM REAL ESTATE $1,190,000Active3 beds 4 baths2,017 sq. ft.
179 Cadence, Irvine, CA 92618
MLS# TR26090141Listed by: EASTWEST REALTY $639,900Active1 beds 2 baths1,115 sq. ft.
26 Lakepines, Irvine, CA 92620
MLS# OC26089011Listed by: COLDWELL BANKER REALTY $1,299,000Active4 beds 4 baths2,356 sq. ft.
346 Tank, Irvine, CA 92618
MLS# OC26073769Listed by: TOGETHER REALTY $1,619,000Active3 beds 3 baths1,948 sq. ft.
64 Maple Ash, Irvine, CA 92620
MLS# PW26065192Listed by: PANAMERICAN MORTGAGE $1,619,000Active3 beds 3 baths1,948 sq. ft.
64 Maple Ash, Irvine, CA 92620
MLS# PW26065192Listed by: PANAMERICAN MORTGAGE $1,264,000Pending3 beds 3 baths1,433 sq. ft.
49 Winterhaven, Irvine, CA 92614
MLS# PW26075839Listed by: HOMESMART REALTY GROUP $1,264,000Pending3 beds 3 baths1,433 sq. ft.
49 Winterhaven, Irvine, CA 92614
MLS# PW26075839Listed by: HOMESMART REALTY GROUP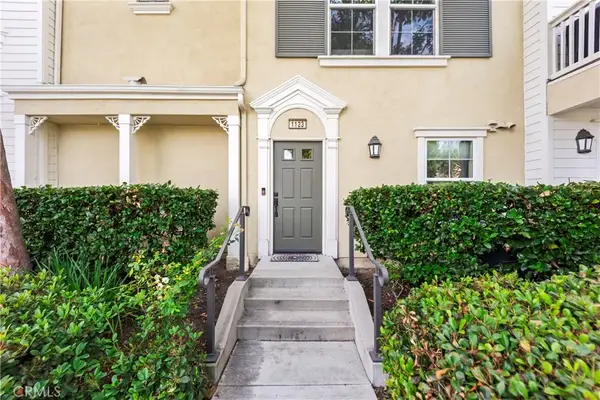 $1,095,000Active3 beds 4 baths1,669 sq. ft.
1123 Abelia, Irvine, CA 92606
MLS# OC26078786Listed by: NOEL DURITY, BROKER $1,099,000Active3 beds 3 baths2,038 sq. ft.
103 Plateau, Irvine, CA 92618
MLS# OC26078035Listed by: ROBERT SCHAEFER $1,100,000Active2 beds 2 baths1,282 sq. ft.
18 Navarre #133, Irvine, CA 92612
MLS# OC26078123Listed by: LATITUDE 33 REAL ESTATE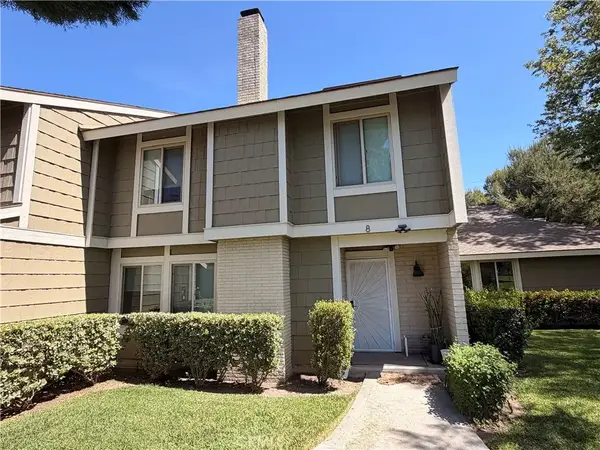 $1,200,000Active4 beds 3 baths1,642 sq. ft.
8 Deodar, Irvine, CA 92604
MLS# OC26075295Listed by: HARVEST REALTY DEVELOPMENT $999,900Active3 beds 3 baths1,633 sq. ft.
25 Cheyenne, Irvine, CA 92604
MLS# PW26072071Listed by: ERA NORTH ORANGE COUNTY $957,800Active2 beds 2 baths1,227 sq. ft.
41 Fallingstar #28, Irvine, CA 92614
MLS# TR26072645Listed by: HOMECOIN.COM $1,499,000Active3 beds 3 baths1,654 sq. ft.
121 Baritone, Irvine, CA 92620
MLS# OC26072962Listed by: COLDWELL BANKER PLATINUM PROP $1,249,000Active3 beds 3 baths1,873 sq. ft.
27 Soho, Irvine, CA 92612
MLS# PW26070308Listed by: MIKE CHEHAYEB, BROKER $1,249,880Active3 beds 2 baths1,915 sq. ft.
617 Rockefeller, Irvine, CA 92612
MLS# OC26070969Listed by: IRVINE HOME LOAN, INC. $1,260,000Active3 beds 4 baths2,031 sq. ft.
312 Tank, Irvine, CA 92618
MLS# OC26070424Listed by: REAL BROKER $1,123,000Active2 beds 3 baths1,500 sq. ft.
30 Burlingame, Irvine, CA 92602
MLS# PW26065244Listed by: KELLER WILLIAMS REALTY IRVINE $1,685,000Active3 beds 3 baths2,192 sq. ft.
121 Baluster, Irvine, CA 92618
MLS# OC26049936Listed by: COLDWELL BANKER PLATINUM PROP $1,030,000Active2 beds 2 baths1,318 sq. ft.
114 Borrego, Irvine, CA 92618
MLS# OC26050644Listed by: RE/MAX PROPERTY CONNECTION $1,258,000Active2 beds 3 baths1,960 sq. ft.
555 Rockefeller, Irvine, CA 92612
MLS# NP26068394Listed by: CONDOS ETC, INC $1,730,000Active3 beds 3 baths1,777 sq. ft.
167 Overbrook, Irvine, CA 92620
MLS# OC26067997Listed by: IRN REALTY $1,348,000Active3 beds 2 baths1,658 sq. ft.
191 Frame, Irvine, CA 92618
MLS# AR26063383Listed by: HARVEST REALTY DEVELOPMENT $1,123,000Active2 beds 3 baths1,500 sq. ft.
30 Burlingame, Irvine, CA 92602
MLS# PW26065244Listed by: KELLER WILLIAMS REALTY IRVINE $1,079,000Active3 beds 3 baths1,666 sq. ft.
117 Silverado, Irvine, CA 92618
MLS# SW26057955Listed by: THE LADERA GROUP $1,575,000Active2 beds 2 baths1,947 sq. ft.
30 Waterway #43, Irvine, CA 92614
MLS# OC26056675Listed by: COLDWELL BANKER REALTY $1,030,000Active2 beds 2 baths1,318 sq. ft.
114 Borrego, Irvine, CA 92618
MLS# OC26050644Listed by: RE/MAX PROPERTY CONNECTION $1,685,000Active3 beds 3 baths2,192 sq. ft.
121 Baluster, Irvine, CA 92618
MLS# OC26049936Listed by: COLDWELL BANKER PLATINUM PROP $1,248,000Pending2 beds 3 baths1,468 sq. ft.
24 Maycrest, Irvine, CA 92618
MLS# OC26046126Listed by: HARVEST REALTY DEVELOPMENT $1,049,000Pending2 beds 2 baths1,090 sq. ft.
8 Evening Breeze, Irvine, CA 92603
MLS# OC26037836Listed by: COLDWELL BANKER REALTY $1,499,000Active3 beds 3 baths1,987 sq. ft.
97 Rinaldi, Irvine, CA 92620
MLS# PW26041535Listed by: SEVEN GABLES REAL ESTATE $799,000Pending2 beds 2 baths1,204 sq. ft.
196 Pineview, Irvine, CA 92620
MLS# OC26040243Listed by: JC PACIFIC CORP $1,575,000Active3 beds 3 baths2,100 sq. ft.
30 Arboles #34, Irvine, CA 92612
MLS# OC26031215Listed by: REALTY ONE GROUP WEST $1,698,000Active3 beds 3 baths1,740 sq. ft.
10 Starfall #11, Irvine, CA 92603
MLS# PW26027734Listed by: REAL ESTATE LEGENDS USA $1,110,000Active3 beds 3 baths1,601 sq. ft.
9 Bonsall, Irvine, CA 92602
MLS# PW26027619Listed by: UNITI REALTY $1,249,900Active3 beds 3 baths1,878 sq. ft.
25 Delancy, Irvine, CA 92612
MLS# 25626533Listed by: PROPNATION, INC. $2,138,800Active4 beds 3 baths2,281 sq. ft.
11 Thunder Trail #6, Irvine, CA 92614
MLS# PW26040957Listed by: SEVEN GABLES REAL ESTATE $1,190,000Pending3 beds 4 baths1,805 sq. ft.
114 Epic, Irvine, CA 92618
MLS# CROC25136530Listed by: ANVIL REAL ESTATE $1,328,800Pending3 beds 4 baths1,991 sq. ft.
113 Placemark, Irvine, CA 92614
MLS# CRNP25006767Listed by: EXP REALTY OF SOUTHERN CA, INC $580,000Pending2 beds 3 baths1,354 sq. ft.
165 Neptune, Irvine, CA 92618
MLS# OC21020542Listed by: REALTY ONE GROUP WEST
Local realty services provided by:CENTURY 21 LOTUS, CENTURY 21 Masters, CENTURY 21 Sierra Properties
The information being provided by California Regional MLS (Southern California) is for the consumer's personal, non-commercial use and may not be used for any purpose other than to identify prospective properties consumer may be interested in purchasing. Any information relating to real estate for sale referenced on this web site comes from the Internet Data Exchange (IDX) program of the California Regional MLS (Southern California). CENTURY 21 LOTUS is not a Multiple Listing Service (MLS), nor does it offer MLS access. This website is a service of CENTURY 21 LOTUS, a broker participant of California Regional MLS (Southern California). This web site may reference real estate listing(s) held by a brokerage firm other than the broker and/or agent who owns this web site.
The accuracy of all information, regardless of source, including but not limited to open house information, square footages and lot sizes, is deemed reliable but not guaranteed and should be personally verified through personal inspection by and/or with the appropriate professionals. The data contained herein is copyrighted by California Regional MLS (Southern California) and is protected by all applicable copyright laws. Any unauthorized dissemination of this information is in violation of copyright laws and is strictly prohibited.
Copyright 2021 California Regional MLS (Southern California). All rights reserved.
This information is deemed reliable but not guaranteed. You should rely on this information only to decide whether or not to further investigate a particular property. BEFORE MAKING ANY OTHER DECISION, YOU SHOULD PERSONALLY INVESTIGATE THE FACTS (e.g. square footage and lot size) with the assistance of an appropriate professional. You may use this information only to identify properties you may be interested in investigating further. All uses except for personal, non-commercial use in accordance with the foregoing purpose are prohibited. Redistribution or copying of this information, any photographs or video tours is strictly prohibited. This information is derived from the Internet Data Exchange (IDX) service provided by San Diego MLS®. Displayed property listings may be held by a brokerage firm other than the broker and/or agent responsible for this display. The information and any photographs and video tours and the compilation from which they are derived is protected by copyright. Compilation © 2020 San Diego MLS®, Inc. SANDICOR Member Broker: Randy Thompson
Neighborhoods near Irvine, CA
Zip codes near Irvine, CA
- 92602 homes for sale
- 92603 homes for sale
- 92604 homes for sale
- 92606 homes for sale
- 92610 homes for sale
- 92612 homes for sale
- 92614 homes for sale
- 92618 homes for sale
- 92620 homes for sale
- 92626 homes for sale
- 92630 homes for sale
- 92637 homes for sale
- 92657 homes for sale
- 92660 homes for sale
- 92701 homes for sale
- 92705 homes for sale
- 92707 homes for sale
- 92780 homes for sale
- 92782 homes for sale
- 92869 homes for sale
Popular searches near Irvine, CA
- Aliso Viejo homes for sale
- Central Coast homes for sale
- Corona Del Mar homes for sale
- Costa Mesa homes for sale
- Foothill Ranch homes for sale
- Irvine-Lake Forest homes for sale
- Laguna Beach homes for sale
- Laguna Hills homes for sale
- Laguna Woods homes for sale
- Lake Forest homes for sale
- Mission Viejo homes for sale
- Newport Beach homes for sale
- Newport Coast homes for sale
- North Tustin homes for sale
- Orange homes for sale
- Santa Ana homes for sale
- Silverado homes for sale
- Tustin homes for sale
- Villa Park homes for sale
- Williams Canyon homes for sale
Protect your home and budget from life's surprises with an Assurant Home Warranty, backed by a partner that supports you through every step of homeownership. Explore Plans.
©2026 Century 21 Real Estate LLC. All rights reserved. CENTURY 21®, the CENTURY 21 Logo and C21® are service marks owned by Century 21 Real Estate LLC. Century 21 Real Estate LLC fully supports the principles of the Fair Housing Act and the Equal Opportunity Act. Each office is independently owned and operated. Listing information is deemed reliable but not guaranteed accurate.