- Abilene homes for sale
- Anson homes for sale
- Avoca homes for sale
- Dyess Afb homes for sale
- Hamlin homes for sale
- Haskell homes for sale
- Hawley homes for sale
- Hawley-Noodle homes for sale
- Lueders homes for sale
- McCaulley homes for sale
- Merkel homes for sale
- Potosi homes for sale
- Roby homes for sale
- Rule homes for sale
- Sagerton homes for sale
- Stamford homes for sale
- Stamford homes for sale
- Sylvester homes for sale
- Trent homes for sale
- Tye homes for sale
Jones County, TX - homes for sale
115 of 115 results displayed
- New
 $115,000Active15 Acres
TBD Cr 356, Anson, TX 79501
MLS# 21295924Listed by: RED FARM REALTY LLC - New
 $99,500Active13.4 Acres
TBD Pr 4082, Abilene, TX 79601
MLS# 21294718Listed by: EKDAHL REAL ESTATE STAMFORD - New
 $145,000Active26 Acres
13450 County Road 440, Merkel, TX 79536
MLS# 21291193Listed by: EKDAHL REAL ESTATE STAMFORD - New
 $275,000Active20.32 Acres
10818 County Road 335, Hawley, TX 79525
MLS# 21259979Listed by: BERKSHIRE HATHAWAY HS STOVALL  $85,000Pending1.52 Acres
270 Blackfoot Road, Abilene, TX 79601
MLS# 21220358Listed by: REAL BROKER, LLC.- New
 $35,000Active0.8 Acres
TBD Avenue I, Anson, TX 79501
MLS# 21289548Listed by: EKDAHL REAL ESTATE STAMFORD  $180,000Active12 Acres
Tbd FM 2404, Hawley, TX 79525
MLS# 21286721Listed by: EKDAHL REAL ESTATE STAMFORD $60,000Active4 Acres
Lot 2 FM 2404, Hawley, TX 79525
MLS# 21286709Listed by: EKDAHL REAL ESTATE STAMFORD $60,000Active4 Acres
Lot 3 FM 2404, Hawley, TX 79525
MLS# 21286712Listed by: EKDAHL REAL ESTATE STAMFORD $2,500,000Active117.52 Acres
2990 County Road 205, Lueders, TX 79533
MLS# 21281509Listed by: RED FARM REALTY LLC $204,225Active19.45 Acres
TBD (East Tract) County Road 356, Anson, TX 79501
MLS# 21277686Listed by: ACR-ANN CARR REALTORS $157,500Active15 Acres
TBD (WEST TRACT) County Road 356, Anson, TX 79501
MLS# 21277748Listed by: ACR-ANN CARR REALTORS $60,000Active4 Acres
Lot 1 Fm 2404, Hawley, TX 79525
MLS# 21277400Listed by: EKDAHL REAL ESTATE STAMFORD $12,500Active0.41 Acres
2202 Avenue N, Anson, TX 79501
MLS# 21275605Listed by: EKDAHL REAL ESTATE STAMFORD $135,000Pending10 Acres
5428 Cr 364, Anson, TX 79501
MLS# 21272075Listed by: BERKSHIRE HATHAWAY HS STOVALL $89,900Pending10.01 Acres
TBD Tract 6 Fm 3116, Hawley, TX 79525
MLS# 21257325Listed by: RED FARM REALTY LLC $89,900Active10.01 Acres
TBD Tract 9 Fm 1812, Hawley, TX 79525
MLS# 21270327Listed by: RED FARM REALTY LLC $89,900Active10.01 Acres
TBD Tract 10 Fm 1812, Hawley, TX 79525
MLS# 21270369Listed by: RED FARM REALTY LLC $89,900Active10.01 Acres
TBD Tract 1 Fm 3116, Hawley, TX 79525
MLS# 21269869Listed by: RED FARM REALTY LLC $89,900Active10.01 Acres
TBD Tract 4 Fm 3116, Hawley, TX 79525
MLS# 21270267Listed by: RED FARM REALTY LLC $89,900Active10.01 Acres
TBD Tract 8 Fm 1812, Hawley, TX 79525
MLS# 21270302Listed by: RED FARM REALTY LLC $50,000Pending1.83 Acres
15900 Fm 2404, Hawley, TX 79525
MLS# 21195126Listed by: REAL BROKER, LLC.- $12,000Active0.17 Acres
818 W Bunkley, Stamford, TX 79553
MLS# 21265424Listed by: EXP REALTY, LLC  $22,000Pending1 Acres
2367 Us Highway 277 N, Anson, TX 79501
MLS# 21263903Listed by: ABILENE GROUP PREMIER RE. ADV. $175,000Active20.73 Acres
TBD Fm 3368, Hawley, TX 79525
MLS# 21260275Listed by: REAL BROKER $65,000Active11.6 Acres
1-5 Ave Q Avenue, Anson, TX 79501
MLS# 21260175Listed by: EKDAHL-NELSON REAL ESTATE $114,800Active14 Acres
TBD Fm126( Tract 2 ) Merkel, Tx 79536, Merkel, TX 79536
MLS# 21254875Listed by: TRINITY RANCH LAND ABILENE $103,320Active12.6 Acres
TBD Fm 126 ( Tract 3 ) Merkel, Tx 79536, Merkel, TX 79536
MLS# 21254899Listed by: TRINITY RANCH LAND ABILENE $123,000Active15 Acres
TBD Fm 1812 ( Tract 1 ), Merkel, TX 79536
MLS# 21248935Listed by: TRINITY RANCH LAND ABILENE $98,400Active12 Acres
TBD Fm 1812 ( Tract 2 ), Merkel, TX 79536
MLS# 21249076Listed by: TRINITY RANCH LAND ABILENE $98,400Active12 Acres
TBD Fm 1812 (lot 3), Merkel, TX 79536
MLS# 21249360Listed by: TRINITY RANCH LAND ABILENE $882,240Active220.56 Acres
TBD Cr 429, Merkel, TX 79536
MLS# 21249167Listed by: COLDWELL BANKER APEX, REALTORS $265,000Active25 Acres
7498 Private Road 391, Hawley, TX 79525
MLS# 21209199Listed by: RE/MAX BIG COUNTRY $2,150,000Active75 Acres
TBD Us Hwy 277, Hawley, TX 79525
MLS# 21239850Listed by: RED FARM REALTY LLC $184,815Active37 Acres
tract 3 Cr 463, Anson, TX 79501
MLS# 21237390Listed by: EKDAHL REAL ESTATE STAMFORD $39,900Pending2 Acres
Lot 30 Tbd Cr 461, Hawley, TX 79525
MLS# 21150065Listed by: RED FARM REALTY LLC $26,500Pending1 Acres
Lot 13 Tbd Pr461, Hawley, TX 79525
MLS# 21172894Listed by: RED FARM REALTY LLC $26,500Pending1 Acres
Lot 12 Tbd Pr 461, Hawley, TX 79525
MLS# 21193344Listed by: RED FARM REALTY LLC $39,900Active2 Acres
Lot 26 Tbd Pr 461, Hawley, TX 79525
MLS# 21235528Listed by: RED FARM REALTY LLC $39,900Active2 Acres
Lot 27 Tbd Pr 461, Hawley, TX 79525
MLS# 21235546Listed by: RED FARM REALTY LLC $39,900Active2 Acres
Lot 28 Tbd Pr 461, Hawley, TX 79525
MLS# 21235570Listed by: RED FARM REALTY LLC $39,900Active2 Acres
Lot 23 Tbd Pr 461, Hawley, TX 79525
MLS# 21235405Listed by: RED FARM REALTY LLC $39,900Active2 Acres
Lot 25 Tbd Pr 461, Hawley, TX 79525
MLS# 21235494Listed by: RED FARM REALTY LLC $395,483Active50.38 Acres
TBD Cr 383, Hawley, TX 79525
MLS# 21223490Listed by: EPIQUE REALTY LLC $89,900Pending10.01 Acres
Tract 1 TBD Pvt Rd 3561, Anson, TX 79501
MLS# 21223952Listed by: RED FARM REALTY LLC $558,900Active186.3 Acres
T B D County Road 260, Avoca, TX 79503
MLS# 21222690Listed by: EKDAHL REAL ESTATE $150,000Active18.95 Acres
4 County Road 463, Anson, TX 79525
MLS# 21222256Listed by: EATON REAL ESTATE COMPANY $301,750Pending11.4 Acres
Lts 1-23 Private Rd. 368, Hawley, TX 79525
MLS# 20431662Listed by: RED FARM REALTY LLC $100,000Active1.06 Acres
852 Comanche Trail Circle, Abilene, TX 79601
MLS# 21220266Listed by: ATKINS REALTY $26,500Pending1 Acres
377 Pr 461, Hawley, TX 79525
MLS# 21200657Listed by: RED FARM REALTY LLC $74,000Active8.76 Acres
12929 County Road 356, Anson, TX 79501
MLS# 21212160Listed by: HATCHETT & CO. REAL ESTATE $504,200Active64.52 Acres
TBD Pr Off Of Cr 444, Merkel, TX 79536
MLS# 21209117Listed by: TRINITY RANCH LAND ABILENE $9,200Active0.21 Acres
1732 Ave N, Anson, TX 79501
MLS# 21208509Listed by: ABSOLUTE REAL ESTATE MGT. $915,000Active61 Acres
2706 County Road 299, Anson, TX 79501
MLS# 21207239Listed by: EKDAHL REAL ESTATE STAMFORD- $45,000Active2.07 Acres
FM 2404 Farm Road #2404, Hawley, TX 79525
MLS# 21193421Listed by: EPIQUE REALTY LLC  $1,500,000Active37.01 Acres
4609 Us Hwy 277 S, Anson, TX 79501
MLS# 21200988Listed by: EKDAHL REAL ESTATE $17,500Active2.32 Acres
TBD Ave Q Avenue, Anson, TX 79501
MLS# 21193645Listed by: EKDAHL-NELSON REAL ESTATE $64,900Pending10.01 Acres
TRACT 8 TBD Cr 415, Merkel, TX 79536
MLS# 21191974Listed by: EKDAHL REAL ESTATE STAMFORD $350,000Active69.5 Acres
TBD Cr 432, Merkel, TX 79536
MLS# 21187093Listed by: COLDWELL BANKER APEX, REALTORS- $589,000Pending154.9 Acres
TBD Cr 453, Merkel, TX 79536
MLS# 21183567Listed by: EKDAHL REAL ESTATE STAMFORD  $9,900Active0.92 Acres
TBD Fm 2702, Stamford, TX 79553
MLS# 21175528Listed by: EPIQUE REALTY LLC $250,000Active40.42 Acres
TBD Private Road 705, Anson, TX 79501
MLS# 21153025Listed by: EKDAHL REAL ESTATE STAMFORD $48,500Pending3.89 Acres
Lot 14 Pr 4284, Hawley, TX 79525
MLS# 21149264Listed by: COLDWELL BANKER APEX, REALTORS $57,500Pending5.07 Acres
TBD Lot 13 Private Road 4284, Hawley, TX 79525
MLS# 21146113Listed by: COLDWELL BANKER APEX, REALTORS $15,000Pending2.2 Acres
TBD Avenue Q Street, Anson, TX 79501
MLS# 21146814Listed by: EKDAHL REAL ESTATE STAMFORD $232,000Active20.22 Acres
LOT 3 Tbd Cr 327, Abilene, TX 79601
MLS# 21127787Listed by: EKDAHL REAL ESTATE STAMFORD $232,000Active20.22 Acres
LOT 1 Tbd Cr 327, Abilene, TX 79601
MLS# 21127788Listed by: EKDAHL REAL ESTATE STAMFORD $50,999Pending3.51 Acres
LOT 11 TBD Private Road 4284, Hawley, TX 79525
MLS# 21137308Listed by: EKDAHL REAL ESTATE STAMFORD $84,900Active10.49 Acres
13654 Cr 433, Merkel, TX 79536
MLS# 21135805Listed by: EPIQUE REALTY LLC $239,000Pending13.23 Acres
5900 W Lake Road, Abilene, TX 79601
MLS# 21127671Listed by: BARNETT & HILL $546,000Pending91 Acres
TBD Fm 600, Anson, TX 79501
MLS# 21119343Listed by: RED FARM REALTY LLC $250,000Pending20 Acres
12014 A S Fm 600, Abilene, TX 79601
MLS# 21115281Listed by: TOMMY SIMONS (OFFICE) $1,425,000Active160 Acres
160 acres TBD County Road 428, Hawley, TX 79525
MLS# 21106380Listed by: HERITAGE CREEK REAL ESTATE LLC $44,999Pending10.05 Acres
0 County Road 452, Merkel, TX 79536
MLS# 21098706Listed by: KAREN DAVIS PROPERTIES $333,340Pending47.62 Acres
6525 Us 180, Anson, TX 79501
MLS# 21088895Listed by: TRINITY RANCH LAND CROSS PLAINS $125,000Active19.2 Acres
000 Cr 432, Merkel, TX 79536
MLS# 21088497Listed by: EKDAHL REAL ESTATE STAMFORD $195,000Pending30 Acres
6525 E 180, Anson, TX 75901
MLS# 21073007Listed by: TRINITY RANCH LAND CROSS PLAINS $23,000Pending1.07 Acres
Lot 14 Private Rd 368, Hawley, TX 79525
MLS# 20491019Listed by: RED FARM REALTY LLC $520,950Active151 Acres
TBD Cr 195, Anson, TX 79501
MLS# 21052209Listed by: EKDAHL REAL ESTATE STAMFORD $180,000Active26.35 Acres
TBD FM 2746, Anson, TX 79501
MLS# 21050287Listed by: EKDAHL REAL ESTATE STAMFORD $149,900Active10.34 Acres
10+ Acres Us Highway 277 S, Hawley, TX 79525
MLS# 21036680Listed by: HCR REALTY LLC $476,000Active34 Acres
Fm 1082, Abilene, TX 79601
MLS# 21019275Listed by: BERKSHIRE HATHAWAYHS PENFED TX $87,750Active10 Acres
tbd Private Lane, Hawley, TX 79525
MLS# 20993527Listed by: EKDAHL-NELSON REAL ESTATE $275,600Pending53 Acres
2104 County Road 354, Anson, TX 79501
MLS# 20920477Listed by: EKDAHL REAL ESTATE STAMFORD $135,000Pending10.86 Acres
TBD County Road 335, Anson, TX 79501
MLS# 20914052Listed by: COLDWELL BANKER APEX, REALTORS $45,000Active2.02 Acres
TBD 15 Pr 316, Hawley, TX 79525
MLS# 20911386Listed by: EKDAHL REAL ESTATE STAMFORD $45,000Active2.03 Acres
TBD Pr 316, Hawley, TX 79525
MLS# 20908501Listed by: EKDAHL REAL ESTATE STAMFORD $475,000Active148.12 Acres
n/a Cr 168, Anson, TX 79501
MLS# 20810680Listed by: BARNETT & HILL $139,000Active20 Acres
TBD Fm 1082 Lane, No City, TX 79525
MLS# 20798101Listed by: EKDAHL-NELSON REAL ESTATE $49,900Active6.73 Acres
TBD Lot 22 County Road 497, Anson, TX 79501
MLS# 20783041Listed by: J.J. HAMPTON REALTY $29,900Active1.83 Acres
TBD Lot 23 County Road 497, Anson, TX 79501
MLS# 20783180Listed by: GILL PROPERTIES $29,900Active2.08 Acres
TBD Lot 24 County Road 497, Anson, TX 79501
MLS# 20783188Listed by: GILL PROPERTIES $49,900Active6.73 Acres
TBD Lot 25 County Road 497, Anson, TX 79501
MLS# 20783194Listed by: GILL PROPERTIES $29,900Active1.96 Acres
TBD Lot 29 County Road 497, Anson, TX 79501
MLS# 20783211Listed by: GILL PROPERTIES $29,900Active1.96 Acres
TBD Lot 30 County Road 497, Anson, TX 79501
MLS# 20783214Listed by: GILL PROPERTIES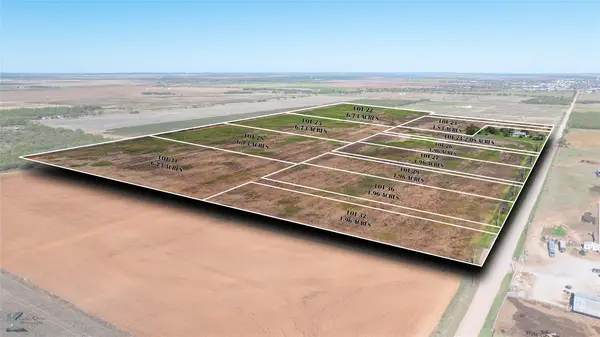 $49,900Active6.73 Acres
TBD Lot 31 County Road 497, Anson, TX 79501
MLS# 20783218Listed by: GILL PROPERTIES $29,900Pending1.96 Acres
TBD Lot 32 County Road 497, Anson, TX 79501
MLS# 20783223Listed by: GILL PROPERTIES $29,900Active1.96 Acres
TBD Lot 26 County Road 497, Anson, TX 79501
MLS# 20783199Listed by: GILL PROPERTIES $29,900Active1.96 Acres
TBD Lot 27 County Road 497, Anson, TX 79501
MLS# 20783202Listed by: GILL PROPERTIES $49,900Active6.73 Acres
TBD Lot 28 County Road 497, Anson, TX 79501
MLS# 20783209Listed by: GILL PROPERTIES $45,000Active1.72 Acres
TBD 19 Pr Circle T, Hawley, TX 79525
MLS# 20708639Listed by: EKDAHL-NELSON REAL ESTATE STAM $160,000Active20 Acres
11653 Fm 1226 Parcel C, Hawley, TX 79525
MLS# 21120725Listed by: KW SYNERGY* $228,900Active11 Acres
TBD Fm 600, Abilene, TX 79601
MLS# 20509730Listed by: RED FARM REALTY LLC $83,900Active12 Acres
TBD 2 Fm 1082, Hawley, TX 79525
MLS# 20448983Listed by: EKDAHL-NELSON REAL ESTATE $59,900Active4.44 Acres
Lot 9 Blue Lacy Lane, Anson, TX 79501
MLS# 20416469Listed by: RED FARM REALTY LLC $48,900Active4.44 Acres
Lot 2 Blue Lacy Lane, Anson, TX 79501
MLS# 20415832Listed by: RED FARM REALTY LLC $67,500Active4.3 Acres
Lot 8 Blue Lacy Lane, Anson, TX 79501
MLS# 20416449Listed by: RED FARM REALTY LLC $59,900Active4.44 Acres
Lot 10 Blue Lacy Lane, Anson, TX 79501
MLS# 20416528Listed by: RED FARM REALTY LLC $59,900Active4.44 Acres
Lot 11 Blue Lacy Lane, Anson, TX 79501
MLS# 20416538Listed by: RED FARM REALTY LLC $48,900Active4.44 Acres
Lot 12 Blue Lacy Lane, Anson, TX 79501
MLS# 20416558Listed by: RED FARM REALTY LLC $48,900Pending4.44 Acres
Lot 13 Blue Lacy Lane, Anson, TX 79501
MLS# 20416584Listed by: RED FARM REALTY LLC $48,900Active4.44 Acres
Lot 14 Blue Lacy Lane, Anson, TX 79501
MLS# 20416594Listed by: RED FARM REALTY LLC $59,900Active4.44 Acres
Lot 4 Blue Lacy Lane, Anson, TX 79501
MLS# 20415906Listed by: RED FARM REALTY LLC $59,900Active4.44 Acres
Lot 5 Blue Lacy Lane, Anson, TX 79501
MLS# 20415972Listed by: RED FARM REALTY LLC $48,900Active4.44 Acres
Lot 3 Blue Lacy Lane, Anson, TX 79501
MLS# 20415884Listed by: RED FARM REALTY LLC
Local realty services provided by:CENTURY 21 Harvey Properties
Information provided, in part, by North Texas Real Estate Information Systems, Inc. Last Updated June 11, 2026 Listings with the NTREIS logo are listed by brokerages other than CENTURY 21 Harvey Properties. GDAR Member Broker: Renee Harvey
Popular searches near Jones County, TX
Popular neighborhoods near Jones County, TX
- Abilene Heights, Abilene homes for sale
- Alameda, Abilene homes for sale
- Brookhollow, Abilene homes for sale
- Buck Creek, Abilene homes for sale
- Cobb Park, Abilene homes for sale
- Dyess Air Force Base, Abilene homes for sale
- Elmwood, Abilene homes for sale
- Elmwood West, Abilene homes for sale
- Fort Phantom, Abilene homes for sale
- North College, Abilene homes for sale
- North E. Hwy 80, Abilene homes for sale
- Original Town North, Abilene homes for sale
- Original Town South, Abilene homes for sale
- Over Place, Abilene homes for sale
- Park Central, Abilene homes for sale
- Radford Hills, Abilene homes for sale
- Sayles Blvd., Abilene homes for sale
- Sears Park, Abilene homes for sale
- South E. Hwy 80, Abilene homes for sale
- Westwood Richland, Abilene homes for sale
Zip codes near Jones County, TX
- 79501 homes for sale
- 79503 homes for sale
- 79520 homes for sale
- 79521 homes for sale
- 79525 homes for sale
- 79533 homes for sale
- 79534 homes for sale
- 79536 homes for sale
- 79543 homes for sale
- 79548 homes for sale
- 79553 homes for sale
- 79560 homes for sale
- 79561 homes for sale
- 79563 homes for sale
- 79601 homes for sale
- 79602 homes for sale
- 79603 homes for sale
- 79605 homes for sale
- 79606 homes for sale
- 79607 homes for sale
Protect your home and budget from life's surprises with an Assurant Home Warranty, backed by a partner that supports you through every step of homeownership. Explore Plans.
©2026 Century 21 Real Estate LLC. All rights reserved. CENTURY 21®, the CENTURY 21 Logo and C21® are service marks owned by Century 21 Real Estate LLC. Century 21 Real Estate LLC fully supports the principles of the Fair Housing Act and the Equal Opportunity Act. Each office is independently owned and operated. Listing information is deemed reliable but not guaranteed accurate.