- Amerige Heights, Fullerton homes for sale
- Apartment Row, Los Alamitos homes for sale
- Carson Park (Plaza East), Long Beach homes for sale
- College Park East, Seal Beach homes for sale
- El Dorado Lakes, Long Beach homes for sale
- El Dorado Park, Long Beach homes for sale
- El Dorado Park Estates, Long Beach homes for sale
- El Dorado Park North, Long Beach homes for sale
- El Dorado Park South, Long Beach homes for sale
- Highlands, Los Alamitos homes for sale
- Imperial Estates, Long Beach homes for sale
- Lakewood City, Long Beach homes for sale
- Lakewood Village, Long Beach homes for sale
- Los Altos North, Long Beach homes for sale
- Old Ranch, Seal Beach homes for sale
- Rancho Estates, Long Beach homes for sale
- Rossmoor, Los Alamitos homes for sale
- South Of Conant, Long Beach homes for sale
- West Anaheim, Anaheim homes for sale
- West Garden Grove, Garden Grove homes for sale
La Palma, CA - homes for sale
14 of 14 results displayed
- New
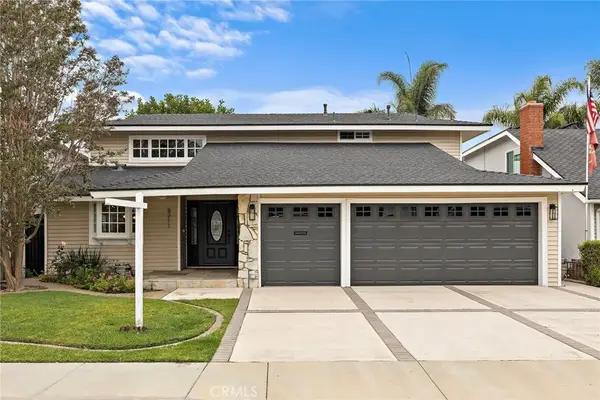 $1,330,000Active4 beds 2 baths2,222 sq. ft.
8211 Regency, La Palma, CA 90623
MLS# PW26122501Listed by: EAGLE REAL ESTATE - New
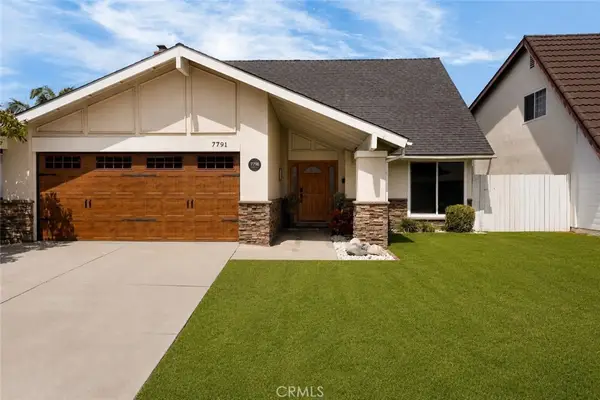 $1,249,000Active4 beds 3 baths2,099 sq. ft.
7791 Bouma Circle, La Palma, CA 90623
MLS# BB26119138Listed by: REDFIN CORPORATION 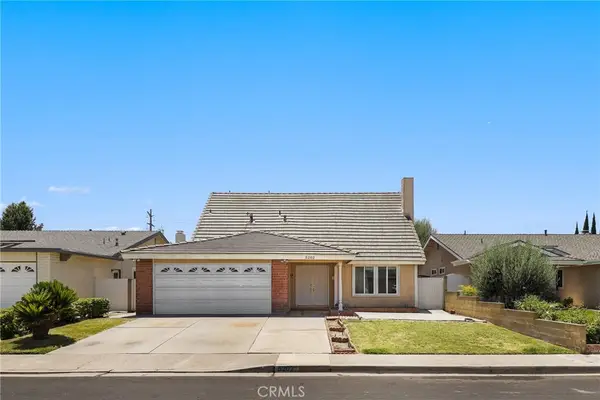 $1,199,999Pending4 beds 3 baths2,173 sq. ft.
5202 Andrew, La Palma, CA 90623
MLS# OC26120053Listed by: REDFIN- New
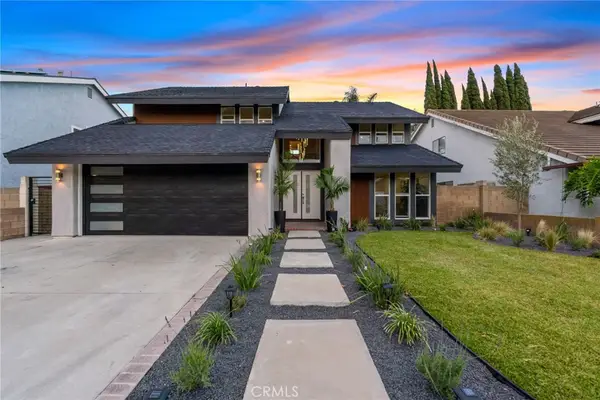 $1,498,000Active5 beds 3 baths2,166 sq. ft.
8032 Lancashire Cir, La Palma, CA 90623
MLS# DW26116061Listed by: KASE REAL ESTATE - New
 $649,000Active2 beds 2 baths925 sq. ft.
8612 Devon, La Palma, CA 90623
MLS# OC26108365Listed by: ALTA REALTY GROUP CA, INC  $1,479,000Active4 beds 3 baths2,197 sq. ft.
4841 Windsong, La Palma, CA 90623
MLS# RS26111186Listed by: T.N.G. REAL ESTATE CONSULTANTS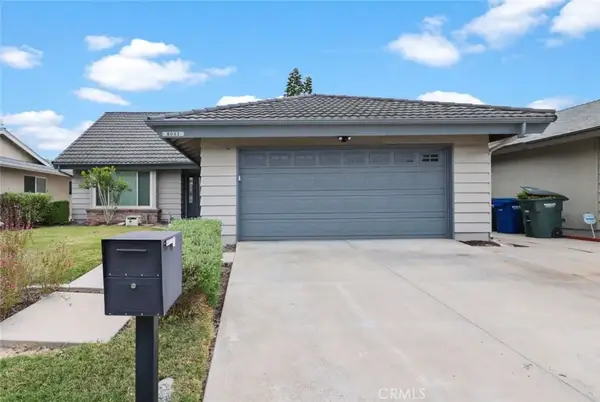 $1,349,000Active3 beds 3 baths2,339 sq. ft.
8082 Janeen Circle, La Palma, CA 90623
MLS# TR26107831Listed by: HOMECOIN.COM $899,000Pending3 beds 2 baths1,455 sq. ft.
5374 Houston Avenue, La Palma, CA 90623
MLS# SR26107858Listed by: LUXURY COLLECTIVE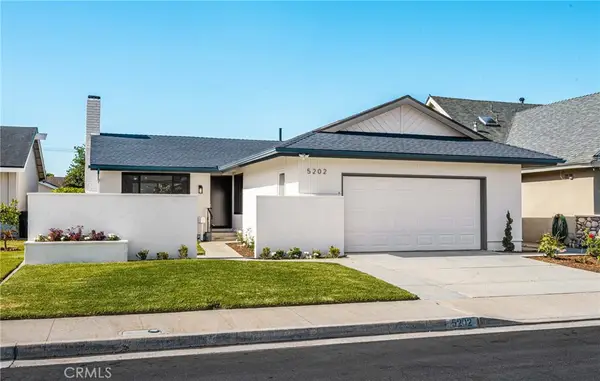 $1,195,000Active3 beds 2 baths1,432 sq. ft.
5202 Del Sur Circle, La Palma, CA 90623
MLS# PW26101914Listed by: FIRST TEAM REAL ESTATE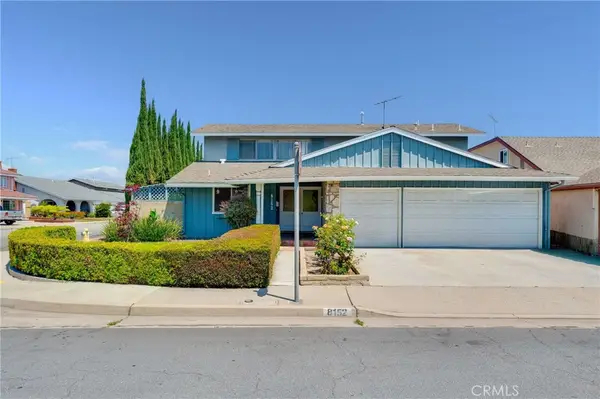 $999,999Pending4 beds 2 baths2,222 sq. ft.
8152 Redford Lane, La Palma, CA 90623
MLS# RS26097881Listed by: MY REALTY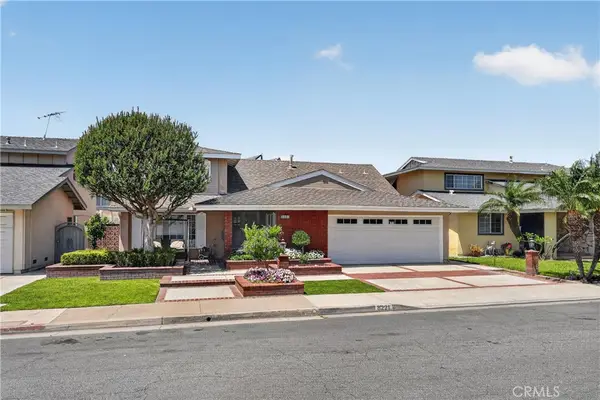 $1,450,000Pending3 beds 3 baths2,700 sq. ft.
8221 Somerdale Lane, La Palma, CA 90623
MLS# PW26093407Listed by: HOMESMART REALTY GROUP $1,250,000Active4 beds 4 baths2,225 sq. ft.
4922 El Rancho Verde, La Palma, CA 90623
MLS# IV26056611Listed by: SIMPLE REAL ESTATE GROUP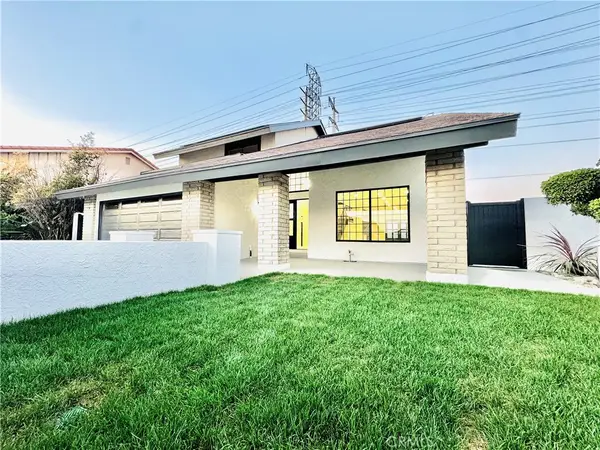 $1,450,000Pending4 beds 3 baths2,341 sq. ft.
5091 Sharon, La Palma, CA 90623
MLS# IG25256101Listed by: PRADO REALTY GROUP $26,500Active2.5 Acres
2-B-6 Crestview Way, McCloud, CA 96057
MLS# 20250806Listed by: MT. SHASTA REALTY, INC.
Local realty services provided by:CENTURY 21 Masters, CENTURY 21 Affiliated, CENTURY 21 Advantage
This information is deemed reliable but not guaranteed. You should rely on this information only to decide whether or not to further investigate a particular property. BEFORE MAKING ANY OTHER DECISION, YOU SHOULD PERSONALLY INVESTIGATE THE FACTS (e.g. square footage and lot size) with the assistance of an appropriate professional. You may use this information only to identify properties you may be interested in investigating further. All uses except for personal, non-commercial use in accordance with the foregoing purpose are prohibited. Redistribution or copying of this information, any photographs or video tours is strictly prohibited. This information is derived from the Internet Data Exchange (IDX) service provided by San Diego MLS®. Displayed property listings may be held by a brokerage firm other than the broker and/or agent responsible for this display. The information and any photographs and video tours and the compilation from which they are derived is protected by copyright. Compilation © 2020 San Diego MLS®, Inc. SANDICOR Member Broker: Randy Thompson
The information being provided by California Regional MLS (Southern California) is for the consumer's personal, non-commercial use and may not be used for any purpose other than to identify prospective properties consumer may be interested in purchasing. Any information relating to real estate for sale referenced on this web site comes from the Internet Data Exchange (IDX) program of the California Regional MLS (Southern California). CENTURY 21 Affiliated is not a Multiple Listing Service (MLS), nor does it offer MLS access. This website is a service of CENTURY 21 Affiliated, a broker participant of California Regional MLS (Southern California). This web site may reference real estate listing(s) held by a brokerage firm other than the broker and/or agent who owns this web site.
The accuracy of all information, regardless of source, including but not limited to open house information, square footages and lot sizes, is deemed reliable but not guaranteed and should be personally verified through personal inspection by and/or with the appropriate professionals. The data contained herein is copyrighted by California Regional MLS (Southern California) and is protected by all applicable copyright laws. Any unauthorized dissemination of this information is in violation of copyright laws and is strictly prohibited.
Copyright 2021 California Regional MLS (Southern California). All rights reserved. CRMLS Member Broker: Nikki Coppa
Neighborhoods near La Palma, CA
Zip codes near La Palma, CA
- 90620 homes for sale
- 90621 homes for sale
- 90623 homes for sale
- 90630 homes for sale
- 90638 homes for sale
- 90650 homes for sale
- 90670 homes for sale
- 90680 homes for sale
- 90701 homes for sale
- 90703 homes for sale
- 90706 homes for sale
- 90713 homes for sale
- 90715 homes for sale
- 90716 homes for sale
- 90720 homes for sale
- 90808 homes for sale
- 92801 homes for sale
- 92804 homes for sale
- 92833 homes for sale
- 92845 homes for sale
Popular searches near La Palma, CA
- Anaheim homes for sale
- Artesia homes for sale
- Bellflower homes for sale
- Buena Park homes for sale
- Cerritos homes for sale
- Cypress homes for sale
- Downey-Norwalk homes for sale
- East Whittier homes for sale
- Fullerton homes for sale
- Hawaiian Gardens homes for sale
- La Mirada homes for sale
- Lakewood homes for sale
- Los Alamitos homes for sale
- Norwalk homes for sale
- Rossmoor homes for sale
- Santa Fe Springs homes for sale
- Seal Beach homes for sale
- South Whittier homes for sale
- Stanton homes for sale
- Westminster homes for sale
Protect your home and budget from life's surprises with an Assurant Home Warranty, backed by a partner that supports you through every step of homeownership. Explore Plans.
©2026 Century 21 Real Estate LLC. All rights reserved. CENTURY 21®, the CENTURY 21 Logo and C21® are service marks owned by Century 21 Real Estate LLC. Century 21 Real Estate LLC fully supports the principles of the Fair Housing Act and the Equal Opportunity Act. Each office is independently owned and operated. Listing information is deemed reliable but not guaranteed accurate.