- Antelope Valley Country Club Estates, Palmdale homes for sale
- Challenger, Lancaster homes for sale
- Columbia, Lancaster homes for sale
- Desert View, Lancaster homes for sale
- Desert View Highlands, Palmdale homes for sale
- El Dorado, Lancaster homes for sale
- Joshua, Lancaster homes for sale
- Lincoln, Lancaster homes for sale
- Linda Verde, Lancaster homes for sale
- Lowtree, Lancaster homes for sale
- Mariposa, Lancaster homes for sale
- Northeast Gateway Corridors, Lancaster homes for sale
- Parkview, Lancaster homes for sale
- Piute, Lancaster homes for sale
- Quartz Hill, Lancaster homes for sale
- Rancho Vista, Palmdale homes for sale
- South Downtown Lancaster, Lancaster homes for sale
- Transit District, Lancaster homes for sale
- Trend, Lancaster homes for sale
- Yucca, Lancaster homes for sale
Leona Valley, CA - homes for sale
37 of 37 results displayed
- New
 $639,990Active4 beds 2 baths1,568 sq. ft.
8630 Penhaven, Leona Valley, CA 93551
MLS# SR26095683Listed by: KASA HOMES REALTY - New
 $889,000Active3 beds 2 baths2,222 sq. ft.
9251 Elizabeth Lake Road, Leona Valley, CA 93551
MLS# 26003511Listed by: P.J. DEHAAS PROPERTIES, INC.  $667,000Active4 beds 2 baths2,225 sq. ft.
39646 87th West, Leona Valley, CA 93551
MLS# SR26084235Listed by: KELLER WILLIAMS REALTY ANTELOPE VALLEY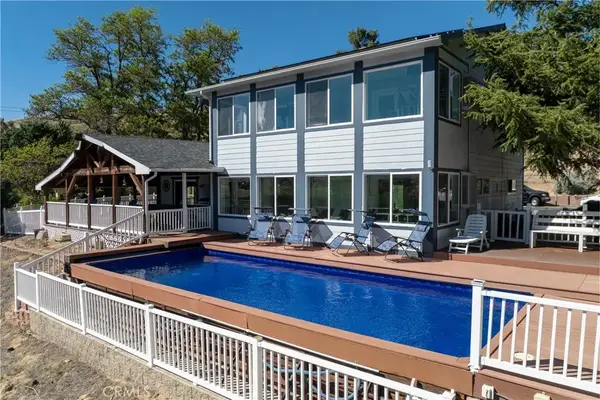 $999,999Active4 beds 4 baths3,736 sq. ft.
9065 Elizabeth Lake Rd, Leona Valley, CA 93551
MLS# SR26078362Listed by: BERKSHIRE HATHAWAY HOMESERVICES TROTH, REALTORS $550,000Active3 beds 2 baths1,599 sq. ft.
40145 98th Street, Leona Valley, CA 93551
MLS# 26002758Listed by: KELLER WILLIAMS REALTY A.V. $285,000Active0 Acres
9301 Lost Valley, Leona Valley, CA 93551
MLS# TR26071963Listed by: HOMECOIN.COM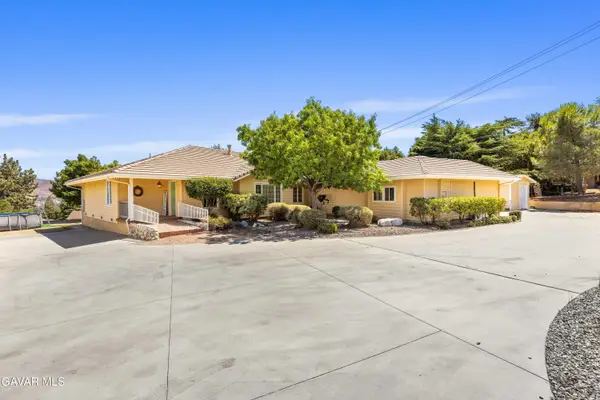 $774,900Pending3 beds 2 baths2,294 sq. ft.
40208 W 98th Street, Leona Valley, CA 93551
MLS# 26002640Listed by: RE/MAX ALL-PRO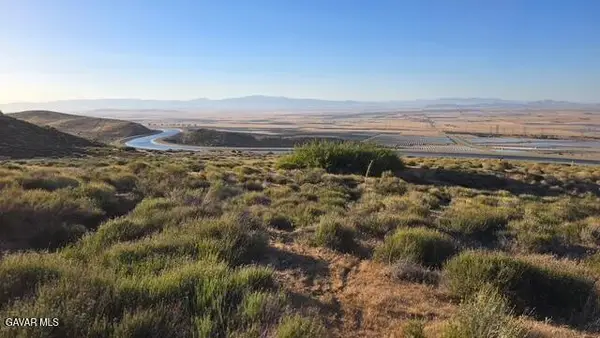
 $13,000Active2.48 Acres
Vic Avenue M & 91 St West, Palmdale, CA 93551
MLS# 26002652Listed by: CENTURY 21 DOUG ANDERSON $599,000Active3 beds 2 baths1,893 sq. ft.
40027 90th Street West, Leona Valley, CA 93551
MLS# SR26060193Listed by: EQUITY UNION $35,000Active2.5 Acres
0 W & Avenue M-4, Palmdale, CA 93551
MLS# 26658275Listed by: EXCLUSIVE REALTY INC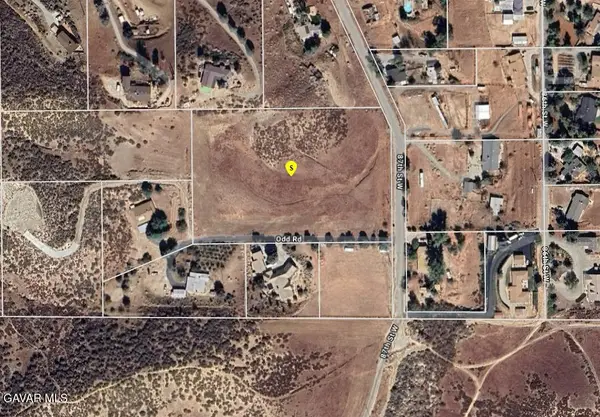 $280,000Active4.94 Acres
87th Stw Vic Vientos, Leona Valley, CA 93551
MLS# 26001630Listed by: LPT REALTY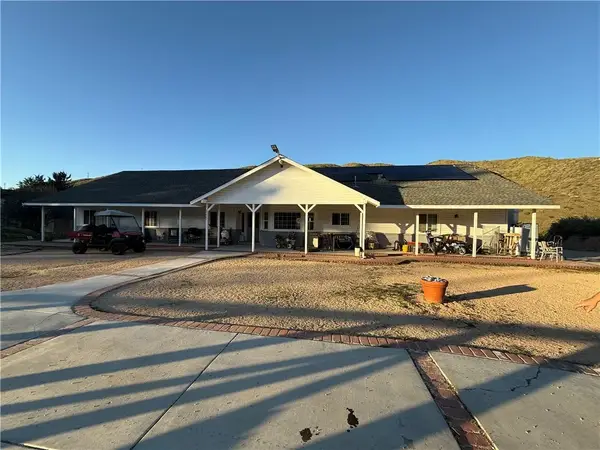 $699,900Active5 beds 3 baths2,655 sq. ft.
6221 Elizabeth Lake Road, Leona Valley, CA 93551
MLS# SR26040438Listed by: RE/MAX ALL-PRO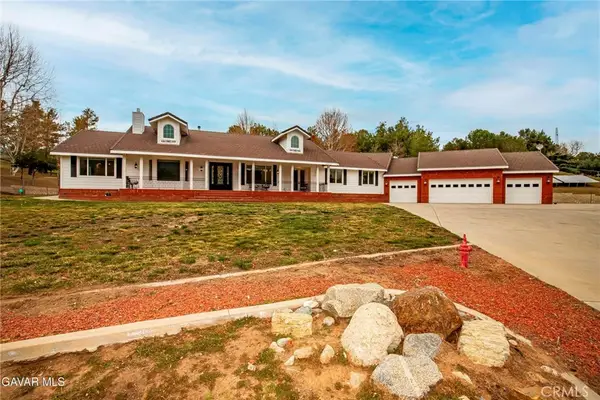 $1,195,000Active4 beds 3 baths3,700 sq. ft.
40012 Valle View, Leona Valley, CA 93551
MLS# SR26035021Listed by: THE REAL ESTATE PLACE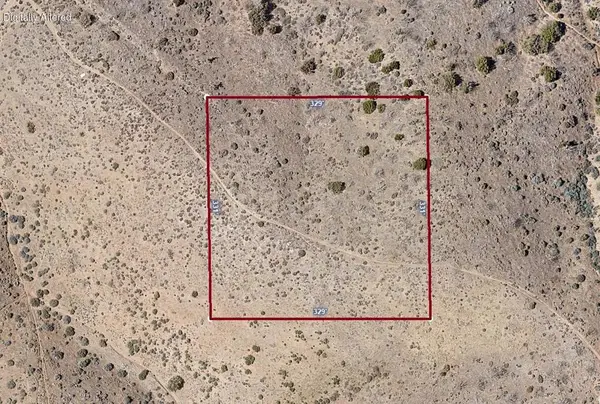 $27,000Active2.5 Acres
55 Street West & Avenue 04, Palmdale, CA 93551
MLS# 219143186DAListed by: TOCCHINI REAL ESTATE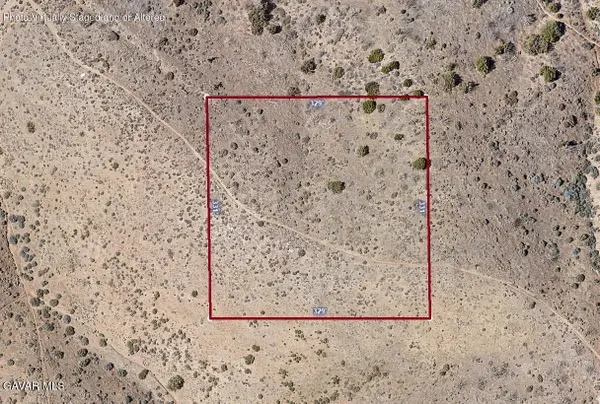 $27,000Active2.5 Acres
55th Street West & Avenue 04, Palmdale, CA 93551
MLS# 26001267Listed by: TOCCHINI REAL ESTATE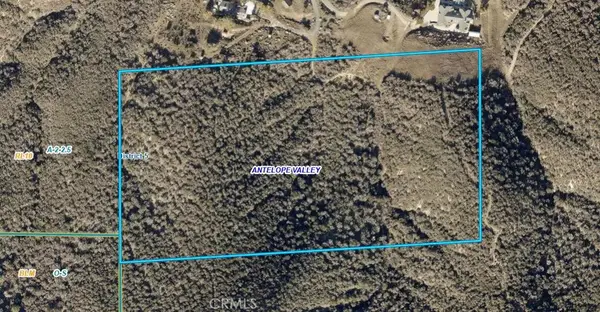 $50,000Active14.42 Acres
0 97th St W, Leona Valley, CA 93551
MLS# SR26026626Listed by: REALTY EXECUTIVES HOMES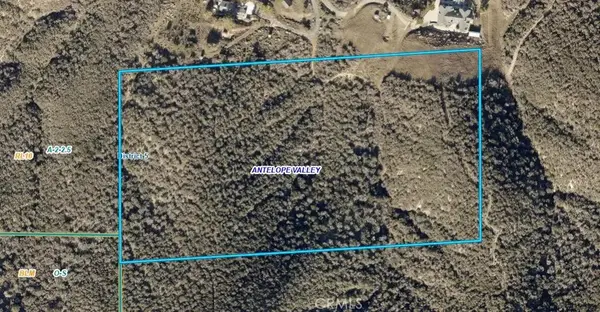 $50,000Active0 Acres
0 97th St W, Leona Valley, CA 93551
MLS# SR26026626Listed by: REALTY EXECUTIVES HOMES $130,000Active0 Acres
0 North Side Dr Vic Rulen St, Leona Valley, CA 93551
MLS# OC26020802Listed by: FIRST TEAM REAL ESTATE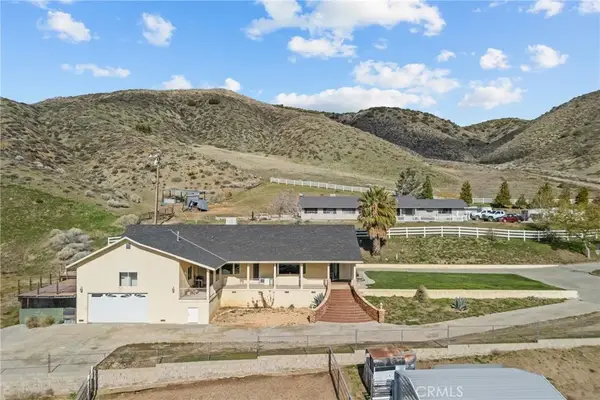 $869,000Active4 beds 3 baths3,246 sq. ft.
40647 Shallow Springs, Leona Valley, CA 93551
MLS# SR26005615Listed by: REALTY EXECUTIVES HOMES $175,000Active8.88 Acres
0 Bouqet Cyn Rd/vic Rogers Ck, Leona Valley, CA 93551
MLS# 25628891Listed by: COMPASS $225,000Active35.1 Acres
Vic 95th Stw 92nd Stw, Palmdale, CA 93551
MLS# 25008784Listed by: KELLER WILLIAMS REALTY A.V. $127,000Active8.78 Acres
Bouquet Cyn Vic 97 Stw, Palmdale, CA 93551
MLS# 25008501Listed by: KELLER WILLIAMS REALTY A.V.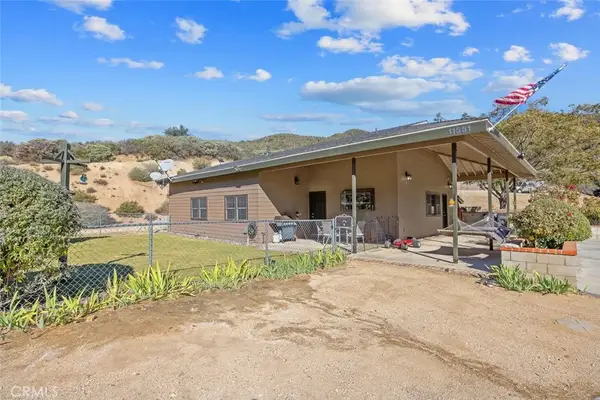 $725,000Active3 beds 2 baths1,900 sq. ft.
11551 Lonesome Valley, Leona Valley, CA 93551
MLS# SR25248911Listed by: PRIME REAL ESTATE $649,900Active4 beds 3 baths4,458 sq. ft.
40014 95th Street W, Leona Valley, CA 93551
MLS# SR25239829Listed by: COLDWELL BANKER REALTY $190,000Active0 Acres
1 Bouquet Canyon, Palmdale, CA 91350
MLS# SR25176360Listed by: SMART EQUITY REALTY INC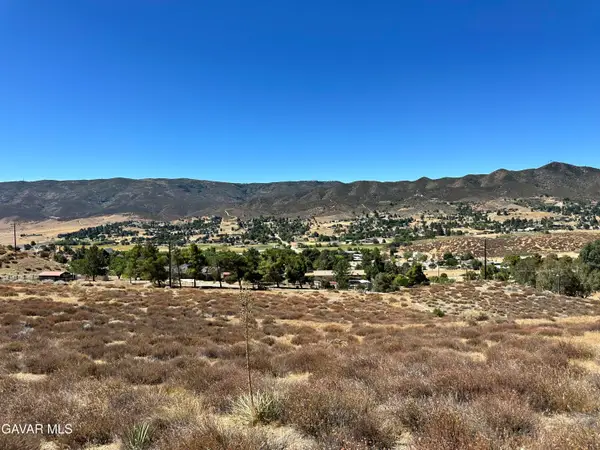 $199,000Active35.51 Acres
W 90th Street, Palmdale, CA 93551
MLS# 25005845Listed by: REALTY EXECUTIVES SANTA CLARITA $240,000Pending2.42 Acres
W 87th St W Street, Palmdale, CA 93551
MLS# 25003553Listed by: REALTY EXECUTIVES SANTA CLARITA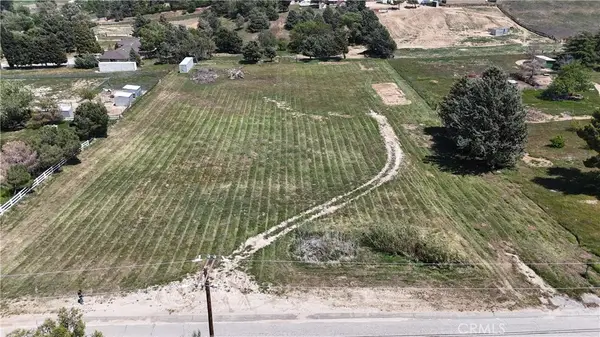 $240,000Pending2.42 Acres
0 87th Street W, Leona Valley, CA 93551
MLS# SR25102844Listed by: REALTY EXECUTIVES HOMES $60,000Active0 Acres
6500 Godde Hill, Palmdale, CA 93551
MLS# SR25056339Listed by: HOMESMART AV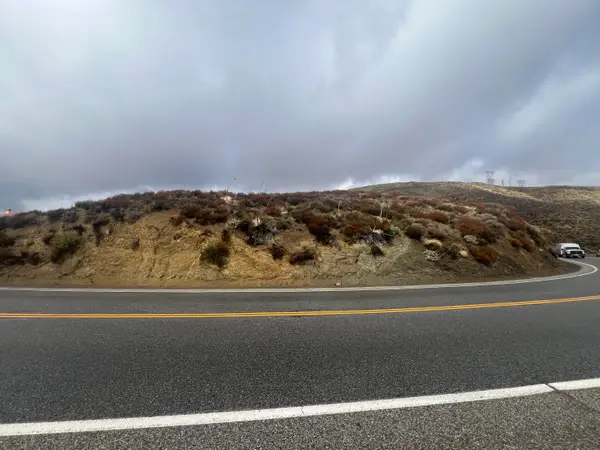 $55,000Active1.52 Acres
Godde Hill Rd Vic 65 Stw Road, Palmdale, CA 93551
MLS# 25001934Listed by: HOMESMART AV $285,000Active5.02 Acres
11039 Elizabeth Lake Road, Leona Valley, CA 93551
MLS# 25001405Listed by: ASSIST2SELL BUYERS & SELLERS $1,850,000Pending6 beds 4 baths3,999 sq. ft.
39954 90th Street W, Leona Valley, CA 93551
MLS# BB24255618Listed by: CITY CENTER REALTY GROUP $29,000Active2.5 Acres
Elizabeth Lk Rd Road, Leona Valley, CA 93551
MLS# 24006504Listed by: P.J. DEHAAS PROPERTIES, INC. $260,000Active0 Acres
9197 Northside, Leona Valley, CA 93551
MLS# OC24166106Listed by: IPRO REAL ESTATE $6,990Active2.48 Acres
Vic Avenue M2 95 Stw, Palmdale, CA 93551
MLS# 24003960Listed by: KELLER WILLIAMS REALTY A.V.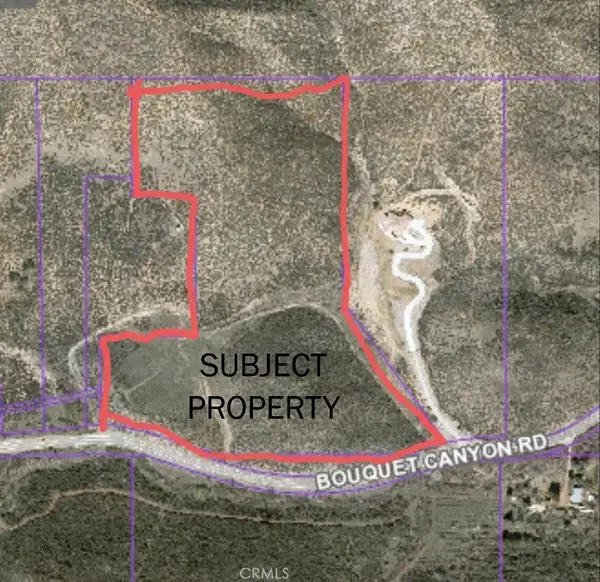 $199,000Active0 Acres
38351 Bouquet Canyon Road, Leona Valley, CA 93551
MLS# SR26061941Listed by: KELLER WILLIAMS REALTY-STUDIO CITY $35,000Active6.97 Acres
On Top Of Godde Hill Rd, Palmdale, CA 93551
MLS# 22003253Listed by: JPBROKER.COM
Local realty services provided by:CENTURY 21 Affiliated, CENTURY 21 Virginia Wilder Real Estate, CENTURY 21 Adams & Barnes
This information is deemed reliable but not guaranteed. You should rely on this information only to decide whether or not to further investigate a particular property. BEFORE MAKING ANY OTHER DECISION, YOU SHOULD PERSONALLY INVESTIGATE THE FACTS (e.g. square footage and lot size) with the assistance of an appropriate professional. You may use this information only to identify properties you may be interested in investigating further. All uses except for personal, non-commercial use in accordance with the foregoing purpose are prohibited. Redistribution or copying of this information, any photographs or video tours is strictly prohibited. This information is derived from the Internet Data Exchange (IDX) service provided by San Diego MLS®. Displayed property listings may be held by a brokerage firm other than the broker and/or agent responsible for this display. The information and any photographs and video tours and the compilation from which they are derived is protected by copyright. Compilation © 2020 San Diego MLS®, Inc.
The information being provided by California Regional MLS (Southern California) is for the consumer's personal, non-commercial use and may not be used for any purpose other than to identify prospective properties consumer may be interested in purchasing. Any information relating to real estate for sale referenced on this web site comes from the Internet Data Exchange (IDX) program of the California Regional MLS (Southern California). CENTURY 21 Adams & Barnes is not a Multiple Listing Service (MLS), nor does it offer MLS access. This website is a service of CENTURY 21 Adams & Barnes, a broker participant of California Regional MLS (Southern California). This web site may reference real estate listing(s) held by a brokerage firm other than the broker and/or agent who owns this web site.
The accuracy of all information, regardless of source, including but not limited to open house information, square footages and lot sizes, is deemed reliable but not guaranteed and should be personally verified through personal inspection by and/or with the appropriate professionals. The data contained herein is copyrighted by California Regional MLS (Southern California) and is protected by all applicable copyright laws. Any unauthorized dissemination of this information is in violation of copyright laws and is strictly prohibited.
Copyright 2021 California Regional MLS (Southern California). All rights reserved.
Neighborhoods near Leona Valley, CA
Zip codes near Leona Valley, CA
- 91040 homes for sale
- 91042 homes for sale
- 91321 homes for sale
- 91342 homes for sale
- 91350 homes for sale
- 91351 homes for sale
- 91354 homes for sale
- 91355 homes for sale
- 91384 homes for sale
- 91387 homes for sale
- 91390 homes for sale
- 93510 homes for sale
- 93532 homes for sale
- 93534 homes for sale
- 93536 homes for sale
- 93543 homes for sale
- 93550 homes for sale
- 93551 homes for sale
- 93552 homes for sale
- 93560 homes for sale
Popular searches near Leona Valley, CA
- Acton homes for sale
- Agua Dulce homes for sale
- Canyon Country homes for sale
- Del Sur homes for sale
- Desert View Highlands homes for sale
- Elizabeth Lake homes for sale
- Fairmont homes for sale
- Green Valley homes for sale
- Lake Hughes homes for sale
- Lancaster homes for sale
- Littlerock homes for sale
- Newhall homes for sale
- North Antelope Valley homes for sale
- Palmdale homes for sale
- Quartz Hill homes for sale
- Rosamond homes for sale
- Santa Clarita homes for sale
- Saugus homes for sale
- Sun Village homes for sale
- Willow Springs homes for sale
Protect your home and budget from life's surprises with an Assurant Home Warranty, backed by a partner that supports you through every step of homeownership. Explore Plans.
©2026 Century 21 Real Estate LLC. All rights reserved. CENTURY 21®, the CENTURY 21 Logo and C21® are service marks owned by Century 21 Real Estate LLC. Century 21 Real Estate LLC fully supports the principles of the Fair Housing Act and the Equal Opportunity Act. Each office is independently owned and operated. Listing information is deemed reliable but not guaranteed accurate.