- Brooklyn Manor, Woodhaven homes for sale
- Bushwick, Brooklyn homes for sale
- Central Ridgewood, Ridgewood homes for sale
- City Line, Brooklyn homes for sale
- Cypress Hills, Brooklyn homes for sale
- Forest Hills Estates, Forest Hills homes for sale
- Forest Hills Manor, Forest Hills homes for sale
- Glendale, Ridgewood homes for sale
- Middle Village, Middle Village homes for sale
- Ozone Park, Ozone Park homes for sale
- Rego Park, Rego Park homes for sale
- Richmond Hill Terrace, Richmond Hill homes for sale
- Richmond Hill West, Richmond Hill homes for sale
- Ridgewood, Ridgewood homes for sale
- Ridgewood South, Ridgewood homes for sale
- Union Course Park, Woodhaven homes for sale
- Union Terrace, Woodhaven homes for sale
- Unionville, Woodhaven homes for sale
- Woodhaven, Woodhaven homes for sale
- Wyckoff Park, Woodhaven homes for sale
New York, NY - homes for sale
300 of 32,058 results displayed
- Open Sun, 11am to 12pmNew
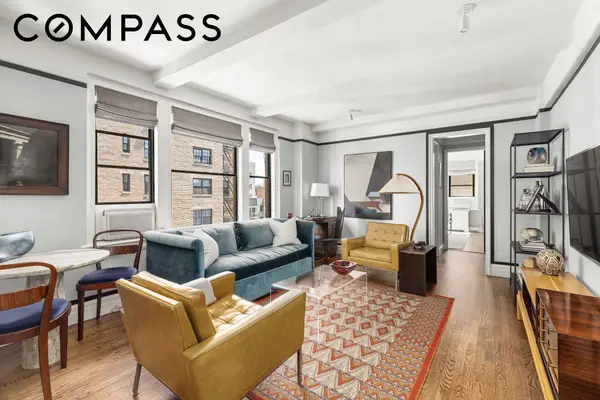
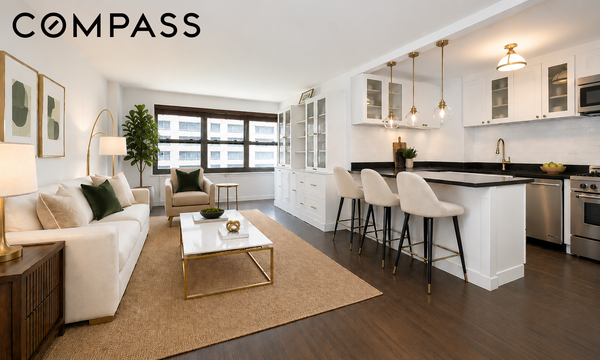
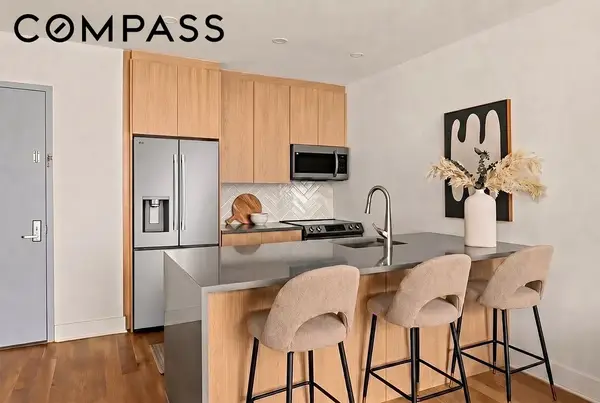
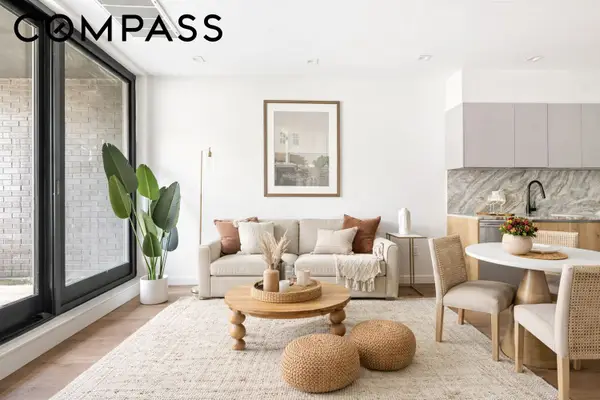
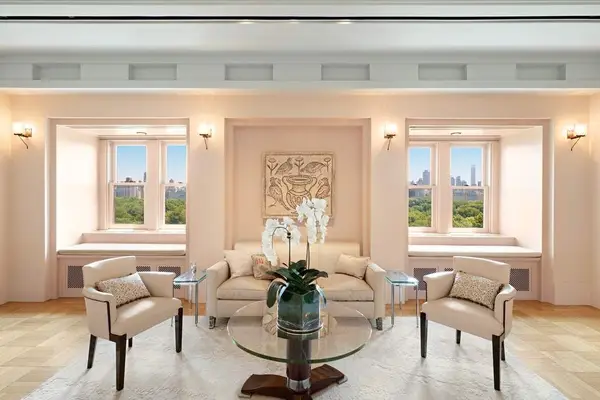
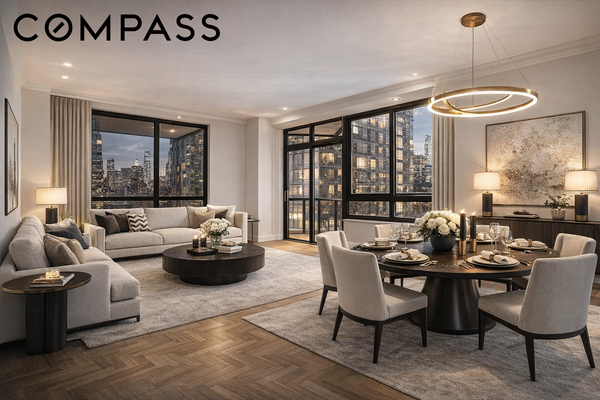
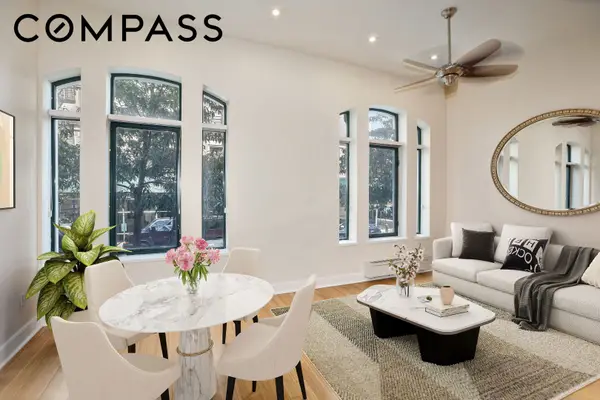 $1,350,000Active2 beds 3 baths1,800 sq. ft.
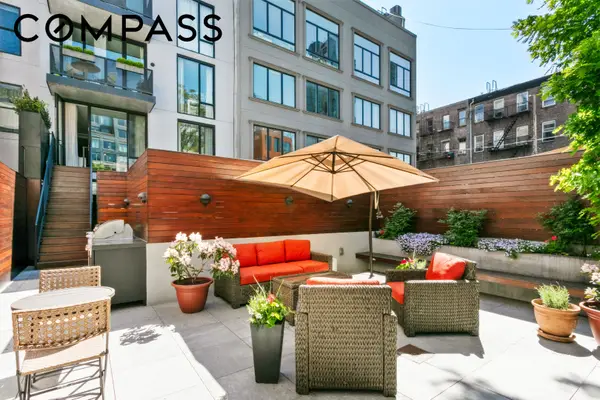
2056 5th Avenue #2B, Manhattan, NY 10035
MLS# RLS20096733Listed by: COMPASS
- New
 $238,000Active-- beds 1 baths
37-50 87th Street #5, Queens, NY 11372
MLS# RLS20096751Listed by: EXP REALTY NYC - New
 $795,000Active1 beds 1 baths676 sq. ft.
30-70 29th Street #2-A, Queens, NY 11102
MLS# RLS20096752Listed by: REAVIS DEVELOPMENT MARKETING LLC - New
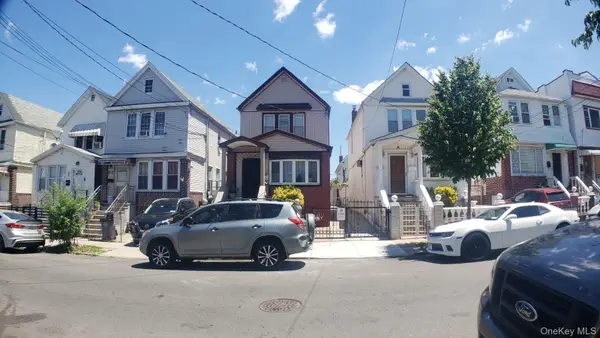
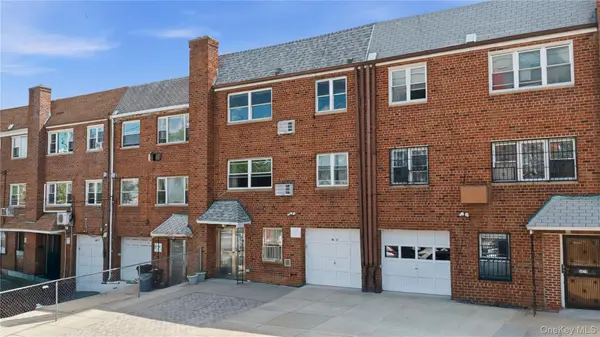
 $1,988,888Active6 beds 5 baths2,072 sq. ft.
83-34 116th Street, Kew Gardens, NY 11418
MLS# 1009208Listed by: EXIT REALTY FIRST CHOICE - New
 $259,000Active1 beds 1 baths750 sq. ft.
2610 Ocean Parkway #2D, Brooklyn, NY 11235
MLS# 502130Listed by: TWOREALESTATENY LLC - Coming Soon
 $875,000Coming Soon4 beds 2 baths
1656 Zerega Avenue, Bronx, NY 10462
MLS# 1010322Listed by: KELLER WILLIAMS REALTY NYC GRP - New
 $369,888Active2 beds 1 baths900 sq. ft.
213-02 75th Avenue #4E, Bayside, NY 11364
MLS# 1011497Listed by: RE/MAX 1ST CHOICE - New
 $330,000Active-- beds 1 baths650 sq. ft.
111-45 76th Drive #F2, Forest Hills, NY 11375
MLS# 1011498Listed by: FORWARD NY REAL ESTATE CORP - New
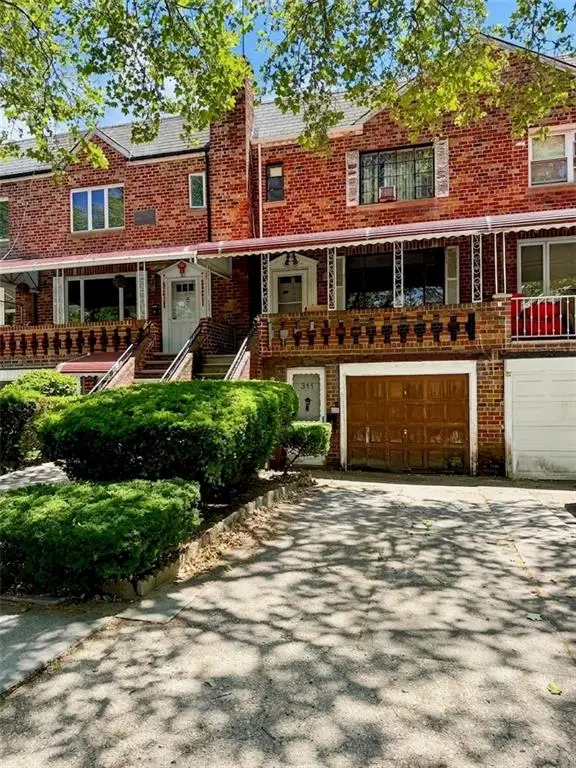 $1,300,000Active-- beds 3 baths
311 Bay 11th Street, Brooklyn, NY 11228
MLS# 502160Listed by: PECORARO REALTY OF NYC, LLC - New
 $2,550,000Active3 beds 2 baths1,582 sq. ft.
10 Nevins Street #PH-I, Brooklyn, NY 11217
MLS# RLS20096721Listed by: NEST SEEKERS LLC - New
 $850,000Active1 beds 1 baths530 sq. ft.
24-01 Queens Plaza N #2066, Queens, NY 11101
MLS# RLS20096722Listed by: NEST SEEKERS LLC - New
 $850,000Active1 beds 1 baths537 sq. ft.
24-01 Queens Plaza N #4011, Queens, NY 11101
MLS# RLS20096723Listed by: NEST SEEKERS LLC - New$1,499,999Active3 beds 2 baths1,200 sq. ft.
2521 46th Street, Astoria, NY 11103
MLS# 1011474Listed by: NY SPACE FINDERS INC - New
 $1,598,999Active-- beds -- baths3,034 sq. ft.
3083 49th Street, Astoria, NY 11103
MLS# 1011477Listed by: NY SPACE FINDERS INC - New
 $625,000Active-- beds 1 baths528 sq. ft.
2145 44th Drive #1D, Long Island City, NY 11101
MLS# 1011491Listed by: LIN PAN REALTY GROUP LLC - New
 $258,000Active1 beds 1 baths750 sq. ft.
14214 26th Avenue #3F, Flushing, NY 11354
MLS# 987222Listed by: HIDAYA REAL ESTATE LLC - Open Sun, 1 to 3pmNew
 $849,000Active3 beds 2 baths1,999 sq. ft.
3250 Country Club Road, Bronx, NY 10465
MLS# 1002280Listed by: DOUGLAS ELLIMAN REAL ESTATE - New
 $250,000Active1 beds 1 baths564 sq. ft.
83-52 Talbot Street #6H, Kew Gardens, NY 11415
MLS# 1006654Listed by: KELLER WILLIAMS POINTS NORTH - New
 $1,288,000Active2 beds 2 baths1,150 sq. ft.
147-58 7th Avenue, Whitestone, NY 11357
MLS# 1008880Listed by: KELLER WILLIAMS RLTY LANDMARK - New
 $1,198,800Active8 beds 4 baths3,528 sq. ft.
86-36 136th Street, Richmond Hill, NY 11418
MLS# 1010148Listed by: RE/MAX 1ST CHOICE - New
 $145,000Active1 beds 1 baths707 sq. ft.
3 Fordham Hill Oval #1G, Bronx, NY 10468
MLS# 1011417Listed by: AT HOME WITH YARA REALTY - New

 $1,200,000Active7 beds 4 baths1,824 sq. ft.
13147 134th Street, South Ozone Park, NY 11420
MLS# 1011424Listed by: CENTURY 21 PROFESSIONAL REALTY - Open Sat, 11am to 1pmNew
 $899,999Active4 beds 2 baths1,303 sq. ft.
24616 86th Road, Bellerose, NY 11426
MLS# 1011434Listed by: OVERSOUTH LLC - New
 $399,900Active2 beds 2 baths1,100 sq. ft.
61-20 Grand Central Parkway #A1, Forest Hills, NY 11375
MLS# 1011451Listed by: UTOPIA REAL ESTATE - New
 $355,000Active3 beds 1 baths820 sq. ft.
92 Saint Nicholas Avenue #3G, New York (Manhattan), NY 10026
MLS# 1011454Listed by: DOUGLAS ELLIMAN REAL ESTATE - New$2,699,000Active2 beds 3 baths2,688 sq. ft.
751 Franklin Avenue, Brooklyn, NY 11238
MLS# RLS20096710Listed by: NEST SEEKERS LLC - New
 $1,649,000Active-- beds 7 baths4,400 sq. ft.
2456 West 2nd Street, Brooklyn, NY 11223
MLS# 502128Listed by: ILITE REALTY INC - New
 $591,000Active2 beds 2 baths1,125 sq. ft.
2934 Brighton 4th Street #A, Brooklyn, NY 11235
MLS# 502169Listed by: EXP REALTY BKNY - New
 $299,000Active2 beds 1 baths
2866 Marion Avenue #1-C, Bronx, NY 10458
MLS# RLS20096700Listed by: R NEW YORK - Open Sun, 2 to 3:30pmNew
 $409,000Active1 beds 1 baths
495 E 7th Street #3J, Brooklyn, NY 11218
MLS# RLS20096703Listed by: DOUGLAS ELLIMAN REAL ESTATE - New
 $875,000Active1 beds 1 baths685 sq. ft.
515 E 72nd Street #5R, Manhattan, NY 10021
MLS# RLS20096704Listed by: COMPASS - New
 $219,000Active1 beds 1 baths
2866 Marion Avenue #1-I, Bronx, NY 10458
MLS# RLS20096705Listed by: R NEW YORK - Open Sun, 11am to 12:30pmNew
 $1,700,000Active3 beds 2 baths1,264 sq. ft.
218 23rd Street #2, Brooklyn, NY 11232
MLS# RLS20096706Listed by: SERHANT - New
 $448,000Active1 beds 1 baths51,630 sq. ft.
87-09 34th Avenue #6J, Queens, NY 11372
MLS# RLS20096682Listed by: CORE GROUP MARKETING LLC - New
 $4,395,000Active3 beds 3 baths1,999 sq. ft.
133 W 22nd Street #10D, Manhattan, NY 10011
MLS# RLS20096688Listed by: COMPASS - New
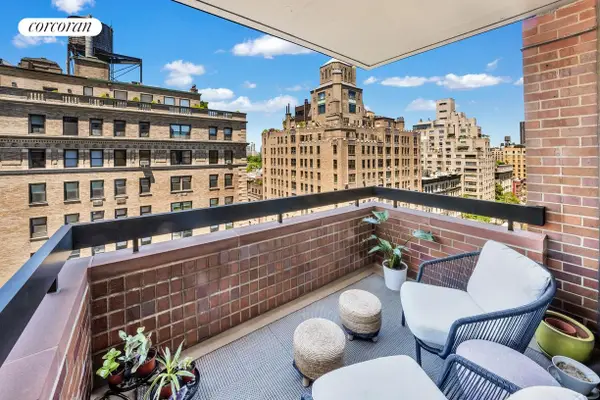
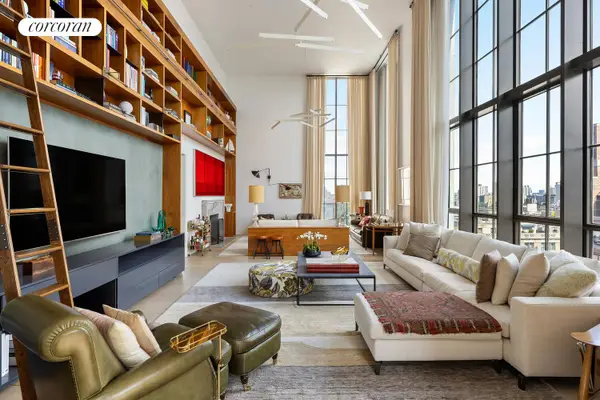 $23,000,000Active4 beds 6 baths4,932 sq. ft.
60 E 86th Street #PH, Manhattan, NY 10028
MLS# RLS20096690Listed by: CORCORAN GROUP - Open Sun, 1 to 2:30pmNew
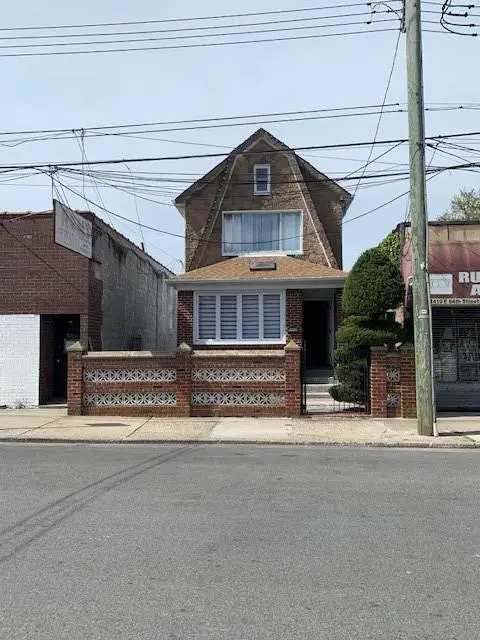 $688,888Active4 beds 2 baths1,464 sq. ft.
1412 E 64th Street, Brooklyn, NY 11234
MLS# 502168Listed by: PERGOLIZZI JASON - New
 $1,169,000Active3 beds 2 baths2,000 sq. ft.
223-15 109th Avenue, Queens Village, NY 11429
MLS# 1003501Listed by: CENTURY 21 MILESTONE TEAM RLTY - New
 $1,090,000Active3 beds 2 baths1,488 sq. ft.
6127 157th Street, Flushing, NY 11367
MLS# 1009150Listed by: P R O LINKS REALTY INC - New
 $748,800Active1 beds 1 baths
72-12 66th Road, Middle Village, NY 11379
MLS# 1011386Listed by: RE/MAX TEAM - Coming Soon$985,000Coming Soon-- beds -- baths
11614 Bessemer Street, Richmond Hill, NY 11418
MLS# 1011387Listed by: REAL BROKER NY LLC - New
 $699,000Active1 beds 2 baths1,300 sq. ft.
27110 Grand Central Parkway #7V, Far Rockaway, NY 11005
MLS# 1011388Listed by: MAGIC OF GREAT NECK REALTY INC - New
 $749,000Active3 beds 3 baths1,176 sq. ft.
14206 116th Avenue, Jamaica, NY 11436
MLS# 1011399Listed by: KEYSTONE REALTY USA CORP - New
 $1,100,000Active7 beds 5 baths2,200 sq. ft.
112-38 212th Street, Queens Village, NY 11429
MLS# 1011407Listed by: EXCLUSIVE HOMES GROUP INC - New
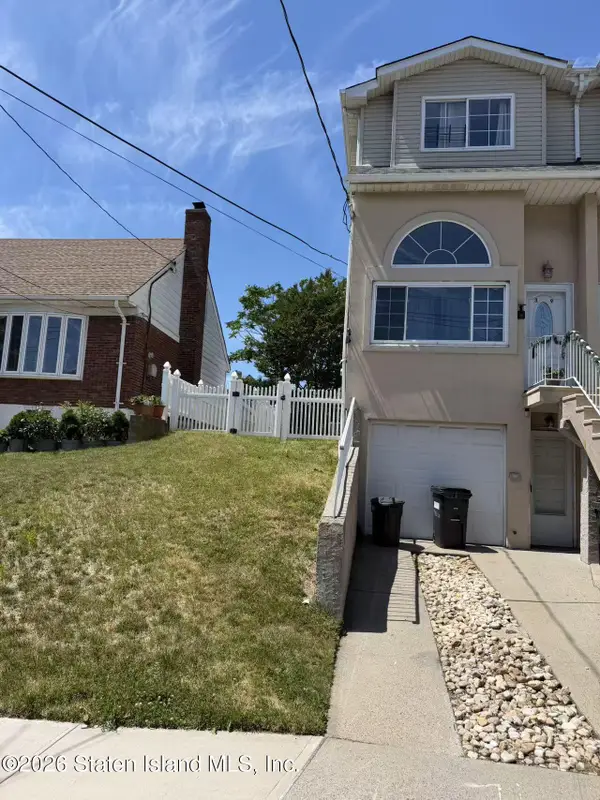
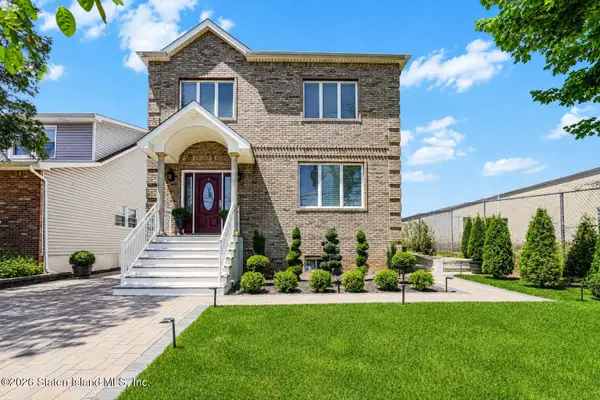
 $775,000Active3 beds 2 baths1,143 sq. ft.
50 Fairway Avenue, Staten Island, NY 10304
MLS# 2603253Listed by: DITOMMASO REAL ESTATE - New
 $4,795,000Active3 beds 3 baths2,201 sq. ft.
200 Chambers Street #10A, Manhattan, NY 10007
MLS# RLS20096652Listed by: SERHANT - New
 $560,000Active3 beds 2 baths1,400 sq. ft.
2390 Palisade Avenue #2F, Bronx, NY 10463
MLS# RLS20096666Listed by: TRIBRONYC LLC - New
 $775,000Active1 beds 1 baths115,297 sq. ft.
180 W 93rd Street #6G, Manhattan, NY 10025
MLS# RLS20096670Listed by: SOTHEBYS INTERNATIONAL REALTY - Open Thu, 12:30 to 1:30pmNew
 $575,000Active1 beds 1 baths
230 E 79th Street #18F, Manhattan, NY 10075
MLS# RLS20096673Listed by: CORCORAN GROUP - New
 $5,995,000Active5 beds 7 baths783 sq. ft.
524 11th Street, Brooklyn, NY 11215
MLS# RLS20096676Listed by: DOUGLAS ELLIMAN REAL ESTATE - New
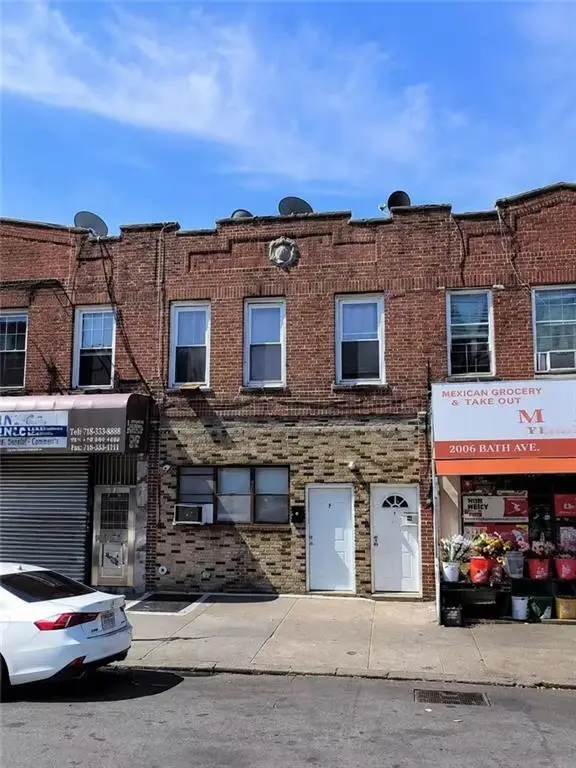 $1,290,000Active3 beds 2 baths1,254 sq. ft.
2010 Bath Avenue, Brooklyn, NY 11214
MLS# 502161Listed by: TIGER REALTY - New
 $699,000Active3 beds 1 baths1,424 sq. ft.
38 Shepherd Avenue, Brooklyn, NY 11208
MLS# 502164Listed by: RE/MAX ELITE - New
 $936,100Active2 beds 2 baths874 sq. ft.
144-49 Northern Blvd #213, Flushing, NY 11354
MLS# 1009159Listed by: B SQUARE REALTY - New
 $936,100Active2 beds 2 baths874 sq. ft.
144-49 Northern Boulevard #218, Flushing, NY 11354
MLS# 1009211Listed by: B SQUARE REALTY - New
 $1,100,200Active2 beds 2 baths799 sq. ft.
144-49 Northern Boulevard #224, Flushing, NY 11354
MLS# 1009233Listed by: B SQUARE REALTY - New
 $1,100,200Active2 beds 2 baths799 sq. ft.
144-49 Northern Boulevard #225, Flushing, NY 11354
MLS# 1009248Listed by: B SQUARE REALTY - New
 $1,119,500Active2 beds 2 baths813 sq. ft.
144-49 Northern Boulevard #226, Flushing, NY 11354
MLS# 1009258Listed by: B SQUARE REALTY - New
 $896,500Active2 beds 2 baths799 sq. ft.
144-49 Northern Boulevard #325, Flushing, NY 11354
MLS# 1009270Listed by: B SQUARE REALTY - New
 $932,900Active2 beds 2 baths813 sq. ft.
144-49 Northern Boulevard #405, Flushing, NY 11354
MLS# 1009281Listed by: B SQUARE REALTY - New
 $1,015,800Active2 beds 2 baths866 sq. ft.
14449 Northern Boulevard #418, Flushing, NY 11354
MLS# 1009305Listed by: B SQUARE REALTY - New
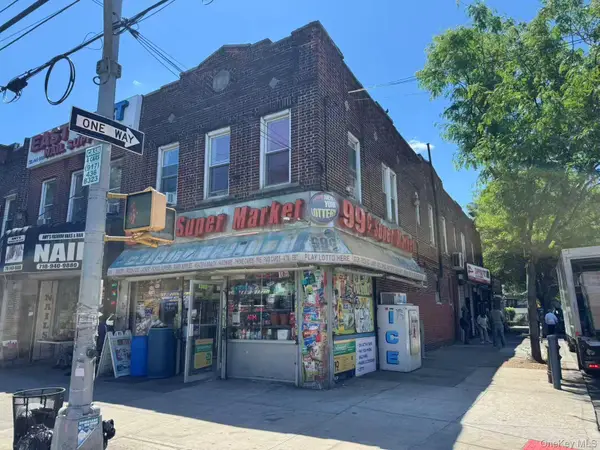
 $1,398,000Active10 beds 3 baths2,640 sq. ft.
103-22 123rd Street, Richmond Hill, NY 11419
MLS# 1009318Listed by: MITRA HAKIMI REALTY GROUP LLC - New
 $965,400Active2 beds 2 baths823 sq. ft.
144-49 Northern Blvd #420, Flushing, NY 11354
MLS# 1009571Listed by: B SQUARE REALTY - New
 $957,600Active2 beds 2 baths799 sq. ft.
144-49 Northern Blvd #607, Flushing, NY 11354
MLS# 1009579Listed by: B SQUARE REALTY - New
 $1,199,000Active6 beds 2 baths2,622 sq. ft.
14563 181st Street, Springfield Gardens, NY 11413
MLS# 1009684Listed by: VORO LLC - New
 $389,000Active2 beds 1 baths950 sq. ft.
57-10 Junction Blvd #4G, Elmhurst, NY 11373
MLS# 1010269Listed by: KELLER WILLIAMS RLTY LANDMARK - New
 $579,927Active1 beds 1 baths611 sq. ft.
124-28 Queens Boulevard #11C, Kew Gardens, NY 11415
MLS# 1010547Listed by: BERKSHIRE HATHAWAY - New
 $849,000Active5 beds 4 baths4,275 sq. ft.
102-06 27th Avenue, East Elmhurst, NY 11369
MLS# 1011227Listed by: EMPIRE FINE HOMES - New
 $2,688,000Active10 beds 7 baths3,066 sq. ft.
4658 161st Street, Flushing, NY 11358
MLS# 1011236Listed by: HOME COURT REAL ESTATE LLC - New
 $599,999Active-- beds -- baths2,973 sq. ft.
574 E 170th Street, Bronx, NY 10456
MLS# 1011250Listed by: B2B REAL ESTATE GROUP INC - New
 $725,000Active2 beds 2 baths892 sq. ft.
97-45 63rd Drive #3H, Rego Park, NY 11374
MLS# 1011270Listed by: KELLER WILLIAMS LANDMARK II - New
 $180,000Active-- beds 1 baths600 sq. ft.
150-11 72nd Road #6E, Kew Garden Hills, NY 11367
MLS# 1011271Listed by: DOUGLAS ELLIMAN REAL ESTATE - Coming Soon$629,900Coming Soon2 beds 1 baths
13405 Dahlia Avenue #11-1B, Flushing, NY 11355
MLS# 1011277Listed by: COMPASS GREATER NY, LLC - Coming Soon
 $998,000Coming Soon4 beds 2 baths
13331 122nd Street, South Ozone Park, NY 11420
MLS# 1011290Listed by: KELLER WILLIAMS REALTY LIBERTY - New
 $545,000Active1 beds 1 baths579 sq. ft.
70-65 Queens Boulevard #9I, Woodside, NY 11377
MLS# 1011299Listed by: KELLER WILLIAMS RLTY LANDMARK - New
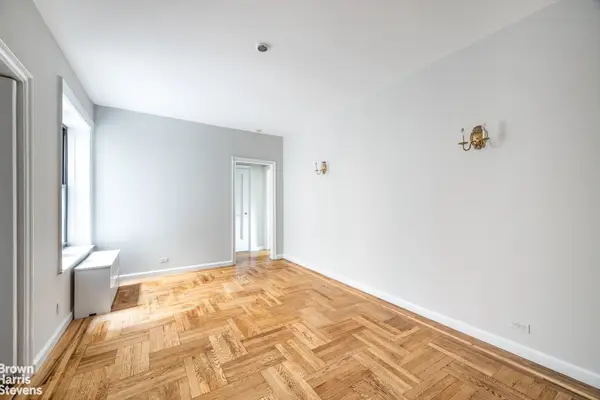
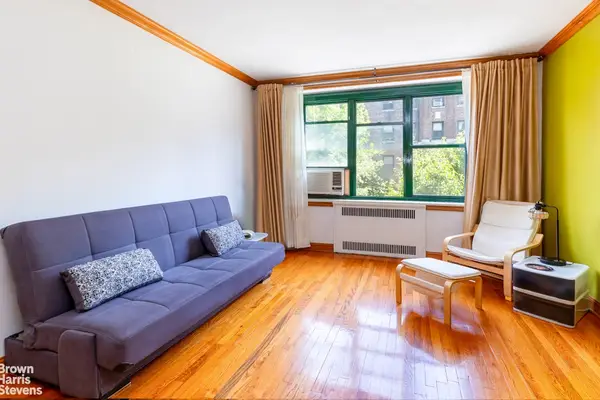
 $240,000Active2 beds 1 baths
825 Walton Avenue #5F, Bronx, NY 10451
MLS# 1011304Listed by: BROWN HARRIS STEVENS - New
 $999,999Active3 beds 3 baths1,088 sq. ft.
3068 Nostrand Avenue, Brooklyn, NY 11229
MLS# 1011309Listed by: DREAM AMERICA HOMES - New
 $295,000Active-- beds 1 baths650 sq. ft.
25 Indian Road #2A, New York (Manhattan), NY 10034
MLS# 1011317Listed by: NEW HEIGHTS REALTY - New
 $260,000Active2 beds 1 baths900 sq. ft.
1 Fordham Hill Oval #3g, Bronx, NY 10468
MLS# 1011329Listed by: LINK NY REALTY - New
 $899,000Active5 beds 4 baths1,376 sq. ft.
138-24 95th Avenue, Jamaica, NY 11435
MLS# 1011335Listed by: CROSSROADS PROPERTIES - New
 $699,000Active4 beds 1 baths1,200 sq. ft.
9744 108th Street, Richmond Hill S., NY 11419
MLS# 1011339Listed by: SIGNATURE PREMIER PROPERTIES - New
 $1,250,000Active6 beds 3 baths1,938 sq. ft.
111-27 38th Avenue, Corona, NY 11368
MLS# 857570Listed by: WINZONE REALTY INC - New
 $798,888Active3 beds 3 baths1,680 sq. ft.
39 New Lane, Staten Island, NY 10305
MLS# 2603252Listed by: TIGER REALTY - Open Thu, 4:30 to 6pmNew
 $975,000Active1 beds 1 baths
45 5th Avenue #14C, Manhattan, NY 10003
MLS# RLS20096419Listed by: COMPASS - Coming Soon
 $1,175,000Coming Soon2 beds 2 baths
200 E 90th Street #26F, Manhattan, NY 10128
MLS# RLS20096455Listed by: AKAM SALES & BROKERAGE INC - Open Sun, 2 to 5pmNew
 $3,200,000Active2 beds 3 baths1,592 sq. ft.
30 Front Street #15D, Brooklyn, NY 11201
MLS# RLS20096618Listed by: DOUGLAS ELLIMAN REAL ESTATE - Open Sun, 2 to 5pmNew
 $2,950,000Active2 beds 3 baths1,471 sq. ft.
30 Front Street #18C, Brooklyn, NY 11201
MLS# RLS20096619Listed by: DOUGLAS ELLIMAN REAL ESTATE - Open Thu, 5 to 6:30pmNew
 $1,780,000Active2 beds 2 baths1,082 sq. ft.
83 Eagle Street #2, Brooklyn, NY 11222
MLS# RLS20096621Listed by: COMPASS - New
 $525,000Active2 beds 1 baths
9 Pinehurst Avenue #1-C, Manhattan, NY 10033
MLS# RLS20096622Listed by: STEPHEN P WALD REAL ESTATE ASSOCIATES INC - New
 $4,295,000Active3 beds 4 baths1,831 sq. ft.
196 Orchard Street #9C, Manhattan, NY 10002
MLS# RLS20096624Listed by: CORCORAN GROUP - New
 $900,000Active1 beds 1 baths
111 E 75th Street #7A, Manhattan, NY 10021
MLS# RLS20096625Listed by: BROWN HARRIS STEVENS RESIDENTIAL SALES LLC - Open Sun, 11am to 1pmNew
 $895,000Active2 beds 1 baths
140 W End Avenue #9J, Manhattan, NY 10023
MLS# RLS20096627Listed by: COMPASS - New
 $1,350,000Active1 beds 2 baths916 sq. ft.
308 E 72nd Street #7E, Manhattan, NY 10021
MLS# RLS20096632Listed by: CORCORAN GROUP - New
 $1,350,000Active2 beds 2 baths1,085 sq. ft.
415 E 37th Street #21J, Manhattan, NY 10016
MLS# RLS20096633Listed by: CORCORAN GROUP - Open Fri, 12 to 1pmNew
 $1,795,000Active2 beds 2 baths1,800 sq. ft.
45 Sutton Place S #18E, Manhattan, NY 10022
MLS# RLS20096636Listed by: CORCORAN GROUP - New
 $849,000Active2 beds 1 baths
266 E Broadway #B705, Manhattan, NY 10002
MLS# RLS20096637Listed by: BROWN HARRIS STEVENS RESIDENTIAL SALES LLC - New
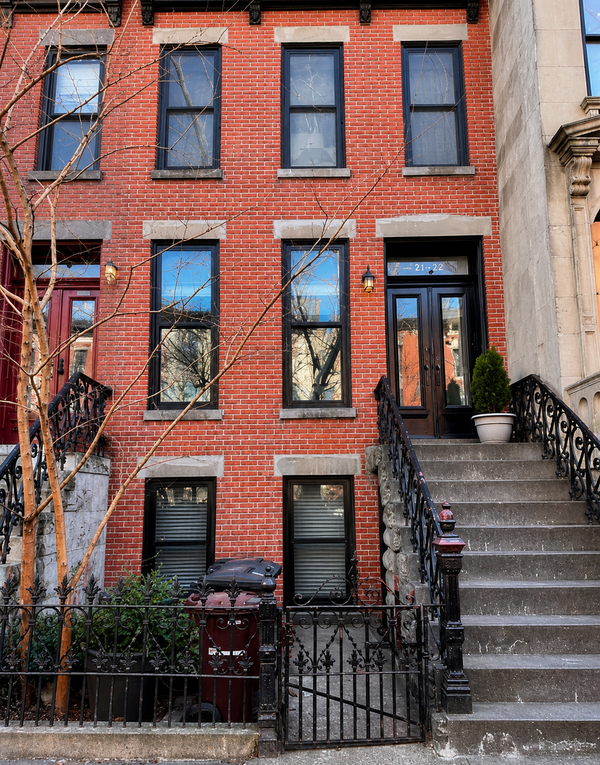 $2,850,000Active5 beds 4 baths2,400 sq. ft.
21-22 45th Avenue, Queens, NY 11101
MLS# RLS20096638Listed by: KELLER WILLIAMS NYC - New
 $2,200,000Active4 beds 4 baths880 sq. ft.
438 Lewis Avenue, Brooklyn, NY 11233
MLS# RLS20096639Listed by: DOUGLAS ELLIMAN REAL ESTATE - New
 $5,250,000Active3 beds 3 baths
1010 5th Avenue #14B, Manhattan, NY 10028
MLS# RLS20096641Listed by: BROWN HARRIS STEVENS RESIDENTIAL SALES LLC - New
 $525,000Active1 beds 1 baths
500 Grand Street #C2C, Manhattan, NY 10002
MLS# RLS20096644Listed by: BROWN HARRIS STEVENS RESIDENTIAL SALES LLC - New
 $1,195,000Active3 beds 2 baths1,176 sq. ft.
298 12th Street #1/R, Brooklyn, NY 11215
MLS# RLS20096648Listed by: SERHANT - New
 $1,749,500Active2 beds 2 baths1,266 sq. ft.
265 State Street #1414, Brooklyn, NY 11201
MLS# RLS20096650Listed by: CORCORAN GROUP - New
 $879,000Active5 beds 3 baths1,960 sq. ft.
145 Marisa Circle, Staten Island, NY 10309
MLS# 2603238Listed by: FILLMORE REAL ESTATE FUSION - New
 $280,250Active3 beds 2 baths1,176 sq. ft.
116 Pond Way, Staten Island, NY 10303
MLS# 2603239Listed by: AMERICAN HOMES GROUP - New
 $1,195,000Active6 beds 5 baths2,500 sq. ft.
23 Wiltshire Lane, Staten Island, NY 10309
MLS# 2603240Listed by: ROBERT DEFALCO REALTY, INC. - Open Sat, 12 to 2pmNew
 $769,000Active2 beds 1 baths1,984 sq. ft.
994 E 54th Street, Brooklyn, NY 11234
MLS# 2603241Listed by: RE/MAX ELITE - Open Sat, 12 to 2pmNew
 $460,000Active2 beds 2 baths1,100 sq. ft.
23 Wolkoff Lane, Staten Island, NY 10303
MLS# 2603242Listed by: OZANA REALTY GROUP - New
 $2,688,888Active4 beds 5 baths4,280 sq. ft.
161 Boardwalk Avenue, Staten Island, NY 10312
MLS# 2603243Listed by: COMPASS REALTY CENTRAL INC. - New
 $825,000Active3 beds 3 baths1,536 sq. ft.
128 Graves Street, Staten Island, NY 10314
MLS# 2603244Listed by: RE/MAX ELITE - Open Sat, 1 to 3pmNew
 $899,888Active5 beds 3 baths2,144 sq. ft.
52 Vineland Avenue, Staten Island, NY 10312
MLS# 2603245Listed by: ROBERT DEFALCO REALTY, INC. - New
 $629,000Active3 beds 2 baths850 sq. ft.
255 Saint Marys Avenue, Staten Island, NY 10305
MLS# 2603246Listed by: ROBERT DEFALCO REALTY, INC. - New
 $626,000Active3 beds 2 baths1,400 sq. ft.
36 Village Lane #8b, Staten Island, NY 10312
MLS# 2603247Listed by: DITOMMASO REAL ESTATE - New
 $299,000Active1 beds 1 baths608 sq. ft.
51 Seafoam Street, Staten Island, NY 10306
MLS# 2603248Listed by: RE/MAX EDGE - New
 $2,000,000Active6 beds 3 baths2,640 sq. ft.
36 72nd Street, Brooklyn, NY 11209
MLS# 2603249Listed by: ROCKLAND REALTY INC. - New
 $729,999Active3 beds 1 baths1,104 sq. ft.
263 Thornycroft Avenue, Staten Island, NY 10312
MLS# 2603250Listed by: RE/MAX CENTRAL - Open Sun, 2 to 3:30pmNew
 $1,200,000Active2 beds 2 baths1,064 sq. ft.
500 4th Avenue #3A, Brooklyn, NY 11215
MLS# RLS20096594Listed by: COMPASS - New
 $1,795,000Active2 beds 3 baths1,325 sq. ft.
415 E 37th Street #41G, Manhattan, NY 10016
MLS# RLS20096599Listed by: ADIN YORAM - New
 $6,250,000Active5 beds 5 baths3,340 sq. ft.
360 Furman Street #640/641, Brooklyn, NY 11201
MLS# RLS20096604Listed by: COMPASS - New
 $219,000Active1 beds 1 baths
2866 Marion Avenue #4-B, Bronx, NY 10458
MLS# RLS20096611Listed by: R NEW YORK - New
 $450,000Active1 beds 1 baths
741 W End Avenue #1D, Manhattan, NY 10025
MLS# RLS20096614Listed by: BROWN HARRIS STEVENS RESIDENTIAL SALES LLC - Open Sun, 11:30am to 1pmNew
 $2,350,000Active4 beds 3 baths2,700 sq. ft.
515 E 3rd Street, Brooklyn, NY 11218
MLS# RLS20096616Listed by: COMPASS - Open Sun, 2:30 to 4pmNew
 $1,725,000Active2 beds 2 baths1,199 sq. ft.
509 Pacific Street #4H, Brooklyn, NY 11217
MLS# RLS20096617Listed by: CORCORAN GROUP - New
 $749,000Active-- beds 3 baths2,057 sq. ft.
427 East 34th Street, Brooklyn, NY 11203
MLS# 502154Listed by: CALEMINE & CO. REAL ESTATE, LL - New
 $1,380,000Active6 beds 4 baths2,000 sq. ft.
141 Bay 47th Street, Brooklyn, NY 11214
MLS# 502155Listed by: WINZONE REALTY INC - Open Sun, 12:30 to 2pmNew
 $3,500,000Active3 beds 2 baths2,000 sq. ft.
204 Berkeley Place #1, Brooklyn, NY 11217
MLS# RLS20096562Listed by: SOTHEBYS INTERNATIONAL REALTY - Open Sun, 12 to 1:30pmNew
 $1,399,000Active3 beds 2 baths1,623 sq. ft.
219 Withers Street #1B, Brooklyn, NY 11211
MLS# RLS20096568Listed by: CORCORAN GROUP - New
 $3,200,000Active2 beds 3 baths
145-146 Central Park W #2B, Manhattan, NY 10023
MLS# RLS20096573Listed by: COMPASS - New
 $499,000Active2 beds 1 baths
35-11 85th Street #4K, Queens, NY 11372
MLS# RLS20096574Listed by: COMPASS - New
 $575,000Active1 beds 1 baths625 sq. ft.
40 Schaefer Street #3B, Brooklyn, NY 11207
MLS# RLS20096577Listed by: COMPASS - New
 $325,000Active1 beds 1 baths
72-61 113th Street #7F, Queens, NY 11375
MLS# RLS20096578Listed by: CORCORAN GROUP - New
 $1,095,000Active1 beds 1 baths
5 E 22nd Street #10B, Manhattan, NY 10010
MLS# RLS20096580Listed by: BROWN HARRIS STEVENS RESIDENTIAL SALES LLC - Open Sat, 1 to 2pmNew
 $749,000Active1 beds 1 baths850 sq. ft.
200 E 36th Street #8G, Manhattan, NY 10016
MLS# RLS20096583Listed by: CHERYL RODRIGUES REAL ESTATE LLC - New
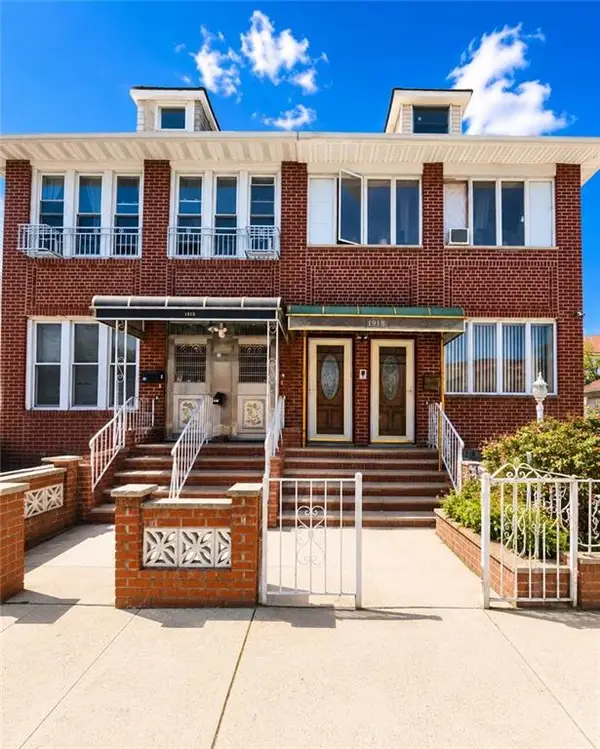 $2,200,000Active6 beds 3 baths2,600 sq. ft.
1918 79th Street, Brooklyn, NY 11214
MLS# 502111Listed by: RE/MAX EDGE - New
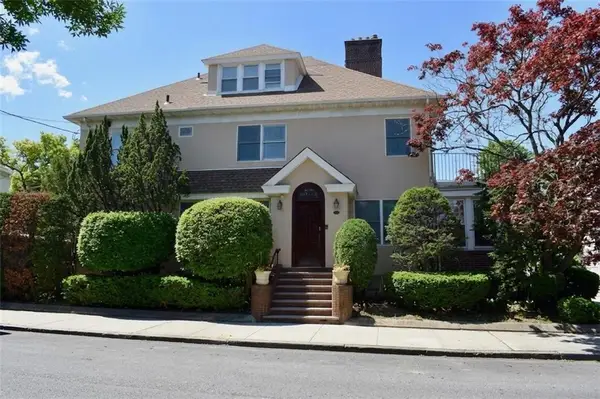 $1,950,000Active4 beds 3 baths1,852 sq. ft.
8701 Colonial Road, Brooklyn, NY 11209
MLS# 502117Listed by: PECORARO REALTY OF NYC, LLC - New$680,000Active3 beds 2 baths975 sq. ft.
1221 East 91st Street, Brooklyn, NY 11236
MLS# 502131Listed by: BHHS FILLMORE R.E. - New
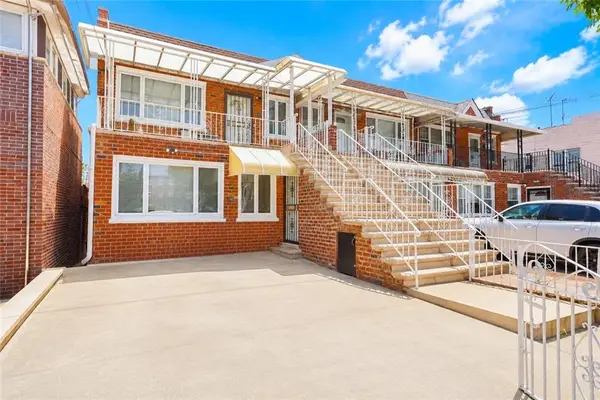 $1,275,000Active4 beds 2 baths2,140 sq. ft.
185 27th Avenue, Brooklyn, NY 11214
MLS# 502134Listed by: RE/MAX EDGE - New
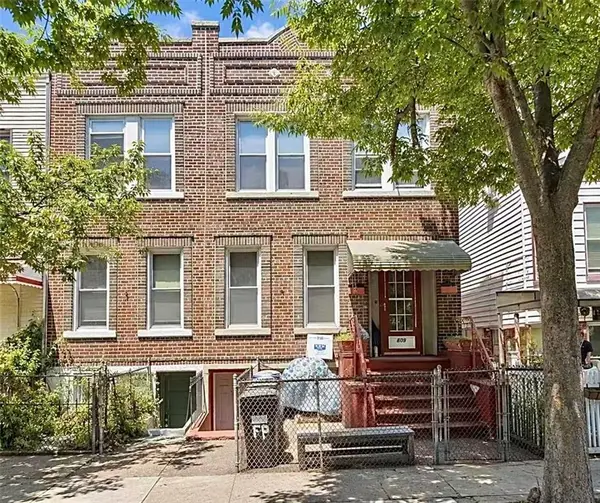 $1,499,000Active-- beds 2 baths1,936 sq. ft.
809 Friel Place, Brooklyn, NY 11218
MLS# 502136Listed by: TIGER REALTY - Open Sun, 12 to 1pmNew
 $1,650,000Active3 beds 3 baths2,317 sq. ft.
29 Exeter Street, Brooklyn, NY 11235
MLS# 502145Listed by: DIAMOND REAL INC - New
 $2,495,000Active4 beds 3 baths2,040 sq. ft.
18714 Aberdeen Road, Jamaica Estates, NY 11432
MLS# 1009406Listed by: EXIT REALTY FIRST CHOICE - New
 $2,485,000Active5 beds 4 baths2,700 sq. ft.
82-04 188th Street, Jamaica Estates, NY 11432
MLS# 1009420Listed by: EXIT REALTY FIRST CHOICE - New
 $788,000Active2 beds 3 baths1,260 sq. ft.
7108 Sutton Place #1, Fresh Meadows, NY 11365
MLS# 1009981Listed by: RE/MAX TEAM - Open Sat, 12 to 2pmNew
 $591,187Active1 beds 1 baths611 sq. ft.
124-28 Queens Boulevard #12C, Kew Gardens, NY 11415
MLS# 1010445Listed by: BERKSHIRE HATHAWAY - New
 $499,000Active1 beds 1 baths610 sq. ft.
3506 Leavitt Street #5H, Flushing, NY 11354
MLS# 1011084Listed by: CHASE GLOBAL REALTY CORP - Coming SoonOpen Sun, 12 to 1:30pm
 $698,000Coming Soon2 beds 2 baths
72-11 110th Street #1B, Forest Hills, NY 11375
MLS# 1011197Listed by: EXP REALTY - New$1,600,000Active0.08 Acres
1880 University Avenue, Bronx, NY 10453
MLS# 1011200Listed by: KINGDOM CONNECTION REALTY LLC - New
 $1,575,000Active7 beds 5 baths2,434 sq. ft.
6089 54th Street, Maspeth, NY 11378
MLS# 1011215Listed by: EXIT REALTY PRIME - New
 $400,000Active1 beds 1 baths774 sq. ft.
102-10 66th Road #12A, Forest Hills, NY 11375
MLS# 1011223Listed by: SOLD BY BART R E PARTNERS INC - New
 $1,950,000Active1 beds 2 baths1,067 sq. ft.
1 W End Avenue #14E, Manhattan, NY 10023
MLS# RLS20083956Listed by: COMPASS - New
 $2,250,000Active5 beds 6 baths3,878 sq. ft.
1147 Hancock Street, Brooklyn, NY 11221
MLS# RLS20095842Listed by: COMPASS - New
 $1,450,000Active1 beds 2 baths1,020 sq. ft.
237 Devoe Street #2-F, Brooklyn, NY 11211
MLS# RLS20096541Listed by: REAVIS DEVELOPMENT MARKETING LLC - New
 $1,499,000Active7 beds 4 baths1,452 sq. ft.
153 E 37th Street, Brooklyn, NY 11203
MLS# RLS20096542Listed by: CORCORAN GROUP - New$895,000Active2 beds 1 baths
185 Hall Street #1704, Brooklyn, NY 11205
MLS# RLS20096544Listed by: DOUGLAS ELLIMAN REAL ESTATE - New
 $2,150,000Active2 beds 2 baths
100 W 12th Street #4K, Manhattan, NY 10011
MLS# RLS20096545Listed by: SERHANT - New
 $320,000Active-- beds 1 baths
35 E 30th Street #5D, Manhattan, NY 10016
MLS# RLS20096546Listed by: DOUGLAS ELLIMAN REAL ESTATE - New
 $775,000Active1 beds 1 baths596 sq. ft.
44 Box Street #2C, Brooklyn, NY 11222
MLS# RLS20096549Listed by: COMPASS - Open Sun, 12 to 1:30pmNew
 $339,000Active1 beds 1 baths
78-11 35th Avenue #3G, Queens, NY 11372
MLS# RLS20096551Listed by: BROWN HARRIS STEVENS RESIDENTIAL SALES LLC - New
 $18,950,000Active5 beds 6 baths4,445 sq. ft.
50 W 66th Street #17F, Manhattan, NY 10023
MLS# RLS20096553Listed by: CORCORAN GROUP - Open Sun, 11am to 1pmNew
 $1,849,000Active3 beds 2 baths1,340 sq. ft.
259 22nd Street #2D, Brooklyn, NY 11215
MLS# RLS20096554Listed by: DOUGLAS ELLIMAN REAL ESTATE - New
 $1,175,000Active2 beds 2 baths884 sq. ft.
259 22nd Street #2B, Brooklyn, NY 11215
MLS# RLS20096557Listed by: DOUGLAS ELLIMAN REAL ESTATE - Open Wed, 12 to 1:30pmNew
 $4,500,000Active4 beds 5 baths5,010 sq. ft.
166 Pacific Street, Brooklyn, NY 11201
MLS# RLS20096559Listed by: COMPASS - New$795,000Active1 beds 1 baths578 sq. ft.
259 22nd Street #1B, Brooklyn, NY 11215
MLS# RLS20096560Listed by: DOUGLAS ELLIMAN REAL ESTATE  $965,000Pending2 beds 2 baths
325 E 41st Street #502, Manhattan, NY 10017
MLS# RLS20096556Listed by: CORCORAN GROUP- New
 $349,000Active2 beds 1 baths870 sq. ft.
1970 E Tremont Avenue #9D, Bronx, NY 10462
MLS# 1008987Listed by: PROGRESS REALTY INC. - New
 $1,580,000Active8 beds 3 baths3,630 sq. ft.
2928 86th Street, Brooklyn, NY 11223
MLS# 502085Listed by: RE/MAX REAL ESTATE PROFESSIONA - New
 $1,699,000Active-- beds 3 baths
8772 20th Avenue, Brooklyn, NY 11214
MLS# 502098Listed by: MADISONESTATES SOTHEBYS REALTY - Coming SoonOpen Sun, 12 to 2pm
 $195,000Coming Soon1 beds 1 baths
5645 Netherland Ave #Apt 5E, Bronx, NY 10471
MLS# 1000454Listed by: REAL BROKER NY LLC - New
 $799,000Active3 beds 3 baths1,324 sq. ft.
18806 Mangin Avenue, Saint Albans, NY 11412
MLS# 1009989Listed by: EXIT REALTY ALL CITY - New
 $205,000Active1 beds 1 baths750 sq. ft.
880 Boynton Avenue #13A, Bronx, NY 10473
MLS# 1010518Listed by: YOURHOMESOLD GUARANTEED REALTY - New
 $925,000Active4 beds 3 baths1,400 sq. ft.
147-03 111th Avenue, Jamaica, NY 11435
MLS# 1011060Listed by: ARJUN HOME REALTY CORP - Open Sat, 11am to 1pmNew
 $785,000Active3 beds 1 baths1,100 sq. ft.
104 Division Avenue #17, Brooklyn, NY 11211
MLS# 1011061Listed by: MYNY RESIDENTIAL - New
 $650,000Active3 beds 2 baths990 sq. ft.
11722 142nd Place, Jamaica, NY 11436
MLS# 1011107Listed by: EXP REALTY - Open Sun, 11am to 12:30pmNew
 $1,099,000Active5 beds 3 baths
234 E 42nd Street, Brooklyn, NY 11203
MLS# 1011118Listed by: KEYSTONE REALTY USA CORP - Open Sat, 12 to 1pmNew
 $1,279,999Active5 beds 4 baths1,510 sq. ft.
14944 20th Avenue, Whitestone, NY 11357
MLS# 1011147Listed by: NEIGHBORHOOD ELITE HOMES LLC - New
 $2,900Active0.14 Acres
158-01 Crossbay Boulevard, Howard Beach, NY 11414
MLS# 1011151Listed by: CENTURY 21 AMIABLE RLTY GRP II - New
 $249,900Active1 beds 1 baths800 sq. ft.
43-25 Douglaston Parkway #2B, Douglaston, NY 11363
MLS# 1011162Listed by: KELLER WILLIAMS REALTY GREATER - Open Sat, 12 to 2pmNew
 $630,000Active2 beds 2 baths1,825 sq. ft.
17 Lyman Avenue, Staten Island, NY 10305
MLS# 2603230Listed by: RELIANCE REALTY ONE - New
 $1,299,000Active8 beds 5 baths3,250 sq. ft.
127 Madsen Avenue, Staten Island, NY 10309
MLS# 2603231Listed by: REAL BROKER NY LLC - New
 $425,000Active2 beds 1 baths1,000 sq. ft.
255 79th Street #A4, Brooklyn, NY 11209
MLS# 2603232Listed by: EXP REALTY - New
 $615,000Active3 beds 3 baths1,480 sq. ft.
151 Morani Street, Staten Island, NY 10314
MLS# 2603233Listed by: RE/MAX EDGE - New
 $1,195,000Active6 beds 5 baths2,500 sq. ft.
15 Wiltshire Lane, Staten Island, NY 10309
MLS# 2603234Listed by: ROBERT DEFALCO REALTY, INC. - New
 $668,000Active3 beds 2 baths1,368 sq. ft.
176 Tysens Lane, Staten Island, NY 10306
MLS# 2603235Listed by: MOMENTUM REAL ESTATE LLC - Open Sun, 1 to 3pmNew
 $445,000Active2 beds 1 baths900 sq. ft.
27 Bradley Court #A41, Staten Island, NY 10314
MLS# 2603236Listed by: ROBERT DEFALCO REALTY, INC. - New
 $879,000Active3 beds 2 baths2,176 sq. ft.
141 Marisa Circle, Staten Island, NY 10309
MLS# 2603237Listed by: FILLMORE REAL ESTATE FUSION - $1,125,000Pending1 beds 1 baths
25 E 69th Street #4B, Manhattan, NY 10021
MLS# RLS20096482Listed by: DOUGLAS ELLIMAN REAL ESTATE  $1,750,000Pending1 beds 1 baths
61 Jane Street #14K, Manhattan, NY 10014
MLS# RLS20096491Listed by: CORCORAN GROUP $7,100,000Pending5 beds 6 baths4,038 sq. ft.
344 W 72nd Street #301, Manhattan, NY 10023
MLS# RLS20096510Listed by: CORCORAN GROUP- Open Sun, 11am to 1pmNew
 $2,950,000Active2 beds 2 baths
682 Broadway #2B, Manhattan, NY 10012
MLS# RLS20096203Listed by: COMPASS - New
 $600,000Active2 beds 1 baths
134 W 82nd Street #2D, Manhattan, NY 10024
MLS# RLS20096454Listed by: COMPASS - Open Sun, 3:30 to 4:30pmNew
 $799,000Active-- beds 1 baths195,190 sq. ft.
161 W 16th Street #10J, Manhattan, NY 10011
MLS# RLS20096483Listed by: SOTHEBYS INTERNATIONAL REALTY - New
 $2,200,000Active2 beds 2 baths2,157 sq. ft.
373 16th Street #Entire Building, Brooklyn, NY 11215
MLS# RLS20096484Listed by: SOTHEBYS INTERNATIONAL REALTY - New
 $1,750,000Active3 beds 3 baths1,174 sq. ft.
200 Rector Place #31E, Manhattan, NY 10280
MLS# RLS20096486Listed by: CORCORAN GROUP - New
 $700,000Active1 beds 1 baths
215 Adams Street #16H, Brooklyn, NY 11201
MLS# RLS20096489Listed by: CORCORAN GROUP - New
 $835,000Active1 beds 1 baths934 sq. ft.
865 United Nations Plaza #6C, Manhattan, NY 10017
MLS# RLS20096490Listed by: BOND NEW YORK PROPERTIES LLC - New
 $550,000Active-- beds 1 baths410 sq. ft.
531 Vanderbilt Avenue #3C, Brooklyn, NY 11238
MLS# RLS20096493Listed by: CORCORAN GROUP - New
 $950,000Active1 beds 1 baths
205 3rd Avenue #20C, Manhattan, NY 10003
MLS# RLS20096498Listed by: CORCORAN GROUP - New
 $499,000Active1 beds 1 baths
211 E 35th Street #9D, Manhattan, NY 10016
MLS# RLS20096511Listed by: DOUGLAS ELLIMAN REAL ESTATE - New
 $1,195,000Active2 beds 2 baths1,200 sq. ft.
176 Seeley Street #D1, Brooklyn, NY 11218
MLS# RLS20096513Listed by: SERHANT - New
 $425,000Active1 beds 1 baths584 sq. ft.
305 W 150th Street #410, Manhattan, NY 10039
MLS# RLS20096514Listed by: BROWN HARRIS STEVENS RESIDENTIAL SALES LLC - New
 $3,350,000Active4 beds 3 baths2,072 sq. ft.
371 W 123rd Street #PHA, Manhattan, NY 10027
MLS# RLS20096517Listed by: BROWN HARRIS STEVENS RESIDENTIAL SALES LLC - New
 $199,000Active2 beds 1 baths
2190 Boston Road #2C, Bronx, NY 10462
MLS# RLS20096518Listed by: LOFTEY GROUP LLC - New
 $690,000Active2 beds 1 baths800 sq. ft.
3 W 122nd Street #4-D, Manhattan, NY 10027
MLS# RLS20096519Listed by: BOHEMIA REALTY GROUP LLC - Open Sun, 12 to 2pmNew
 $699,000Active2 beds 1 baths
509 W 122nd Street #3, Manhattan, NY 10027
MLS# RLS20096532Listed by: BROWN HARRIS STEVENS RESIDENTIAL SALES LLC - New
 $1,325,000Active2 beds 1 baths1,265 sq. ft.
411 E 53rd Street #14B, Manhattan, NY 10022
MLS# RLS20096533Listed by: DOUGLAS ELLIMAN REAL ESTATE - New
 $2,150,000Active2 beds 2 baths1,100 sq. ft.
45 W 67th Street #22B, Manhattan, NY 10023
MLS# RLS20096539Listed by: DOUGLAS ELLIMAN REAL ESTATE - Coming SoonOpen Sun, 12:30 to 3:30pm
 $848,000Coming Soon3 beds 1 baths
19822 29th Avenue, Flushing, NY 11358
MLS# 1001719Listed by: DANIEL GALE SOTHEBYS INTL RLTY - New
 $1,100,000Active3 beds 3 baths1,344 sq. ft.
2261 Coney Island Avenue, Brooklyn, NY 11223
MLS# 1007279Listed by: EXP REALTY - New
 $1,388,000Active6 beds 4 baths2,080 sq. ft.
93-12 89th Avenue, Woodhaven, NY 11421
MLS# 1009178Listed by: EXP REALTY - New
 $459,000Active2 beds 1 baths750 sq. ft.
82-63 Langdale Street #2nd Floor, New Hyde Park, NY 11040
MLS# 1011058Listed by: LIFCHA ZWEIG - New
 $1,199,000Active3 beds 3 baths1,060 sq. ft.
2612 E 28th Street, Brooklyn, NY 11235
MLS# 1011070Listed by: BERGEN BASIN REALTY LLC - New
 $699,999Active3 beds 2 baths1,243 sq. ft.
3350 Fish Avenue, Bronx, NY 10469
MLS# 1011102Listed by: WEICHERT REALTORS LANGER HOMES - New
 $1,180,000Active-- beds 3 baths2,070 sq. ft.
2678 East 29th Street, Brooklyn, NY 11235
MLS# 502139Listed by: PROBASE REAL ESTATE - New
 $850,000Active4 beds 2 baths704 sq. ft.
1390 West 7th Street, Brooklyn, NY 11204
MLS# 502140Listed by: RE/MAX EDGE - New
 $359,000Active2 beds 1 baths1,100 sq. ft.
209-15 18th Avenue #4K, Bayside, NY 11360
MLS# 1010342Listed by: GREENE REALTY GROUP - New
 $1,199,000Active-- beds -- baths3,200 sq. ft.
1094 Longfellow Avenue, Bronx, NY 10459
MLS# 1010980Listed by: YOURHOMESOLD GUARANTEED REALTY - New
 $980,000Active3 beds 3 baths1,392 sq. ft.
193 Forbell Street, Brooklyn, NY 11208
MLS# 1011011Listed by: RE/MAX EDGE - Open Sat, 12 to 3pmNew
 $1,499,000Active8 beds 4 baths900 sq. ft.
11551 208th Street, Cambria Heights, NY 11411
MLS# 1011014Listed by: AKCESS24HOMES INC - Open Tue, 11am to 12pmNew
 $764,500Active3 beds 2 baths1,572 sq. ft.
13019 116th Avenue, South Ozone Park, NY 11420
MLS# 1011031Listed by: UTOPIA REAL ESTATE - New$3,999,998Active4 beds 5 baths7,313 sq. ft.
30 Aviva Court, , NY
MLS# A12027273Listed by: COLDWELL BANKER REALTY - Open Sat, 12 to 2pmNew
 $253,000Active1 beds 1 baths700 sq. ft.
204-12 35th Avenue #254, Bayside, NY 11361
MLS# 1009070Listed by: PROAGENT REALTY GOLD COAST LLC - New
 $899,999Active4 beds 2 baths1,907 sq. ft.
2752 Fish Avenue, Bronx, NY 10469
MLS# 1009677Listed by: BAEZ REAL ESTATE, INC. - Open Sat, 12 to 2pmNew
 $517,010Active1 beds 1 baths533 sq. ft.
124-28 Queens Boulevard #9B, Kew Gardens, NY 11415
MLS# 1010386Listed by: BERKSHIRE HATHAWAY - Open Sat, 12 to 2pmNew
 $574,332Active1 beds 1 baths611 sq. ft.
124-28 Queens Boulevard #10C, Kew Gardens, NY 11415
MLS# 1010403Listed by: BERKSHIRE HATHAWAY - Open Sat, 12 to 2pmNew
 $682,176Active2 beds 1 baths704 sq. ft.
124-28 Queens Boulevard #10A, Kew Gardens, NY 11415
MLS# 1010476Listed by: BERKSHIRE HATHAWAY - Open Sat, 12 to 2pmNew
 $681,172Active2 beds 1 baths704 sq. ft.
124-28 Queens Boulevard #12A, Kew Gardens, NY 11415
MLS# 1010506Listed by: BERKSHIRE HATHAWAY - Open Sat, 12 to 2pmNew
 $662,112Active2 beds 1 baths704 sq. ft.
124-28 Queens Boulevard #8A, Kew Gardens, NY 11415
MLS# 1010526Listed by: BERKSHIRE HATHAWAY - Open Sat, 12 to 2pmNew
 $547,497Active1 beds 1 baths533 sq. ft.
124-28 Queens Boulevard #PH-B, Kew Gardens, NY 11415
MLS# 1010694Listed by: BERKSHIRE HATHAWAY - Coming Soon
 $1,298,000Coming Soon5 beds 3 baths
79-31 Langdale Street, New Hyde Park, NY 11040
MLS# 1010960Listed by: SIGNATURE PREMIER PROPERTIES - New
 $959,000Active4 beds 3 baths2,720 sq. ft.
4133 Digney Avenue, Bronx, NY 10466
MLS# 1010964Listed by: SIGNATURE PREMIER PROPERTIES - New
 $900,000Active-- beds -- baths2,308 sq. ft.
881 Longfellow Avenue, Bronx, NY 10474
MLS# 1010972Listed by: YOURHOMESOLD GUARANTEED REALTY - New$1,319,934Active2 beds 2 baths1,454 sq. ft.
Zona Hotelera Zona Hotelera Cancun B-1031 #B-1031, ,
MLS# A11990745Listed by: DOMI REAL ESTATE ADVISORS  $1,499,000Active9 beds 7 baths3,756 sq. ft.
933 Cleveland Street #00000000000000000, Brooklyn, NY 11208
MLS# 951598Listed by: OUR COMMUNITY REALTY LTD $1,499,000Active9 beds 7 baths3,723 sq. ft.
929 Cleveland Street, Brooklyn, NY 11208
MLS# 951599Listed by: OUR COMMUNITY REALTY LTD- New$85,000Active3 beds 3 baths828 sq. ft.
Calle 3 A # 22-76 S Manzana 3 #8, ,
MLS# A11572893Listed by: ONE STOP REALTY - New
 $699,000Active2 beds 2 baths1,710 sq. ft.
285 Adams Avenue, Staten Island, NY 10306
MLS# 2603229Listed by: M HOLMES REALTY CORP. - New
 $798,000Active3 beds 3 baths1,152 sq. ft.
1349 East 103rd Street, Brooklyn, NY 11236
MLS# 502127Listed by: RE/MAX EDGE - New
 $798,000Active4 beds 2 baths1,544 sq. ft.
8A Brighton 10th Court, Brooklyn, NY 11235
MLS# 502132Listed by: RE/MAX EDGE - New
 $449,000Active1 beds 1 baths453 sq. ft.
935 57th Street #3A, Brooklyn, NY 11219
MLS# 502133Listed by: TIGER REALTY - Open Sat, 12 to 2pmNew
 $749,999Active3 beds 2 baths1,190 sq. ft.
1678 Brooklyn Avenue, Brooklyn, NY 11210
MLS# 1009037Listed by: REAL BROKER NY LLC - Open Sat, 12 to 1:30pmNew
 $868,000Active4 beds 3 baths1,230 sq. ft.
254-23 83rd Avenue, Glen Oaks, NY 11004
MLS# 1010328Listed by: EXP REALTY - New
 $798,000Active4 beds 2 baths1,544 sq. ft.
8A Brighton 10th Court, Brooklyn, NY 11223
MLS# 1010919Listed by: RE/MAX EDGE - New
 $865,000Active8 beds 3 baths1,764 sq. ft.
850 E 223rd Street, Bronx, NY 10466
MLS# 998816Listed by: EXIT REALTY DKC - New$1,395,000Active2 beds 1 baths
199 Prince Street #18, Manhattan, NY 10012
MLS# RLS20096471Listed by: DOUGLAS ELLIMAN REAL ESTATE - Open Sun, 12 to 1:30pmNew
 $700,000Active2 beds 1 baths
137 E 36th Street #13C, Manhattan, NY 10016
MLS# RLS20096475Listed by: COMPASS - New
 $7,000,000Active14 beds 7 baths15,185 sq. ft.
223 E 2nd Street, Manhattan, NY 10009
MLS# RLS20096476Listed by: COMPASS - New
 $8,000,000Active3 beds 4 baths309,608 sq. ft.
1 W 72nd Street #93/94, Manhattan, NY 10023
MLS# RLS20096477Listed by: SOTHEBYS INTERNATIONAL REALTY - New
 $3,195,000Active6 beds 4 baths3,200 sq. ft.
90 Ryerson Street, Brooklyn, NY 11205
MLS# RLS20096478Listed by: COMPASS - New
 $465,000Active2 beds 1 baths
65-15 38th Avenue #5K, Woodside, NY 11377
MLS# 1010913Listed by: ALL AREA BROKERAGE INC - New
 $9,995,000Active5 beds 5 baths5,346 sq. ft.
222 E 61st Street, Manhattan, NY 10065
MLS# RLS20096247Listed by: COMPASS - Open Sun, 3 to 4pmNew
 $1,095,000Active2 beds 2 baths1,400 sq. ft.
415 E 52nd Street #3-EB, Manhattan, NY 10022
MLS# RLS20096469Listed by: STEPHEN P WALD REAL ESTATE ASSOCIATES INC - New
 $879,000Active2 beds 2 baths916 sq. ft.
13617 Maple Avenue #5A, Flushing, NY 11355
MLS# 1010885Listed by: FOUR SEASONS OF NY INC - Coming Soon
 $799,900Coming Soon3 beds 3 baths
103-07 126th Street, Richmond Hill S., NY 11419
MLS# 1010742Listed by: KEYSTONE REALTY USA CORP - Open Sun, 11am to 1pmNew
 $1,299,000Active3 beds 2 baths1,460 sq. ft.
1488 E 26th Street, Brooklyn, NY 11210
MLS# 2603228Listed by: DINAPOLI REALTY ADVISORS - Open Thu, 12 to 1pmNew
 $359,000Active-- beds 1 baths
201 W 70th Street #2L, Manhattan, NY 10023
MLS# RLS20096466Listed by: DOUGLAS ELLIMAN REAL ESTATE - New
 $1,825,000Active1 beds 1 baths916 sq. ft.
1 Wall Street #816, Manhattan, NY 10004
MLS# RLS20096467Listed by: BROWN HARRIS STEVENS RESIDENTIAL SALES LLC - New
 $385,000Active-- beds 1 baths
310 E 70th Street #6H, Manhattan, NY 10021
MLS# RLS20096459Listed by: ARGO RESIDENTIAL - New
 $879,000Active2 beds 1 baths
149 Sullivan Street #4B, Manhattan, NY 10012
MLS# RLS20096462Listed by: NESTAPPLE INC - New
 $299,000Active1 beds 1 baths
124-16 84th Rd #2C, Kew Gardens, NY 11415
MLS# 1010874Listed by: CORCORAN - New
 $1,199,999Active5 beds 2 baths2,172 sq. ft.
70-29 68 Th Place, Glendale, NY 11385
MLS# 1010875Listed by: KELLER WILLIAMS REALTY ELITE - New
 $1,180,000Active6 beds 3 baths1,404 sq. ft.
234 Dahill Road, Brooklyn, NY 11218
MLS# 1010876Listed by: EXIT REALTY CONTINENTAL - New
 $320,000Active1 beds 1 baths700 sq. ft.
33-15 81st Street #5D, Jackson Heights, NY 11372
MLS# 1010883Listed by: HATUKA PROPERTIES INC - New
 $569,000Active2 beds 2 baths1,084 sq. ft.
10607 Northern Boulevard #3A, Corona, NY 11368
MLS# 1010890Listed by: UNITED REAL ESTATE FORTUNE - New
 $780,000Active1 beds 1 baths772 sq. ft.
13103 40th Road #9N, Flushing, NY 11354
MLS# 1011435Listed by: FULTONEX REALTY LLC - New
 $355,000Active1 beds 1 baths
45-14 43rd Street #4D, Queens, NY 11104
MLS# RLS20096442Listed by: BROWN HARRIS STEVENS RESIDENTIAL SALES LLC - New
 $7,750,000Active3 beds 4 baths2,939 sq. ft.
22 Bond Street #C, Manhattan, NY 10012
MLS# RLS20096443Listed by: CORCORAN GROUP - New
 $675,000Active1 beds 1 baths651 sq. ft.
226 Hart Street #3B, Brooklyn, NY 11206
MLS# RLS20096445Listed by: CORCORAN GROUP - Open Wed, 8 to 8:30pmNew
 $695,000Active1 beds 1 baths
520 E 72nd Street #17C, Manhattan, NY 10021
MLS# RLS20096450Listed by: DOUGLAS ELLIMAN REAL ESTATE - New
 $1,200,000Active0.52 Acres
486 Holten Avenue, Staten Island, NY 10309
MLS# 2603227Listed by: EXP REALTY - New
 $1,299,990Active4 beds 3 baths
115-08 150th Avenue, South Ozone Park, NY 11420
MLS# 1010783Listed by: ELITE REALTY OF USA INC - New
 $1,200,000Active5 beds 2 baths2,600 sq. ft.
13510 Farmers Boulevard, Jamaica, NY 11434
MLS# 1010855Listed by: NICHOLAS A. MILLER - New
 $1,999,000Active7 beds 4 baths3,660 sq. ft.
1153 71st Street, Brooklyn, NY 11228
MLS# 502123Listed by: BROOKLYN4U RLTYOF DYKERHEIGHTS - New
 $639,000Active1 beds 2 baths830 sq. ft.
63-36 99th Street #3K, Rego Park, NY 11374
MLS# 1007523Listed by: DANIEL GALE SOTHEBYS INTL RLTY - New
 $725,000Active1 beds 1 baths618 sq. ft.
31-65 14th Street #3F, Astoria, NY 11106
MLS# 1009199Listed by: DOUGLAS ELLIMAN REAL ESTATE - New
 $699,000Active1 beds 1 baths629 sq. ft.
31-65 14th Street #2R, Astoria, NY 11106
MLS# 1009216Listed by: DOUGLAS ELLIMAN REAL ESTATE - New
 $450,000Active2 beds 1 baths868 sq. ft.
11129 147th Street, Jamaica, NY 11435
MLS# 1010839Listed by: NICHOLAS A. MILLER - New
 $4,100,000Active8 beds 6 baths1,992 sq. ft.
80 Carnegie Avenue, Staten Island, NY 10314
MLS# 2603221Listed by: COMPASS REALTY CENTRAL INC. - Open Sun, 1 to 3pmNew
 $699,999Active3 beds 3 baths1,607 sq. ft.
185 Roosevelt Avenue, Staten Island, NY 10314
MLS# 2603222Listed by: DITOMMASO REAL ESTATE - New
 $729,000Active3 beds 2 baths1,054 sq. ft.
9 Oceanview Avenue, Staten Island, NY 10312
MLS# 2603223Listed by: DITOMMASO REAL ESTATE - New
 $874,888Active3 beds 2 baths2,542 sq. ft.
234 Atlantic Avenue, Staten Island, NY 10305
MLS# 2603224Listed by: RANASINGHE NIROSH - New
 $1,299,998Active4 beds 3 baths2,400 sq. ft.
1 Mcclean Avenue, Staten Island, NY 10305
MLS# 2603225Listed by: HOMES R US REALTY OF NY, INC. - Open Sat, 12 to 2pmNew
 $899,999Active3 beds 3 baths1,175 sq. ft.
103 Cedar Avenue, Staten Island, NY 10305
MLS# 2603226Listed by: HOMES R US REALTY OF NY, INC.  $2,235,000Pending2 beds 2 baths1,331 sq. ft.
400 E 84th Street #28A, Manhattan, NY 10028
MLS# RLS20096427Listed by: CORCORAN SUNSHINE MARKETING GROUP- New
 $5,250,000Active-- beds 5 baths4,320 sq. ft.
216 3rd Avenue, Manhattan, NY 10003
MLS# RLS20096423Listed by: AA MANAGEMENT NYC LLC - New
 $889,000Active-- beds 1 baths612 sq. ft.
315 Seventh Avenue #17C, Manhattan, NY 10001
MLS# RLS20096425Listed by: KELLER WILLIAMS NYC - New
 $699,000Active3 beds 2 baths
5800 Arlington Avenue #18-J, Bronx, NY 10471
MLS# RLS20096426Listed by: R NEW YORK - Open Sun, 2 to 3pmNew
 $1,995,000Active3 beds 2 baths1,512 sq. ft.
391 Clinton Street #1B, Brooklyn, NY 11231
MLS# RLS20096434Listed by: COMPASS - New
 $975,000Active1 beds 1 baths791 sq. ft.
100 United Nations Plaza #19C, Manhattan, NY 10017
MLS# RLS20096436Listed by: COMPASS - New
 $3,450,000Active3 beds 3 baths
45 E 89th Street #12E, Manhattan, NY 10128
MLS# RLS20096438Listed by: CORCORAN GROUP - Open Thu, 6 to 7pm
 $1,349,999Active-- beds -- baths2,312 sq. ft.
85-19 91st Street, Woodhaven, NY 11421
MLS# 1004532Listed by: E REALTY INTERNATIONAL CORP - New$489,999Active3 beds 2 baths1,200 sq. ft.
1263 East 80th Street #G1, Brooklyn, NY 11236
MLS# 502119Listed by: BEST REALTY PROFESSIONALS - New
 $2,090,000Active-- beds -- baths2,958 sq. ft.
9904 42nd Avenue, Corona, NY 11368
MLS# 1010771Listed by: CANAAN REALTY INTERNATIONAL - Coming SoonOpen Sat, 11am to 1pm
 $1,798,000Coming Soon8 beds 6 baths
59-17 Kissena Boulevard, Flushing, NY 11355
MLS# 1010785Listed by: B SQUARE REALTY - Coming Soon
 $1,199,000Coming Soon7 beds 4 baths
13952 86th Road, Jamaica, NY 11435
MLS# 1010792Listed by: CENTURY 21 MILESTONE TEAM RLTY - New
 $1,099,000Active5 beds 5 baths2,685 sq. ft.
164-15 104th Road, Jamaica, NY 11433
MLS# 1010794Listed by: KELLER WILLIAMS REALTY GREATER - New
 $2,850,000Active-- beds -- baths3,120 sq. ft.
4902 Church Avenue, Brooklyn, NY 11203
MLS# 1010806Listed by: SWEET KEY REALTY GROUP INC - New
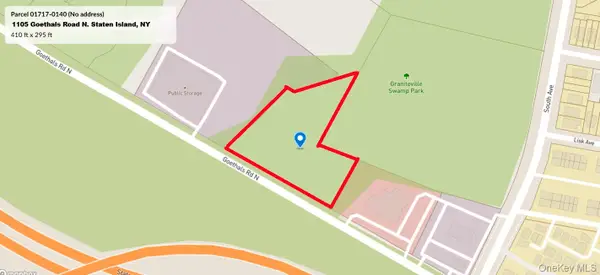 $495,000Active2.27 Acres
11105 N Goethals Road, Staten Island, NY 10303
MLS# 1010828Listed by: A CLASS REALTY - New
 $1,295,000Active2 beds 2 baths1,050 sq. ft.
630 1st Avenue #33K, Manhattan, NY 10016
MLS# RLS20084628Listed by: COMPASS - Open Sun, 1 to 2:30pmNew
 $1,000,000Active1 beds 1 baths819 sq. ft.
684 Washington Street #BA, Manhattan, NY 10014
MLS# RLS20096413Listed by: CORCORAN GROUP - New
 $428,000Active1 beds 1 baths96,000 sq. ft.
76-10 34th Avenue #3A, Queens, NY 11372
MLS# RLS20096417Listed by: CORE GROUP MARKETING LLC - New
 $299,000Active-- beds 1 baths
99 Bank Street #2A, Manhattan, NY 10014
MLS# RLS20096418Listed by: COMPASS - New
 $599,999Active1 beds 1 baths
255 Eastern Parkway #E12, Brooklyn, NY 11238
MLS# RLS20096422Listed by: DOUGLAS ELLIMAN REAL ESTATE - Open Sat, 1:30 to 3:30pmNew
 $548,000Active-- beds 1 baths818 sq. ft.
90-14 51st Avenue #1A, Elmhurst, NY 11373
MLS# 1009866Listed by: WINZONE REALTY INC
Local realty services provided by:CENTURY 21 Awaye Realty, CENTURY 21 Monticello Realty, CENTURY 21 Homefront, CENTURY 21 AllPoints Realty
This information is not verified for authenticity or accuracy and is not guaranteed and may not reflect all real estate activity in the market. © 2026 The Real Estate Board of New York, Inc., All rights reserved. RLS Data display by Coldwell Banker Warburg This advertisement does not suggest that the broker has a listing in this property or properties or that any property is currently available. NY_REBNY Member Broker: Arlene Waye
Neighborhoods near New York, NY
Zip codes near New York, NY
- 11207 homes for sale
- 11208 homes for sale
- 11212 homes for sale
- 11221 homes for sale
- 11233 homes for sale
- 11237 homes for sale
- 11373 homes for sale
- 11374 homes for sale
- 11375 homes for sale
- 11378 homes for sale
- 11379 homes for sale
- 11385 homes for sale
- 11414 homes for sale
- 11415 homes for sale
- 11416 homes for sale
- 11417 homes for sale
- 11418 homes for sale
- 11419 homes for sale
- 11420 homes for sale
- 11421 homes for sale
Popular searches near New York, NY
- Briarwood homes for sale
- Corona homes for sale
- Elmhurst homes for sale
- Flushing homes for sale
- Forest Hills homes for sale
- Glendale homes for sale
- Howard Beach homes for sale
- Jackson Heights homes for sale
- Kew Gardens homes for sale
- Maspeth homes for sale
- Middle Village homes for sale
- Ozone Park homes for sale
- Rego Park homes for sale
- Richmond Hill homes for sale
- Ridgewood homes for sale
- South Ozone Park homes for sale
- South Richmond Hill homes for sale
- Sunnyside homes for sale
- Woodhaven homes for sale
- Woodside homes for sale
Protect your home and budget from life's surprises with an Assurant Home Warranty, backed by a partner that supports you through every step of homeownership. Explore Plans.
©2026 Century 21 Real Estate LLC. All rights reserved. CENTURY 21®, the CENTURY 21 Logo and C21® are service marks owned by Century 21 Real Estate LLC. Century 21 Real Estate LLC fully supports the principles of the Fair Housing Act and the Equal Opportunity Act. Each office is independently owned and operated. Listing information is deemed reliable but not guaranteed accurate.