- 28 Palms, Fremont homes for sale
- Ardenwood, Fremont homes for sale
- Blacow, Fremont homes for sale
- Brookvale, Fremont homes for sale
- Cabrillo, Fremont homes for sale
- Cameron Hills, Fremont homes for sale
- Centerville, Fremont homes for sale
- Central, Fremont homes for sale
- Cherry, Fremont homes for sale
- Glenmoor, Fremont homes for sale
- Grimmer, Fremont homes for sale
- Irvington, Fremont homes for sale
- Kimber, Fremont homes for sale
- Lakes And Birds, Fremont homes for sale
- Newark, Newark homes for sale
- Niles, Fremont homes for sale
- Northgate, Fremont homes for sale
- Parkmont, Fremont homes for sale
- South Sundale, Fremont homes for sale
- Sundale, Fremont homes for sale
Newark, CA - homes for sale
139 of 139 results displayed
- New
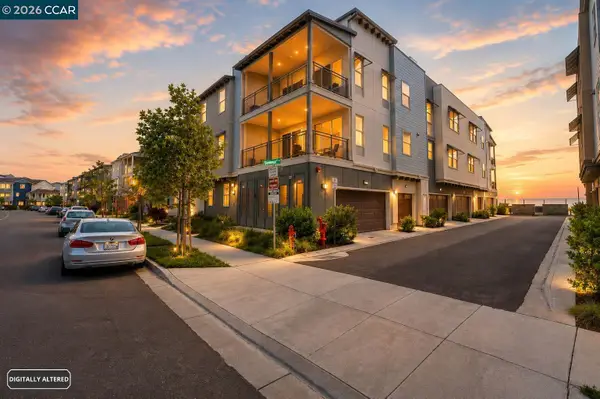
 $899,888Active3 beds 2 baths1,048 sq. ft.
7601 Redbud Ct, Newark, CA 94560
MLS# 41137544Listed by: COLDWELL BANKER REALTY
- New
 $1,099,999Active3 beds 3 baths1,643 sq. ft.
9732 Seawind Way, Newark, CA 94560
MLS# 41136223Listed by: KEENAN HOWARD REALTY, INC. - New
 $1,420,000Active4 beds 4 baths2,402 sq. ft.
9034 Rudder Way, Newark, CA 94560
MLS# 41137318Listed by: OPENDOOR BROKERAGE INC. - New
 $1,200,000Active3 beds 2 baths1,067 sq. ft.
7595 Braidburn Avenue, Newark, CA 94560
MLS# ML82049795Listed by: REDFIN - New
 $939,000Active3 beds 3 baths1,566 sq. ft.
37630 Breakers Rd, Newark, CA 94560
MLS# 41135561Listed by: LEGACY REAL ESTATE & ASSOC. - New
 $1,098,000Active3 beds 2 baths1,100 sq. ft.
6682 Normandy Drive, Newark, CA 94560
MLS# ML82048925Listed by: COMPASS - New
 $1,299,000Active3 beds 2 baths1,382 sq. ft.
6221 Broadway Ave, Newark, CA 94560
MLS# 41137074Listed by: EVERHOME - New
 $1,188,800Active3 beds 3 baths1,856 sq. ft.
6010 Peppertree Ct, Newark, CA 94560
MLS# 41137033Listed by: EVERHOME - New
 $979,999Active3 beds 3 baths1,542 sq. ft.
37626 Cape Cod Road, Newark, CA 94560
MLS# ML82049618Listed by: COLDWELL BANKER REALTY - New
 $990,000Active3 beds 2 baths1,450 sq. ft.
36719 Port Tidewood St, Newark, CA 94560
MLS# 41136666Listed by: COMPASS - New
 $1,850,000Active4 beds 3 baths2,317 sq. ft.
8232 Tanforan Ct, Newark, CA 94560
MLS# 41136967Listed by: EVERHOME - New
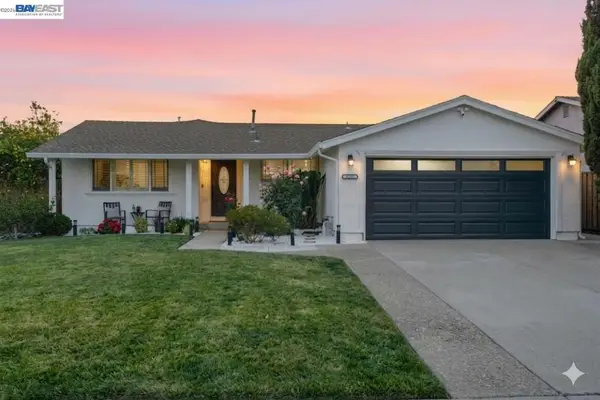
 $1,300,000Active3 beds 2 baths1,606 sq. ft.
36234 Worthing Drive, Newark, CA 94560
MLS# 226039821Listed by: KELLER WILLIAMS REALTY - New
 $650,000Active3 beds 2 baths1,283 sq. ft.
39931 Cedar Blvd #104, Newark, CA 94560
MLS# 41136928Listed by: EXP REALTY OF CALIFORNIA, INC - New
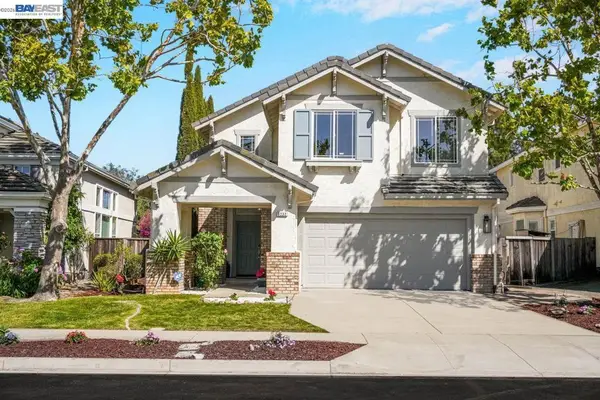
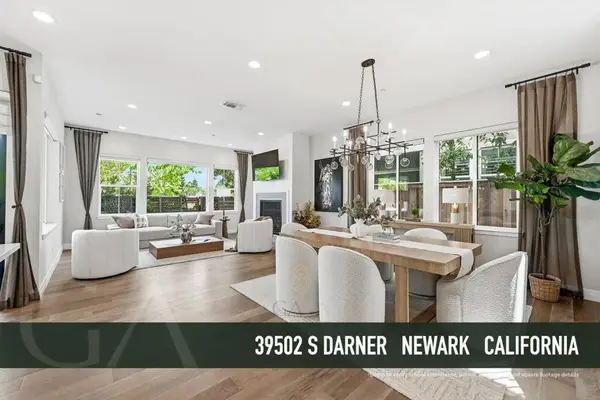 $2,200,000Active5 beds 4 baths3,179 sq. ft.
39502 Darner Drive, Newark, CA 94560
MLS# ML82049475Listed by: GAEA REALTY - New
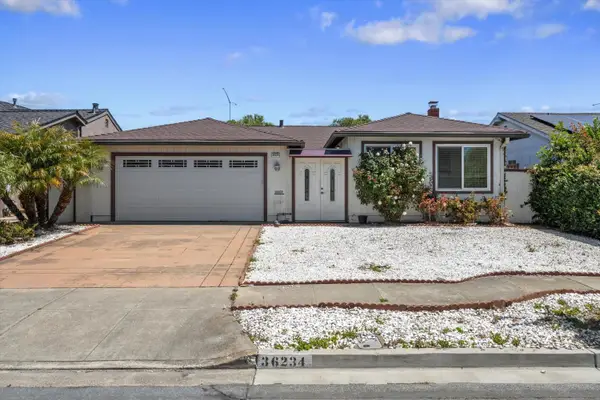
 $999,000Active4 beds 2 baths1,879 sq. ft.
36833 Cherry Street, Newark, CA 94560
MLS# ML82049139Listed by: GRAND REALTY GROUP - New
 $998,000Active3 beds 4 baths1,682 sq. ft.
8533 Seawind Way, Newark, CA 94560
MLS# ML82048988Listed by: BQ REALTY  $1,199,000Pending3 beds 4 baths1,873 sq. ft.
5521 Azalea Way, Newark, CA 94560
MLS# ML82045392Listed by: REDFIN- New
 $560,000Active2 beds 2 baths1,071 sq. ft.
39931 Cedar Blvd #309, Newark, CA 94560
MLS# 41136277Listed by: COMPASS - New
 $1,399,000Active3 beds 3 baths1,632 sq. ft.
8516 Peachtree Ave, Newark, CA 94560
MLS# 41136221Listed by: EVERHOME  $1,230,000Active3 beds 2 baths1,372 sq. ft.
39052 Levi St, Newark, CA 94560
MLS# 41136200Listed by: RE/MAX ACCORD- Open Sun, 2 to 4pm
 $1,398,000Active4 beds 2 baths1,560 sq. ft.
6275 Mockorange Ct, Newark, CA 94560
MLS# 41136205Listed by: SAFI REALTY  $1,650,000Active4 beds 4 baths2,416 sq. ft.
37154 Salt Pond Place, Newark, CA 94560
MLS# ML82048290Listed by: INTERO REAL ESTATE SERVICES $1,150,000Active3 beds 2 baths1,208 sq. ft.
7995 Peachtree Ave, Newark, CA 94560
MLS# 41136117Listed by: COLDWELL BANKER REALTY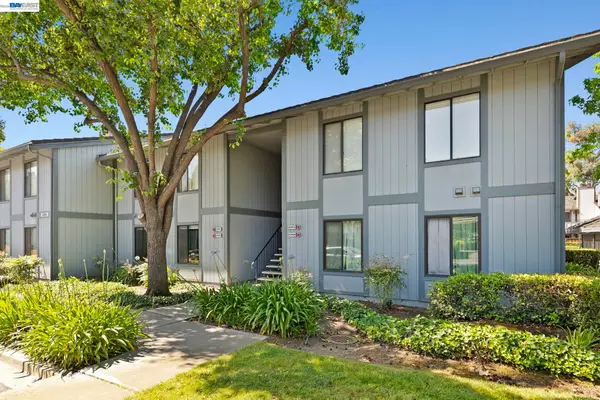 $575,000Active2 beds 1 baths905 sq. ft.
6266 Joaquin Murieta Ave #G, Newark, CA 94560
MLS# 41136086Listed by: COLDWELL BANKER REALTY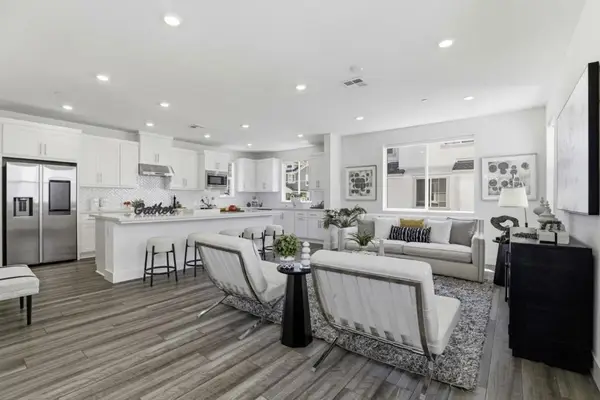 $1,498,000Active3 beds 4 baths2,201 sq. ft.
37183 Sand Bar Place, Newark, CA 94560
MLS# ML82048109Listed by: KELLER WILLIAMS THRIVE $1,900,000Pending3 beds 2 baths2,065 sq. ft.
35547 Blackburn Dr, Newark, CA 94560
MLS# 41135464Listed by: HOME BUYERS REALTY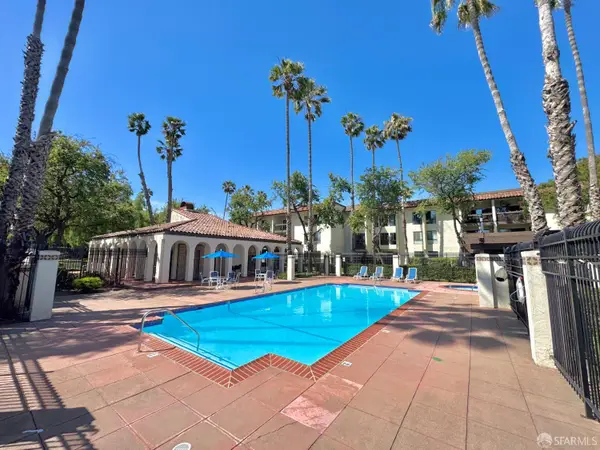 $395,000Pending1 beds 1 baths777 sq. ft.
39975 Cedar Boulevard #330, Newark, CA 94560
MLS# 426122989Listed by: PATHWAY REALTY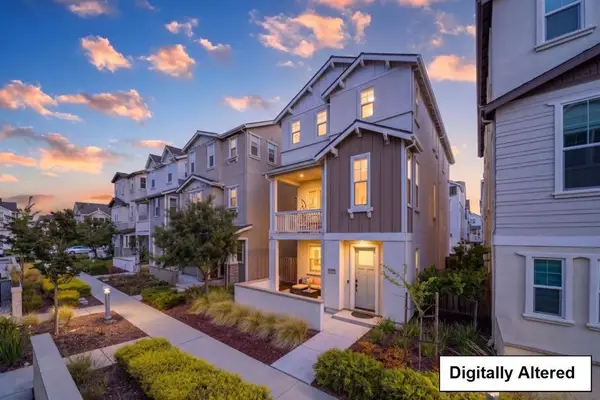 $1,399,000Active4 beds 4 baths2,364 sq. ft.
37517 Bay Crest Road, Newark, CA 94560
MLS# ML82048230Listed by: REAL ESTATE AVENUE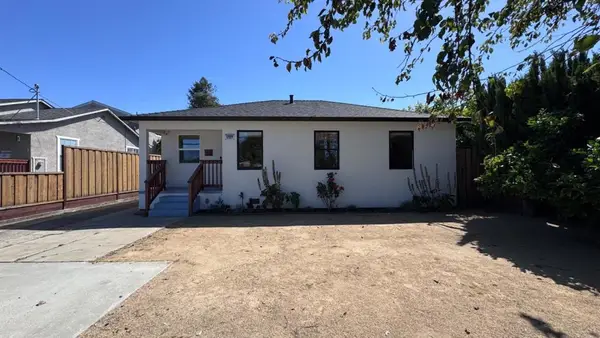 $1,149,000Active4 beds 2 baths1,415 sq. ft.
37029 Olive Street, Newark, CA 94560
MLS# ML82048282Listed by: LUXMORE REAL ESTATE $1,090,000Active3 beds 4 baths1,652 sq. ft.
38912 Spicebush Place, Newark, CA 94560
MLS# ML82047510Listed by: COLDWELL BANKER REALTY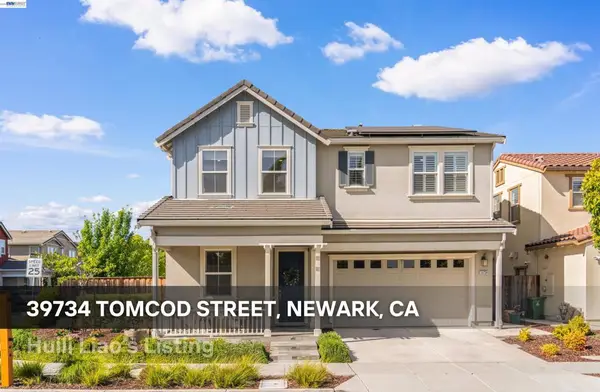 $2,180,000Active4 beds 3 baths2,300 sq. ft.
39734 Tomcod St, Newark, CA 94560
MLS# 41134906Listed by: KELLER WILLIAMS THRIVE $1,890,000Active4 beds 3 baths2,512 sq. ft.
8576 Tailwind Avenue, Newark, CA 94560
MLS# ML82047768Listed by: BQ REALTY $1,175,000Active4 beds 3 baths1,974 sq. ft.
37457 Salt Grass Rd, Newark, CA 94560
MLS# 41135486Listed by: COLDWELL BANKER REALTY $1,160,000Active4 beds 4 baths1,829 sq. ft.
8556 Seawind Way, Newark, CA 94560
MLS# 41135398Listed by: COMPASS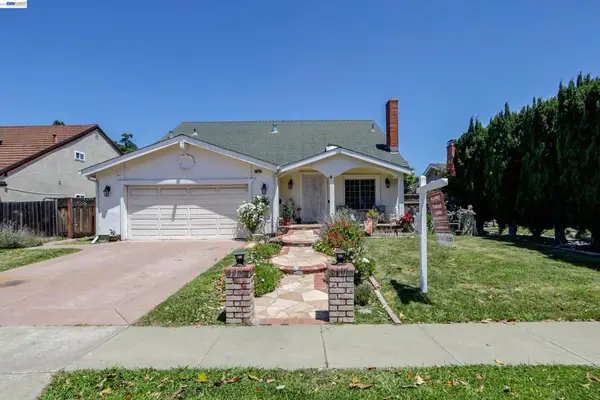 $1,349,888Active4 beds 2 baths1,908 sq. ft.
36276 Cedar Blvd, Newark, CA 94560
MLS# 41135399Listed by: ALLIANCE BAY REALTY $519,500Active2 beds 2 baths1,071 sq. ft.
39865 Cedar Blvd #229, Newark, CA 94560
MLS# 41135299Listed by: LEGACY REAL ESTATE & ASSOC. $1,198,000Active4 beds 2 baths1,438 sq. ft.
35760 Haley St, Newark, CA 94560
MLS# 41135179Listed by: REDFIN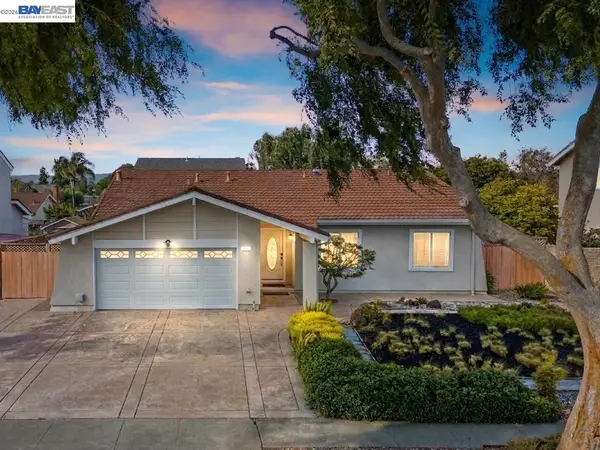 $1,588,000Active4 beds 2 baths1,693 sq. ft.
36288 Tudor Pl, Newark, CA 94560
MLS# 41133847Listed by: COLDWELL BANKER REALTY $1,098,000Active4 beds 4 baths1,694 sq. ft.
37660 Cape Cod Rd, Newark, CA 94560
MLS# 41134817Listed by: COLDWELL BANKER REALTY $1,398,000Pending3 beds 2 baths1,482 sq. ft.
36340 Cypress Point Dr, Newark, CA 94560
MLS# 41134866Listed by: PACIFIC GROWTH REALTY & INV $1,375,000Pending4 beds 2 baths1,476 sq. ft.
36862 Walnut Street, Newark, CA 94560
MLS# 326041292Listed by: COLDWELL BANKER REALTY $899,999Pending3 beds 2 baths1,456 sq. ft.
38982 Primula Terrace, Newark, CA 94560
MLS# ML82047276Listed by: 168 REALTY $1,700,000Active5 beds 5 baths2,886 sq. ft.
9274 Enterprise Dr, Newark, CA 94560
MLS# 41133872Listed by: REDFIN $1,375,000Active4 beds 2 baths1,522 sq. ft.
6328 Narcissus Avenue, Newark, CA 94560
MLS# ML82040837Listed by: COMPASS $949,000Active3 beds 1 baths1,000 sq. ft.
6346 Cotton Avenue, Newark, CA 94560
MLS# ML82047248Listed by: COLDWELL BANKER INFINITI GROUP $1,649,000Active4 beds 3 baths1,678 sq. ft.
38475 Jacaranda Dr, Newark, CA 94560
MLS# 41132603Listed by: SALIMI INVESTMENTS $948,888Pending3 beds 2 baths1,100 sq. ft.
35776 Haley Street, Newark, CA 94560
MLS# 41134629Listed by: REAL BROKERAGE TECHNOLOGIES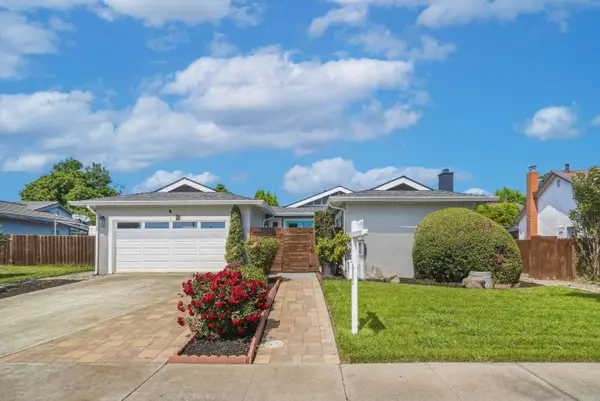 $1,350,000Active3 beds 2 baths1,321 sq. ft.
35664 Conestoga Place, Newark, CA 94560
MLS# ML82047143Listed by: COLDWELL BANKER REALTY $1,988,000Active5 beds 4 baths2,484 sq. ft.
5613 Abington Ct, Newark, CA 94560
MLS# 41134601Listed by: LEGACY REAL ESTATE & ASSOC.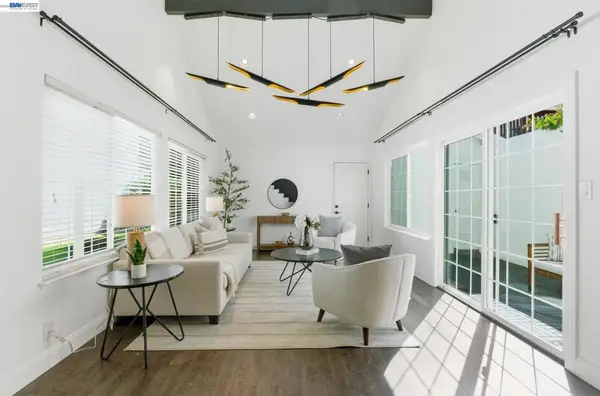 $1,499,000Pending4 beds 3 baths1,818 sq. ft.
36274 Salisbury Dr, Newark, CA 94560
MLS# 41134342Listed by: EVERHOME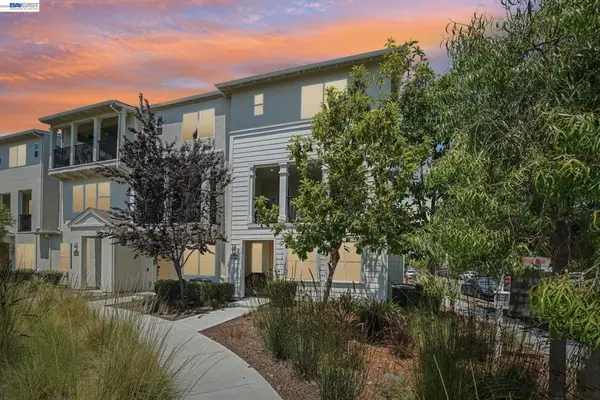 $1,250,000Active4 beds 4 baths2,191 sq. ft.
8550 Boardwalk Way, Newark, CA 94560
MLS# 41134432Listed by: INTERO REAL ESTATE SERVICES $1,399,000Active5 beds 3 baths1,864 sq. ft.
36057 Dalewood Drive, Newark, CA 94560
MLS# ML82046664Listed by: COMPASS $499,000Active2 beds 1 baths941 sq. ft.
6043 Joaquin Murieta Ave #D, Newark, CA 94560
MLS# 41134212Listed by: KW ADVISORS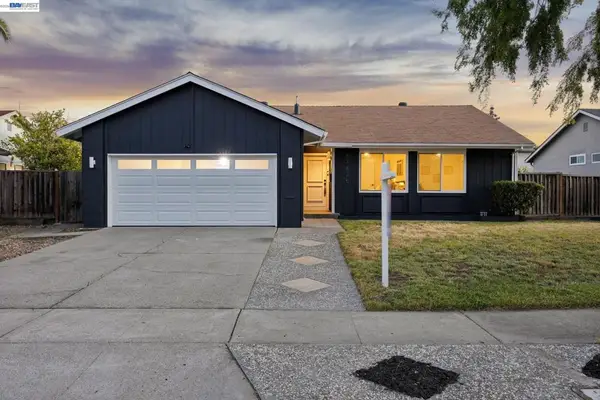 $1,097,000Pending3 beds 2 baths1,166 sq. ft.
37825 Goldenrod Dr, Newark, CA 94560
MLS# 41134128Listed by: SERHANT CALIFORNIA, INC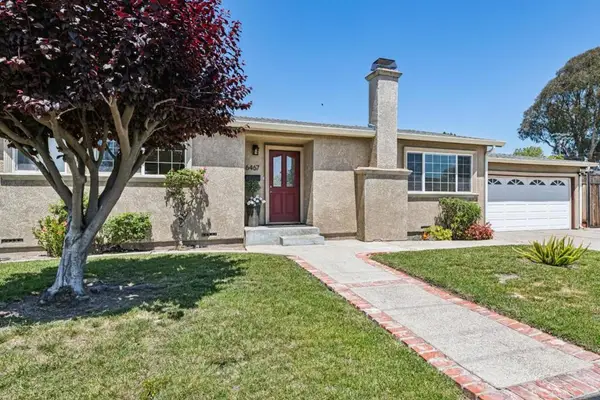 $1,098,000Pending3 beds 2 baths1,100 sq. ft.
6467 Mirabeau Drive, Newark, CA 94560
MLS# ML82046296Listed by: COMPASS $1,460,000Active4 beds 4 baths2,412 sq. ft.
37645 Bay Crest Rd, Newark, CA 94560
MLS# 41133930Listed by: COMPASS $1,452,000Pending4 beds 3 baths2,269 sq. ft.
38463 Amaranto Street, Newark, CA 94560
MLS# ML82046178Listed by: CHARLES R. BALDWIN, BROKER $1,439,000Pending4 beds 2 baths1,512 sq. ft.
5823 Sunrose Avenue, Newark, CA 94560
MLS# ML82046186Listed by: INFINITE REALTY & INVESTMENTS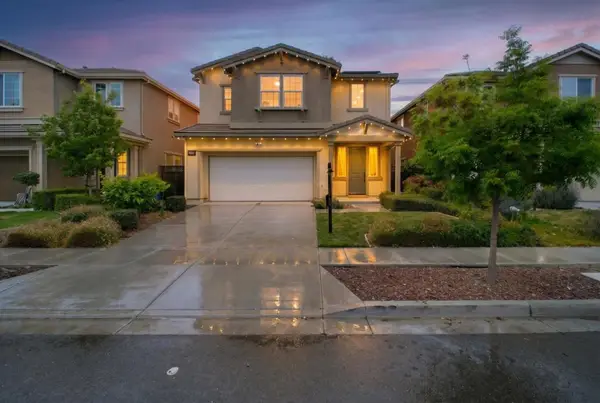 $2,099,990Pending4 beds 3 baths2,496 sq. ft.
6009 Allium Place, Newark, CA 94560
MLS# ML82045715Listed by: KELLER WILLIAMS THRIVE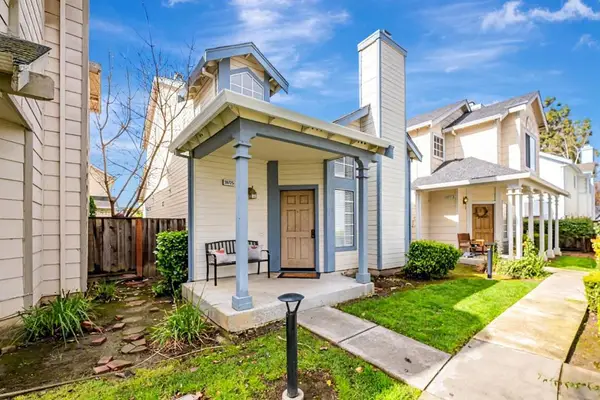 $998,000Active2 beds 2 baths1,388 sq. ft.
39725 Potrero Drive, Newark, CA 94560
MLS# ML82043937Listed by: INTERO REAL ESTATE SERVICES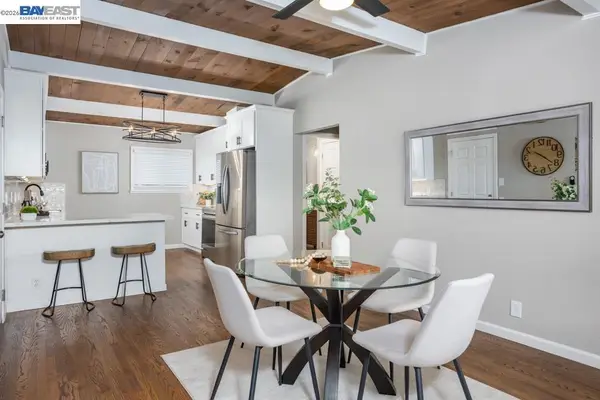 $999,900Active3 beds 2 baths1,288 sq. ft.
36637 Burdick St, Newark, CA 94560
MLS# 41133669Listed by: RE/MAX ACCORD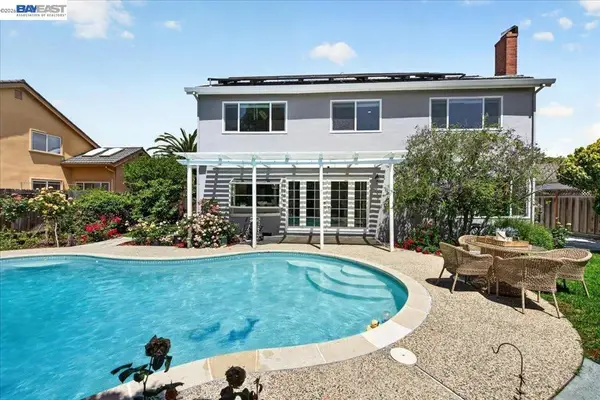 $1,649,000Active4 beds 3 baths2,182 sq. ft.
35345 Cheviot Ct, Newark, CA 94560
MLS# 41133397Listed by: ALLIANCE BAY REALTY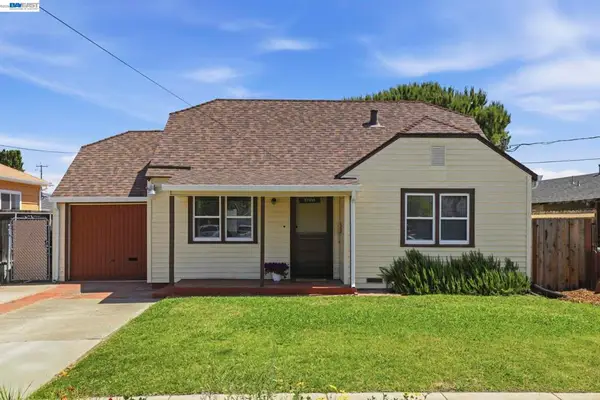 $899,000Active2 beds 1 baths1,187 sq. ft.
37340 Locust St, Newark, CA 94560
MLS# 41133650Listed by: PETROCELLI HOMES REALTY GRP $1,298,000Active4 beds 3 baths2,024 sq. ft.
35421 Cleremont Drive, Newark, CA 94560
MLS# ML82045944Listed by: KELLER WILLIAMS THRIVE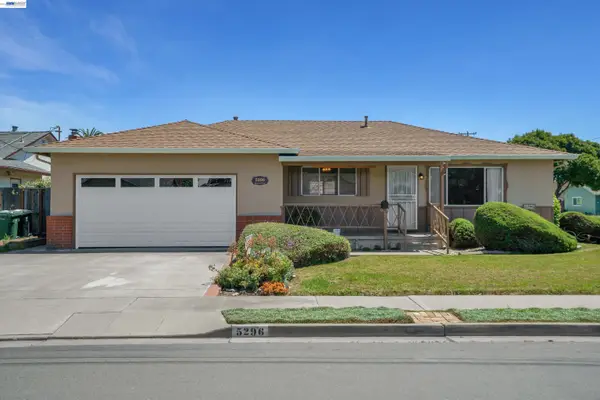 $1,000,000Pending3 beds 2 baths1,309 sq. ft.
5296 Spencer Ct, Newark, CA 94560
MLS# 41133434Listed by: BHG RELIANCE PARTNERS $2,499,900Active4 beds 4 baths3,438 sq. ft.
37338 Fowler St, Newark, CA 94560
MLS# 41133207Listed by: PRIMESTAR REAL ESTATE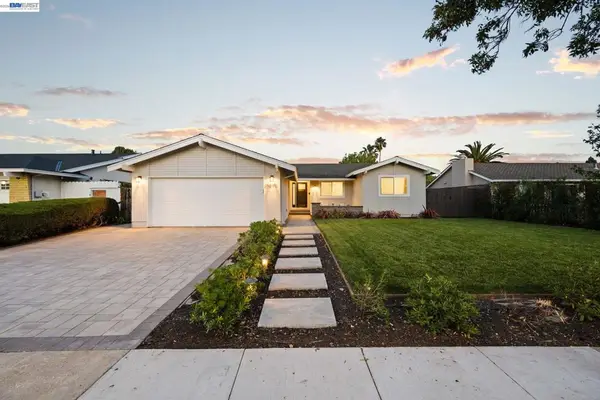 $1,749,000Pending4 beds 2 baths1,697 sq. ft.
35279 Farnham Dr, Newark, CA 94560
MLS# 41132524Listed by: GOLDEN GATE SOTHEBY'S INT'L $674,500Active3 beds 2 baths1,249 sq. ft.
39921 Parada Street #A, Newark, CA 94560
MLS# ML82045409Listed by: LEGACY REAL ESTATE & ASSOCIATES $1,198,000Active4 beds 3 baths1,570 sq. ft.
6435 Normandy Drive, Newark, CA 94560
MLS# 41133104Listed by: COMPASS $1,088,888Pending3 beds 2 baths1,266 sq. ft.
36605 Hafner St, Newark, CA 94560
MLS# 41133090Listed by: INTERO REAL ESTATE SERVICES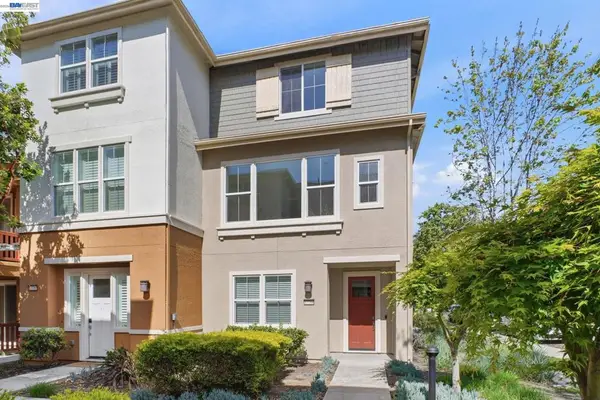 $999,000Pending4 beds 4 baths2,026 sq. ft.
37784 Taro Ter, Newark, CA 94560
MLS# 41133058Listed by: KW ADVISORS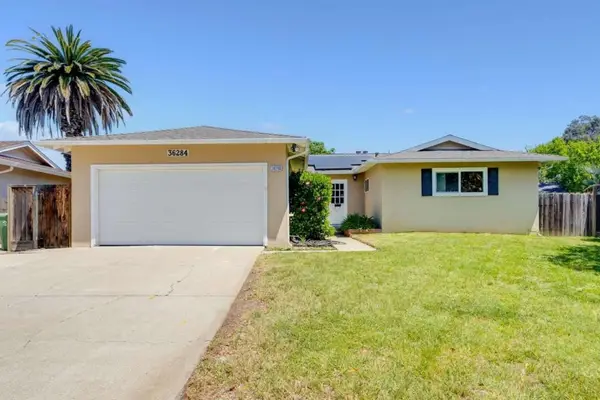 $1,299,000Active4 beds 2 baths1,464 sq. ft.
36284 Birkshire Place, Newark, CA 94560
MLS# ML82045308Listed by: KW ELEVATE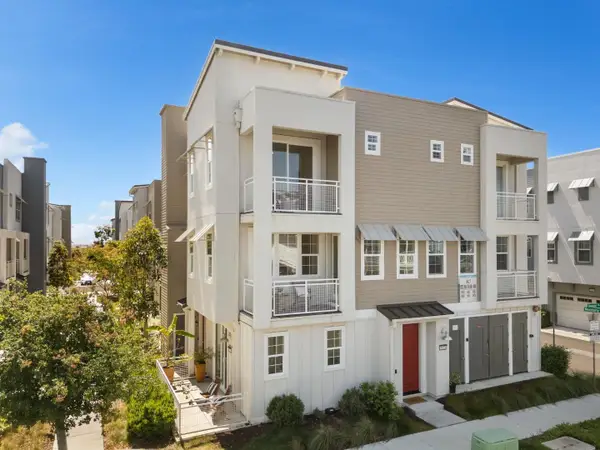 $1,069,000Pending3 beds 4 baths1,682 sq. ft.
9423 Ocean Park Way, Newark, CA 94560
MLS# ML82044920Listed by: LUXURIANT REALTY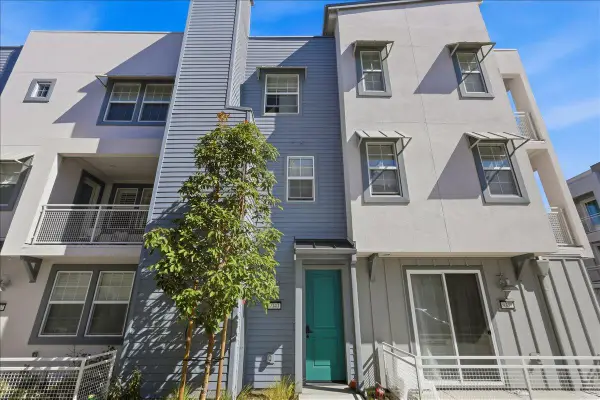 $848,000Active2 beds 3 baths1,424 sq. ft.
9343 Ocean Park Way, Newark, CA 94560
MLS# 226053048Listed by: MOKHA REAL ESTATE $1,850,000Active4 beds 3 baths2,537 sq. ft.
37532 Bay Crest Road, Newark, CA 94560
MLS# ML82044997Listed by: INTERO REAL ESTATE SERVICES $1,130,000Active3 beds 3 baths1,643 sq. ft.
9584 Seawind Way, Newark, CA 94560
MLS# ML82044947Listed by: SUN REAL ESTATE & FINANCIAL SERVICES $1,427,000Active4 beds 4 baths2,056 sq. ft.
38439 Amaranto Street, Newark, CA 94560
MLS# ML82044869Listed by: CHARLES R. BALDWIN, BROKER $1,452,000Active4 beds 4 baths2,284 sq. ft.
38451 Armaranto Street, Newark, CA 94560
MLS# ML82044853Listed by: CHARLES R. BALDWIN, BROKER $1,350,000Active3 beds 2 baths1,456 sq. ft.
36632 Magnolia St, Newark, CA 94560
MLS# 41130758Listed by: INTERO REAL ESTATE SERVICES $1,235,000Active4 beds 4 baths2,018 sq. ft.
37549 Willow Street, Newark, CA 94560
MLS# ML82044560Listed by: CHRISTIE'S INTERNATIONAL REAL ESTATE SERENO $1,450,000Active4 beds 4 baths2,046 sq. ft.
38533 Amaranto Street, Newark, CA 94560
MLS# ML82044420Listed by: CHARLES R. BALDWIN, BROKER $898,888Pending3 beds 3 baths1,503 sq. ft.
5659 Daylily St, Newark, CA 94560
MLS# 41132082Listed by: PREVAIL REAL ESTATE $1,099,000Pending4 beds 4 baths1,694 sq. ft.
8562 Cabana Way, Newark, CA 94560
MLS# ML82044213Listed by: BQ REALTY $825,000Active3 beds 3 baths1,498 sq. ft.
5358 Port Sailwood Dr, Newark, CA 94560
MLS# 41131111Listed by: REDFIN $999,000Active3 beds 2 baths1,114 sq. ft.
37229 Edith St, Newark, CA 94560
MLS# 41131876Listed by: VETTED REAL ESTATE $890,000Pending2 beds 2 baths1,461 sq. ft.
9960 Seawind Way, Newark, CA 94560
MLS# ML82039277Listed by: SIX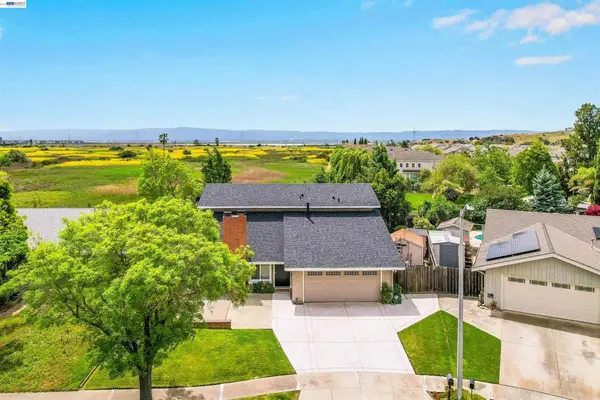 $1,599,000Pending4 beds 3 baths1,953 sq. ft.
8135 Merion Dr, Newark, CA 94560
MLS# 41131293Listed by: EVERHOME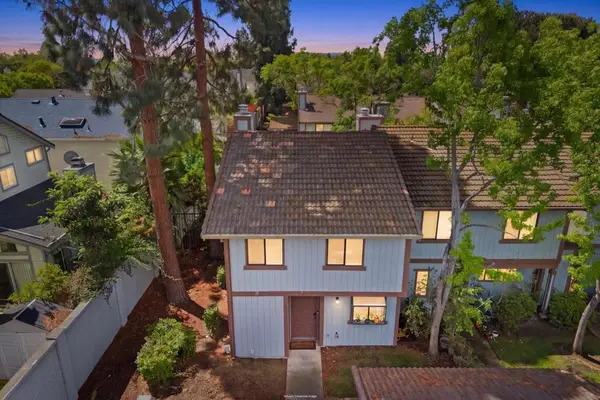 $849,000Active3 beds 3 baths1,394 sq. ft.
6136 Joaquin Murieta Avenue #A, Newark, CA 94560
MLS# ML82043368Listed by: KW BAY AREA ESTATES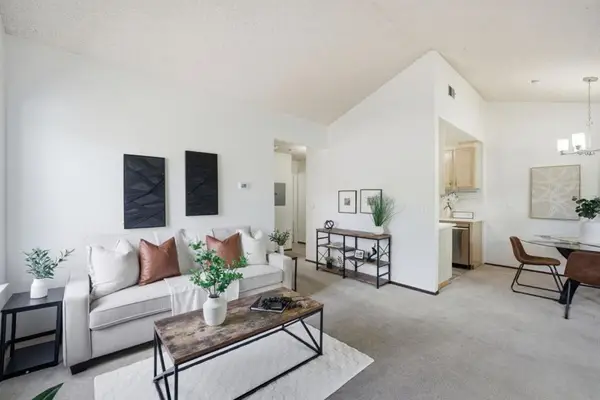 $429,999Active1 beds 1 baths731 sq. ft.
6290 Joaquin Murieta Avenue #D, Newark, CA 94560
MLS# ML82043250Listed by: COMPASS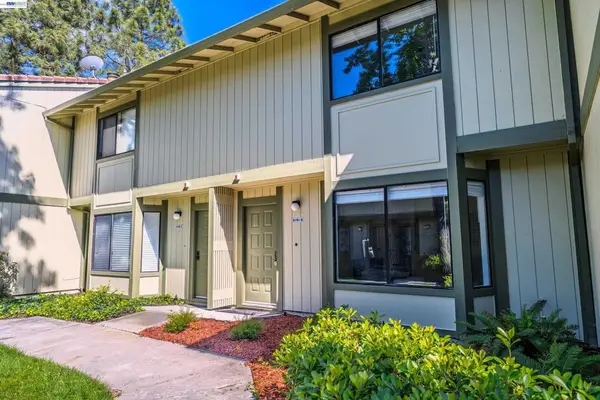 $774,888Active3 beds 3 baths1,456 sq. ft.
6151 Joaquin Murieta Ave #D, Newark, CA 94560
MLS# 41131023Listed by: BAY VALLEY REALTY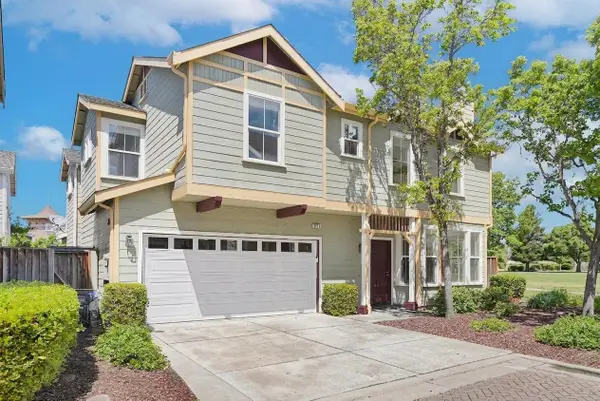 $1,280,000Pending4 beds 3 baths2,009 sq. ft.
7325 Carter Avenue, Newark, CA 94560
MLS# ML82043115Listed by: SH HOMES $1,399,000Pending3 beds 2 baths1,414 sq. ft.
5827 Bellflower Drive, Newark, CA 94560
MLS# ML82040092Listed by: COLDWELL BANKER REALTY $1,125,000Active3 beds 3 baths1,863 sq. ft.
9532 Seawind Way, Newark, CA 94560
MLS# ML82042800Listed by: COMPASS $1,819,000Active4 beds 4 baths2,698 sq. ft.
37231 Sand Bar Place, Newark, CA 94560
MLS# 41130576Listed by: EXCEL REALTY $1,575,000Active4 beds 4 baths2,071 sq. ft.
38379 Amaranto Street, Newark, CA 94560
MLS# ML82042424Listed by: CHARLES R. BALDWIN, BROKER $1,540,000Pending4 beds 4 baths2,269 sq. ft.
38373 Amaranto Street, Newark, CA 94560
MLS# ML82042427Listed by: CHARLES R. BALDWIN, BROKER $799,888Pending3 beds 3 baths1,478 sq. ft.
37723 Cedar Boulevard, Newark, CA 94560
MLS# ML82041305Listed by: COMPASS $999,888Pending3 beds 2 baths1,048 sq. ft.
7601 Redbud Ct, Newark, CA 94560
MLS# 41129135Listed by: LEGACY REAL ESTATE & ASSOC. $1,528,000Active4 beds 4 baths2,248 sq. ft.
8420 Blue Anchor Way, Newark, CA 94560
MLS# ML82042063Listed by: COMPASS $1,557,000Pending4 beds 4 baths2,269 sq. ft.
38475 Amaranto Street, Newark, CA 94560
MLS# ML82042029Listed by: CHARLES R. BALDWIN, BROKER $1,532,000Pending4 beds 4 baths2,187 sq. ft.
38409 Amaranto Street, Newark, CA 94560
MLS# ML82042031Listed by: CHARLES R. BALDWIN, BROKER $1,298,000Active4 beds 3 baths2,041 sq. ft.
8553 Schooner Way, Newark, CA 94560
MLS# 41129748Listed by: INTERO REAL ESTATE SERVICES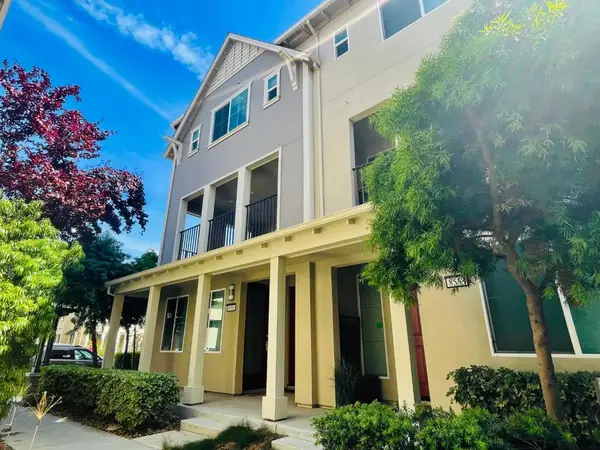 $1,190,000Active4 beds 4 baths2,191 sq. ft.
8551 Boardwalk Way, Newark, CA 94560
MLS# ML82040528Listed by: COLDWELL BANKER REALTY- Coming Soon
 $1,650,000Coming Soon3 beds 2 baths
35515 Farnham Dr, Newark, CA 94560
MLS# 41078295Listed by: COLDWELL BANKER REALTY 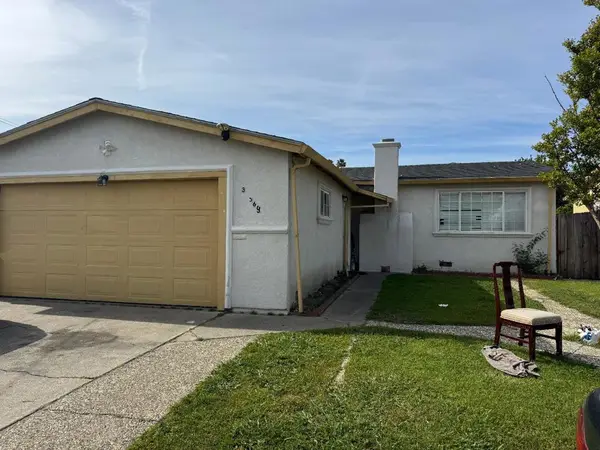 $925,000Active4 beds 3 baths1,073 sq. ft.
36569 Beutke Drive, Newark, CA 94560
MLS# ML82040671Listed by: TRIUMPH PROPERTY SERVICES $2,120,000Active5 beds 3 baths2,708 sq. ft.
38393 Amaryllis Pl, Newark, CA 94560
MLS# 41128730Listed by: GIANT REALTY $1,515,000Active4 beds 4 baths2,354 sq. ft.
9415 Hidden Harbor Way, Newark, CA 94560
MLS# ML82040437Listed by: COMPASS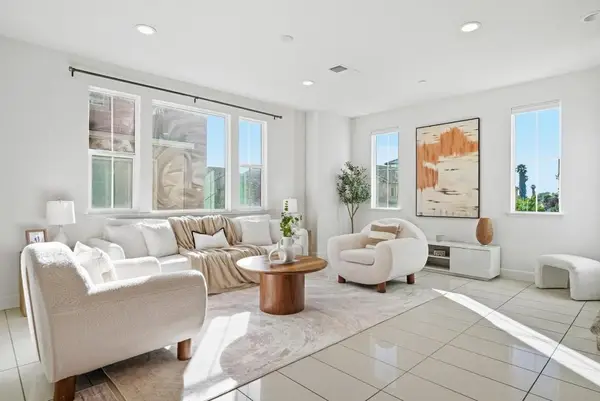 $960,000Active2 beds 3 baths1,500 sq. ft.
5758 Pandorea Terrace, Newark, CA 94560
MLS# ML82040384Listed by: GOODVIEW FINANCIAL & REAL ESTATE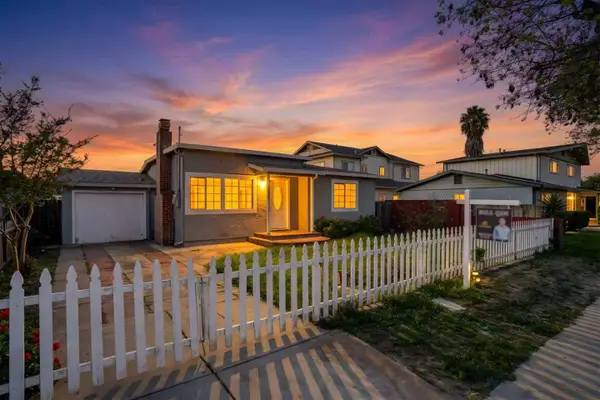 $880,000Pending3 beds 1 baths1,048 sq. ft.
37266 Spruce Street, Newark, CA 94560
MLS# ML82040301Listed by: BQ REALTY $1,558,000Pending4 beds 3 baths1,780 sq. ft.
37052 Poplar Street, Newark, CA 94560
MLS# 226032588Listed by: INTERO REAL ESTATE SERVICES $1,522,000Pending4 beds 4 baths2,093 sq. ft.
38403 Armaranto Street, Newark, CA 94560
MLS# ML82039018Listed by: CHARLES R. BALDWIN, BROKER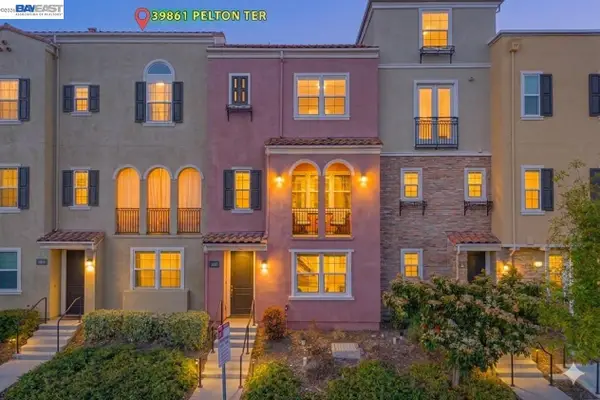 $1,199,000Active4 beds 4 baths2,114 sq. ft.
39861 Pelton Ter, Newark, CA 94560
MLS# 41125794Listed by: COLDWELL BANKER REALTY $1,429,000Pending4 beds 3 baths2,072 sq. ft.
38427 Cedar Boulevard, Newark, CA 94560
MLS# ML82037405Listed by: CHARLES R. BALDWIN, BROKER $498,888Pending2 beds 2 baths1,071 sq. ft.
39843 Cedar Boulevard #227, Newark, CA 94560
MLS# ML82037267Listed by: MJC REALTY $439,888Active1 beds 1 baths777 sq. ft.
39931 Cedar Boulevard #305, Newark, CA 94560
MLS# ML82036244Listed by: LPT REALTY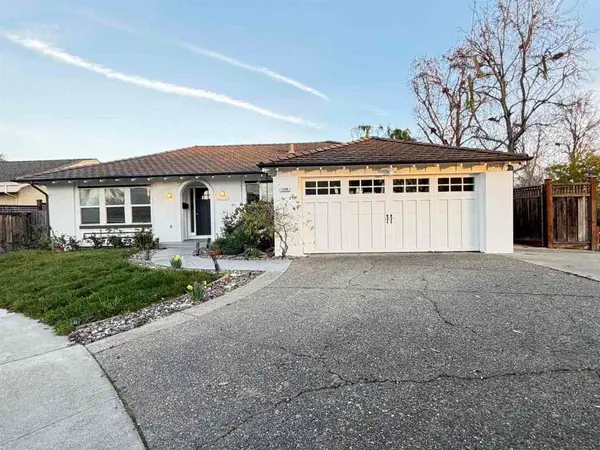 $1,498,000Active3 beds 3 baths1,707 sq. ft.
5298 Sussex Pl, Newark, CA 94560
MLS# 41124081Listed by: INSIGNIA REAL ESTATE $1,389,000Pending4 beds 3 baths2,067 sq. ft.
37640 Hyacinth St, Newark, CA 94560
MLS# ML82034013Listed by: INTERO REAL ESTATE SERVICES $1,499,000Pending4 beds 3 baths1,866 sq. ft.
35415 Blackburn Dr, Newark, CA 94560
MLS# 41122524Listed by: KW ADVISORS $650,000Active3 beds 2 baths1,283 sq. ft.
39997 Cedar Blvd #248, Newark, CA 94560
MLS# 41122532Listed by: HOME ADVANTAGE CORP $1,368,000Pending4 beds 4 baths2,396 sq. ft.
37471 Bay Crest Road, Newark, CA 94560
MLS# ML82035693Listed by: KELLER WILLIAMS THRIVE $2,649,800Pending4 beds 5 baths2,974 sq. ft.
6181 Robertson Avenue, Newark, CA 94560
MLS# ML82031918Listed by: KELLER WILLIAMS THRIVE $1,190,000Pending3 beds 4 baths1,925 sq. ft.
38940 Spicebush Place, Newark, CA 94560
MLS# ML82030533Listed by: KELLER WILLIAMS THRIVE $1,099,000Active4 beds 3 baths1,720 sq. ft.
39965 Potrero Dr, Newark, CA 94560
MLS# 41119466Listed by: HOME ADVANTAGE CORP $1,465,000Pending4 beds 4 baths2,187 sq. ft.
38509 Amaranto Street, Newark, CA 94560
MLS# ML82029078Listed by: CHARLES R. BALDWIN, BROKER $1,460,000Pending4 beds 4 baths2,130 sq. ft.
38515 Amaranto Street, Newark, CA 94560
MLS# ML82029082Listed by: CHARLES R. BALDWIN, BROKER $1,760,000Pending4 beds 4 baths2,624 sq. ft.
38521 Amaranto Street, Newark, CA 94560
MLS# ML82029087Listed by: CHARLES R. BALDWIN, BROKER $1,395,000Pending4 beds 3 baths2,284 sq. ft.
38539 Amaranto Street, Newark, CA 94560
MLS# ML82027838Listed by: CHARLES R. BALDWIN, BROKER $1,385,000Pending4 beds 3 baths2,284 sq. ft.
5502 Higo Way, Newark, CA 94560
MLS# ML82027840Listed by: CHARLES R. BALDWIN, BROKER $1,375,000Pending4 beds 3 baths2,056 sq. ft.
5513 Higo Way, Newark, CA 94560
MLS# ML82026986Listed by: CHARLES R. BALDWIN, BROKER $1,395,000Pending4 beds 3 baths2,284 sq. ft.
5516 Higo Way, Newark, CA 94560
MLS# ML82026062Listed by: CHARLES R. BALDWIN, BROKER $899,000Active3 beds 2 baths1,456 sq. ft.
38976 Primula Ter, Newark, CA 94560
MLS# 41114580Listed by: KELLER WILLIAMS REALTY $3,140,000Active0.48 Acres
Thornton Avenue, Newark, CA 94560
MLS# ML82024594Listed by: STARK COMPLETE REAL ESTATE SERVICES $374,900Pending2 beds 1 baths905 sq. ft.
Address Withheld By Seller, Newark, CA 94560
MLS# ML81484775Listed by: COLDWELL BANKER $518,888Pending3 beds 3 baths1,456 sq. ft.
Address Withheld By Seller, Newark, CA 94560
MLS# ML81470636Listed by: PACIFIC REALTY PARTNERS- $1,250,000Pending5 beds 5 baths4,676 sq. ft.
Address Withheld By Seller, Newark, CA 94560
MLS# ML81447752Listed by: HELP U SELL ACHIEVERS RLTY - $660,000Pending3 beds 2 baths1,240 sq. ft.
Address Withheld By Seller, Newark, CA 94560
MLS# ML81448736Listed by: LEGACY REAL ESTATE & ASSOC. - $635,000Pending3 beds 3 baths1,766 sq. ft.
Address Withheld By Seller, Newark, CA 94560
MLS# ML81451592Listed by: LEGACY REAL ESTATE & ASSOC. - $499,950Pending3 beds 2 baths1,186 sq. ft.
Address Withheld By Seller, Newark, CA 94560
MLS# ML81452655Listed by: COLDWELL BANKER  $639,000Pending3 beds 2 baths1,100 sq. ft.
Address Withheld By Seller, Newark, CA 94560
MLS# ML81467532Listed by: LEGACY REAL ESTATE & ASSOC.
Local realty services provided by:CENTURY 21 Epic, CENTURY 21 Lois Lauer Realty, CENTURY 21 Masters, CENTURY 21 Baldini Real Estate, Inc., CENTURY 21 Sierra Properties
Bay East 2026. CCAR 2026 bridgeMLS 2026. Information Deemed Reliable But Not Guaranteed. This information is being provided by the Bay East MLS, or CCAR MLS, or bridgeMLS. The listings presented here may or may not be listed by the Broker/Agent operating this website. This information is intended for the personal use of consumers and may not be used for any purpose other than to identify prospective properties consumers may be interested in purchasing. Data last updated at June 5, 2026 CAMAXMLS Member Broker: Mike Southwick
The information being provided by California Regional MLS (Southern California) is for the consumer's personal, non-commercial use and may not be used for any purpose other than to identify prospective properties consumer may be interested in purchasing. Any information relating to real estate for sale referenced on this web site comes from the Internet Data Exchange (IDX) program of the California Regional MLS (Southern California). CENTURY 21 Lois Lauer Realty is not a Multiple Listing Service (MLS), nor does it offer MLS access. This website is a service of CENTURY 21 Lois Lauer Realty, a broker participant of California Regional MLS (Southern California). This web site may reference real estate listing(s) held by a brokerage firm other than the broker and/or agent who owns this web site.
The accuracy of all information, regardless of source, including but not limited to open house information, square footages and lot sizes, is deemed reliable but not guaranteed and should be personally verified through personal inspection by and/or with the appropriate professionals. The data contained herein is copyrighted by California Regional MLS (Southern California) and is protected by all applicable copyright laws. Any unauthorized dissemination of this information is in violation of copyright laws and is strictly prohibited.
Copyright 2021 California Regional MLS (Southern California). All rights reserved.
MetroList MLS 2026. This information is being provided by MetroList MLS. All measurements and calculations of area are approximate. Information provided by Seller/Other sources, not verified by Broker. All interested persons should independently verify accuracy of information. Provided properties may or may not be listed by the office/agent presenting the information. Data Updated: June 5, 2026. Information being provided is for consumers' personal, non-commercial use and may not be used for any purpose other than to identify prospective properties consumers may be interested in purchasing. Information deemed reliable but not guaranteed. Any offer of compensation is made only to Participants of MLS where the subject listing is filed and in accordance with such MLS's regulations or rules. MFMLS Member Broker: Romeo Aurelio
The information being provided by San Francisco Association of REALTORS is for the consumer's personal, non-commercial use and may not be used for any purpose other than to identify prospective properties consumer may be interested in purchasing. Any information relating to real estate for sale referenced on this web site comes from the Internet Data Exchange (IDX) program of the San Francisco Association of REALTORS. This web site may reference real estate listing(s) held by a brokerage firm other than the broker and/or agent who owns this web site. The accuracy of all information, regardless of source, including but not limited to open house information, square footages and lot sizes, is deemed reliable but not guaranteed and should be personally verified through personal inspection by and/or with the appropriate professionals. The data contained herein is copyrighted by San Francisco Association of REALTORS and is protected by all applicable copyright laws. Any unauthorized dissemination of this information is in violation of copyright laws and is strictly prohibited.
The information being provided by Bay Area Real Estate Information Service is for the consumer's personal, non-commercial use and may not be used for any purpose other than to identify prospective properties consumer may be interested in purchasing. Any information relating to real estate for sale referenced on this web site comes from the Internet Data Exchange (IDX) program of the Bay Area Real Estate Information Service. CENTURY 21 Epic is not a Multiple Listing Service (MLS), nor does it offer MLS access. This website is a service of CENTURY 21 Epic, a broker participant of Bay Area Real Estate Information Service. This web site may reference real estate listing(s) held by a brokerage firm other than the broker and/or agent who owns this web site.
The accuracy of all information, regardless of source, including but not limited to open house information, square footages and lot sizes, is deemed reliable but not guaranteed and should be personally verified through personal inspection by and/or with the appropriate professionals. The data contained herein is copyrighted by Bay Area Real Estate Information Service and is protected by all applicable copyright laws. Any unauthorized dissemination of this information is in violation of copyright laws and is strictly prohibited.
Properties in listings may have been sold or may no longer be available.
Copyright 2026 Bay Area Real Estate Information Service. All rights reserved. CABAREIS Member Broker: Mike Southwick
Neighborhoods near Newark, CA
Zip codes near Newark, CA
- 94025 homes for sale
- 94041 homes for sale
- 94043 homes for sale
- 94085 homes for sale
- 94089 homes for sale
- 94301 homes for sale
- 94303 homes for sale
- 94306 homes for sale
- 94536 homes for sale
- 94538 homes for sale
- 94539 homes for sale
- 94542 homes for sale
- 94544 homes for sale
- 94545 homes for sale
- 94555 homes for sale
- 94560 homes for sale
- 94587 homes for sale
- 95002 homes for sale
- 95054 homes for sale
- 95134 homes for sale
Popular searches near Newark, CA
- Atherton homes for sale
- Cherryland homes for sale
- East Palo Alto homes for sale
- Fairview homes for sale
- Foster City homes for sale
- Fremont homes for sale
- Hayward homes for sale
- Los Altos homes for sale
- Menlo Park homes for sale
- Milpitas homes for sale
- Mountain View homes for sale
- North Fair Oaks homes for sale
- Redwood City homes for sale
- San Lorenzo homes for sale
- Santa Clara homes for sale
- Stanford homes for sale
- Sunnyvale homes for sale
- Sunol homes for sale
- Union City homes for sale
- West Menlo Park homes for sale
Protect your home and budget from life's surprises with an Assurant Home Warranty, backed by a partner that supports you through every step of homeownership. Explore Plans.
©2026 Century 21 Real Estate LLC. All rights reserved. CENTURY 21®, the CENTURY 21 Logo and C21® are service marks owned by Century 21 Real Estate LLC. Century 21 Real Estate LLC fully supports the principles of the Fair Housing Act and the Equal Opportunity Act. Each office is independently owned and operated. Listing information is deemed reliable but not guaranteed accurate.