- Arapahoe Ridge, Erie homes for sale
- East Baseline, Boulder homes for sale
- Four Mile Creek, Boulder homes for sale
- Kings Ridge, Boulder homes for sale
- Longmont Estates, Longmont homes for sale
- Niwot, Longmont homes for sale
- North Half of Southwest Longmont, Longmont homes for sale
- North Longmont, Longmont homes for sale
- North Rim, Longmont homes for sale
- Northeast Boulder, Boulder homes for sale
- Northfield Commons, Boulder homes for sale
- Northwest Longmont, Longmont homes for sale
- Old South Longmont, Longmont homes for sale
- Palo Park, Boulder homes for sale
- Rural North Boulder, Longmont homes for sale
- South Eastern Plains, Lafayette homes for sale
- South Half of Southeast Longmont, Longmont homes for sale
- Southeast Longmont, Longmont homes for sale
- Southmoor Park, Longmont homes for sale
- Southwest Longmont, Longmont homes for sale
Niwot, CO - homes for sale
40 of 40 results displayed
- New
 $2,250,000Active6 beds 5 baths5,483 sq. ft.
7237 Spring Creek Cir, Niwot, CO 80503
MLS# 1060286Listed by: RE/MAX Alliance-Wadsworth  $1,595,000Pending5 beds 4 baths3,951 sq. ft.
8245 Sawtooth Lane, Niwot, CO 80503
MLS# IR1060256Listed by: ST VRAIN REALTY ASSOCIATES LLC
 $385,000Active2 beds 2 baths1,280 sq. ft.
8011 Countryside Park #218, Niwot, CO 80503
MLS# 1059565Listed by: RE/MAX of Boulder, Inc $2,250,000Active5 beds 5 baths5,101 sq. ft.
7273 Spring Creek Circle, Niwot, CO 80503
MLS# IR1058723Listed by: COMPASS - BOULDER $3,250,000Active6 beds 6 baths7,371 sq. ft.
8408 Brittany Place, Niwot, CO 80503
MLS# 9222162Listed by: COMPASS COLORADO, LLC - BOULDER $5,900,000Active6 beds 10 baths22,454 sq. ft.
8532 Strawberry Ln, Niwot, CO 80503
MLS# 7329670Listed by: Madison & Company Properties- Open Sat, 11am to 1pm
 $2,495,000Active5 beds 6 baths8,442 sq. ft.
8528 Skyland Drive, Niwot, CO 80503
MLS# IR1058321Listed by: COMPASS - BOULDER  $3,650,000Active5 beds 6 baths10,680 sq. ft.
6303 Snowberry Ln, Niwot, CO 80503
MLS# 1058211Listed by: RE/MAX of Boulder, Inc $3,695,000Active5 beds 7 baths7,566 sq. ft.
6689 Asher Court, Longmont, CO 80503
MLS# IR1058173Listed by: COMPASS - BOULDER $1,650,000Active5 beds 5 baths4,968 sq. ft.
7845 Monarch Rd, Niwot, CO 80503
MLS# 1057422Listed by: Coldwell Banker Realty 02 $1,650,000Active5 beds 4 baths4,042 sq. ft.
6640 Paiute Ct, Niwot, CO 80503
MLS# 3873774Listed by: Compass Colorado, LLC - Boulder $750,000Active5 beds 4 baths2,382 sq. ft.
8060 Meadowdale Sq, Niwot, CO 80503
MLS# 5198889Listed by: Your Castle Real Estate Inc $799,000Active3 beds 4 baths2,433 sq. ft.
8064 Meadowdale Sq, Niwot, CO 80503
MLS# 1056770Listed by: Coldwell Banker Realty 02 $2,450,000Active4 beds 4 baths5,467 sq. ft.
8568 Foxhaven Court, Niwot, CO 80503
MLS# IR1054956Listed by: WK REAL ESTATE $310,000Active2 beds 1 baths882 sq. ft.
8050 Niwot Rd #28, Niwot, CO 80503
MLS# 1056640Listed by: Madison & Company Properties - Niwot $1,295,000Active4 beds 3 baths3,859 sq. ft.
7598 Estate Cir, Niwot, CO 80503
MLS# 1056581Listed by: milehimodern - Boulder $3,200,000Active5 beds 7 baths6,573 sq. ft.
9260 Shooting Star Court, Niwot, CO 80503
MLS# IR1056185Listed by: MADISON & COMPANY PROPERTIES - NIWOT $1,395,000Active3 beds 3 baths4,706 sq. ft.
7464 Whirlaway Lane, Niwot, CO 80503
MLS# IR1055777Listed by: MADISON & COMPANY PROPERTIES - NIWOT $5,499,999Active5 beds 6 baths7,388 sq. ft.
6816 Goldbranch Dr, Niwot, CO 80503
MLS# 4138678Listed by: WK Real Estate $2,995,000Active4 beds 7 baths9,247 sq. ft.
8414 Firethorn Ct, Niwot, CO 80503
MLS# 5795042Listed by: RE/MAX of Boulder $310,000Active2 beds 1 baths882 sq. ft.
8060 Niwot Rd #58, Niwot, CO 80503
MLS# 7973659Listed by: Sellstate Altitude Realty $1,799,000Active5 beds 4 baths3,816 sq. ft.
6957 Peppertree Dr, Niwot, CO 80503
MLS# 5591243Listed by: Compass Colorado, LLC - Boulder $2,195,000Pending6 beds 5 baths6,014 sq. ft.
7247 Longview Dr, Niwot, CO 80503
MLS# 1054580Listed by: milehimodern - Boulder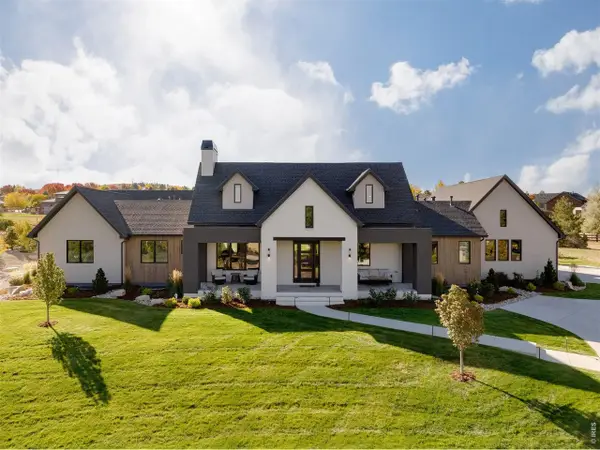 $5,499,999Active5 beds 6 baths7,388 sq. ft.
6816 Goldbranch Dr, Niwot, CO 80503
MLS# 1052795Listed by: WK Real Estate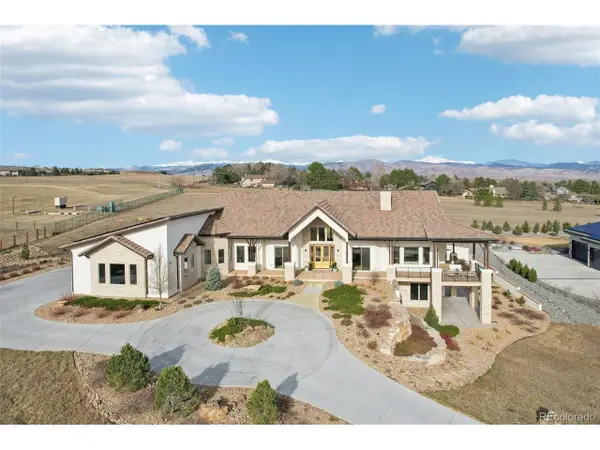 $3,695,000Active5 beds 7 baths7,566 sq. ft.
6689 Asher Ct, Niwot, CO 80503
MLS# 4318158Listed by: Compass Colorado, LLC - Boulder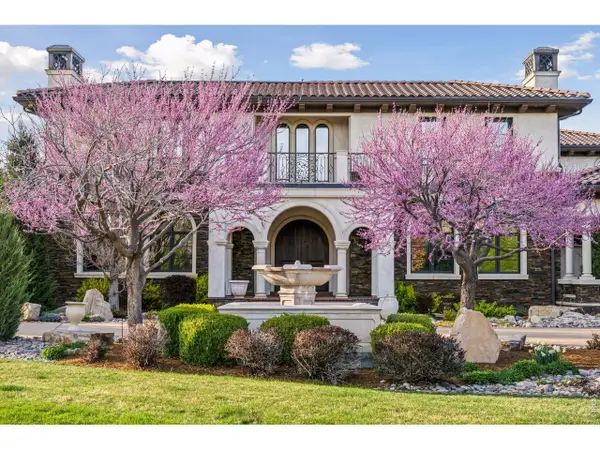 $4,500,000Active5 beds 7 baths12,621 sq. ft.
6541 Legend Ridge Trl, Niwot, CO 80503
MLS# 1054312Listed by: Coldwell Banker Realty 02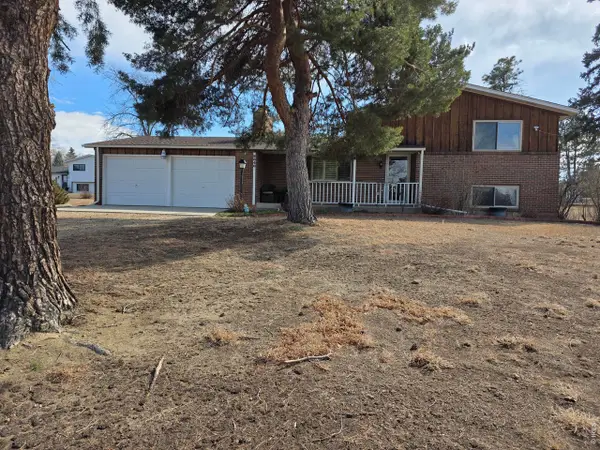 $815,000Active4 beds 2 baths2,800 sq. ft.
8840 Niwot Rd, Niwot, CO 80503
MLS# 4530245Listed by: Northern Colorado Real Estate $1,250,000Active4 beds 3 baths3,113 sq. ft.
7399 N 95th Street, Longmont, CO 80504
MLS# 3750483Listed by: COMPASS COLORADO, LLC - BOULDER $4,500,000Active6 beds 9 baths9,057 sq. ft.
8906 Little Raven Trl, Niwot, CO 80503
MLS# 1051857Listed by: Coldwell Banker Realty 02 $585,000Active2 beds 3 baths1,600 sq. ft.
8179 Dry Creek Circle, Niwot, CO 80503
MLS# IR1051626Listed by: COMPASS - BOULDER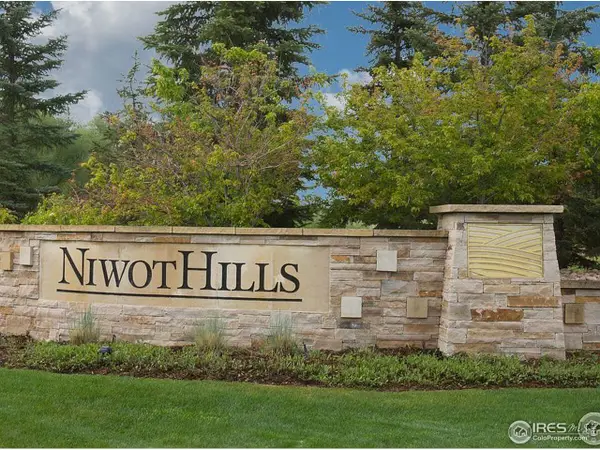 $675,000Active1.41 Acres
6692 Jacqueline Ct, Niwot, CO 80503
MLS# 1051475Listed by: West and Main Homes $650,000Active1.16 Acres
6696 Jacqueline Ct, Niwot, CO 80503
MLS# 1051477Listed by: West and Main Homes $625,000Active1.06 Acres
6695 Jacqueline Ct, Niwot, CO 80503
MLS# 1051472Listed by: West and Main Homes $5,500,000Active5 beds 8 baths8,887 sq. ft.
8576 Niwot Meadow Farm Rd, Niwot, CO 80503
MLS# 1051076Listed by: Madison & Company Properties - Niwot $3,100,000Active6 beds 8 baths6,394 sq. ft.
9261 Blue Spruce Ln, Niwot, CO 80503
MLS# 2844188Listed by: Kentwood Real Estate DTC, LLC $299,000Active2 beds 1 baths984 sq. ft.
8060 Niwot Rd #66, Niwot, CO 80503
MLS# 1048209Listed by: Coldwell Banker Realty 02 $250,000Active2 beds 1 baths696 sq. ft.
8050 Niwot Rd #1, Niwot, CO 80503
MLS# 1046938Listed by: HomeSmart $250,000Active2 beds 1 baths696 sq. ft.
8050 Niwot Road #1, Niwot, CO 80503
MLS# 3232028Listed by: HOMESMART $4,990,000Active7 beds 11 baths11,204 sq. ft.
6771 Niwot Hills Dr, Niwot, CO 80503
MLS# 8735565Listed by: Vivid Ventures $1,144,897Active4 beds 4 baths3,707 sq. ft.
Address Withheld By Seller, Longmont, CO 80503
MLS# 7961049Listed by: Jesus Orozco Jr
Local realty services provided by:CENTURY 21 CapRock Real Estate, CENTURY 21 Signature Realty
The real estate listing information and related content displayed on this site is provided exclusively for consumer's personal, non-commercial use and may not be used for any purpose other than to identify prospective properties consumers may be interested in purchasing. This information and related content is deemed reliable but is not guaranteed accurate by Information and Real Estate Services, LLC.
Information source: Information and Real Estate Services, LLC. Provided for limited non-commercial use only under IRES Rules © Copyright IRES. The information being provided by Information and Real Estate Services is for the consumer's personal, non-commercial use and may not be used for any purpose other than to identify prospective properties consumer may be interested in purchasing. Any information relating to real estate for sale referenced on this web site comes from the Internet Data Exchange (IDX) program of the Information and Real Estate Services. This web site may reference real estate listing(s) held by a brokerage firm other than the broker and/or agent who owns this web site.
The accuracy of all information, regardless of source, including but not limited to open house information, square footages and lot sizes, is deemed reliable but not guaranteed and should be personally verified through personal inspection by and/or with the appropriate professionals. The data contained herein is copyrighted by Information and Real Estate Services and is protected by all applicable copyright laws. Any unauthorized dissemination of this information is in violation of copyright laws and is strictly prohibited.
Based on information submitted to the MLS GRID as of May 29, 2026 02:19 PM. All data is obtained from various sources and may not have been verified by broker or MLS GRID. Supplied Open House information is subject to change without notice. All information should be independently reviewed and verified for accuracy. Properties may or may not be listed by the office/agent presenting the information. ML Member Broker: Michele A Scherr
Neighborhoods near Niwot, CO
Zip codes near Niwot, CO
- 80020 homes for sale
- 80021 homes for sale
- 80023 homes for sale
- 80026 homes for sale
- 80027 homes for sale
- 80301 homes for sale
- 80302 homes for sale
- 80303 homes for sale
- 80304 homes for sale
- 80305 homes for sale
- 80455 homes for sale
- 80501 homes for sale
- 80503 homes for sale
- 80504 homes for sale
- 80513 homes for sale
- 80514 homes for sale
- 80516 homes for sale
- 80520 homes for sale
- 80530 homes for sale
- 80542 homes for sale
Popular searches near Niwot, CO
- Altona homes for sale
- Boulder homes for sale
- Broomfield homes for sale
- Erie homes for sale
- Erie-Frederick homes for sale
- Firestone homes for sale
- Frederick homes for sale
- Glendale homes for sale
- Gunbarrel homes for sale
- Lafayette homes for sale
- Lafayette-Louisville homes for sale
- Lazy Acres homes for sale
- Longmont homes for sale
- Louisville homes for sale
- Lyons homes for sale
- Paragon Estates homes for sale
- Pine Brook Hill homes for sale
- Seven Hills homes for sale
- Sunshine homes for sale
- Superior homes for sale
Protect your home and budget from life's surprises with an Assurant Home Warranty, backed by a partner that supports you through every step of homeownership. Explore Plans.
©2026 Century 21 Real Estate LLC. All rights reserved. CENTURY 21®, the CENTURY 21 Logo and C21® are service marks owned by Century 21 Real Estate LLC. Century 21 Real Estate LLC fully supports the principles of the Fair Housing Act and the Equal Opportunity Act. Each office is independently owned and operated. Listing information is deemed reliable but not guaranteed accurate.