- Aliante, North Las Vegas homes for sale
- Arrowhead Acres, North Las Vegas homes for sale
- Brookspark, North Las Vegas homes for sale
- Centennial Hills, Las Vegas homes for sale
- College Park, North Las Vegas homes for sale
- Elkhorn Springs, Las Vegas homes for sale
- Gilcrease, Las Vegas homes for sale
- Iron Mountain Ranch, Las Vegas homes for sale
- Los Prados, Las Vegas homes for sale
- Michael Way, Las Vegas homes for sale
- Montecito Town Center, Las Vegas homes for sale
- Nellis Air Force Base, Nellis Air Force Base homes for sale
- North Cheyenne, Las Vegas homes for sale
- Painted Desert, Las Vegas homes for sale
- Silverstone Ranch, Las Vegas homes for sale
- Spring Mountain Ranch, Las Vegas homes for sale
- Sunhampton, Las Vegas homes for sale
- Tule Springs, Las Vegas homes for sale
- Wann, North Las Vegas homes for sale
- West Las Vegas, Las Vegas homes for sale
North Las Vegas, NV - homes for sale
300 of 1,336 results displayed
- New
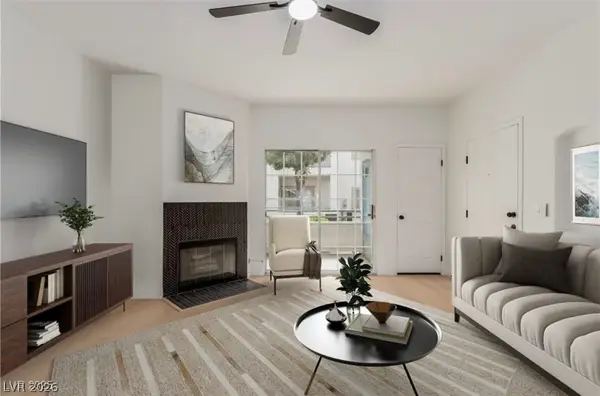
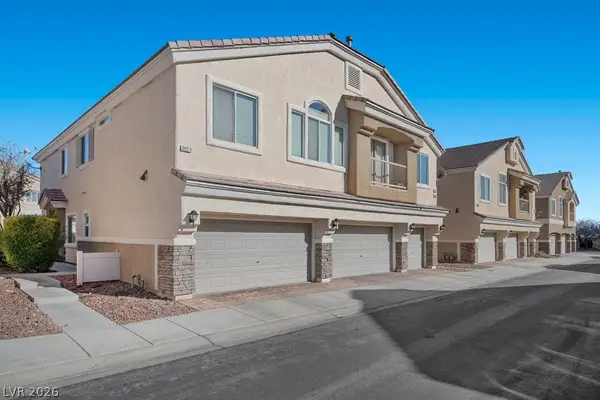
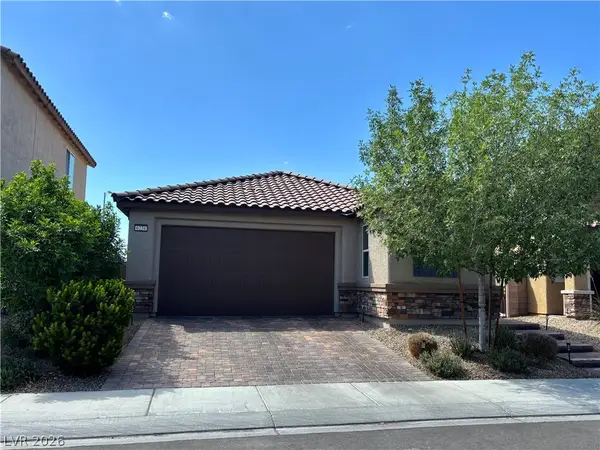
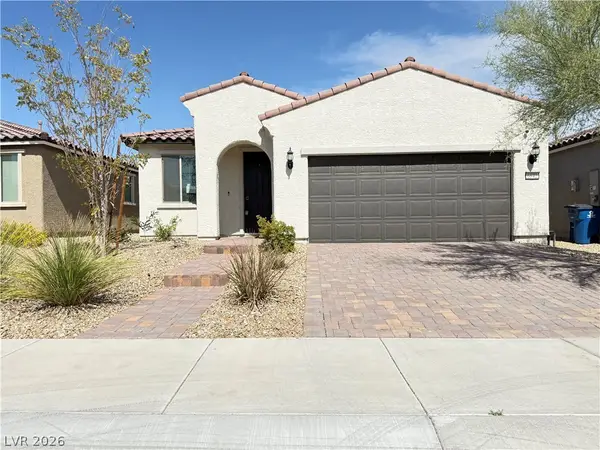
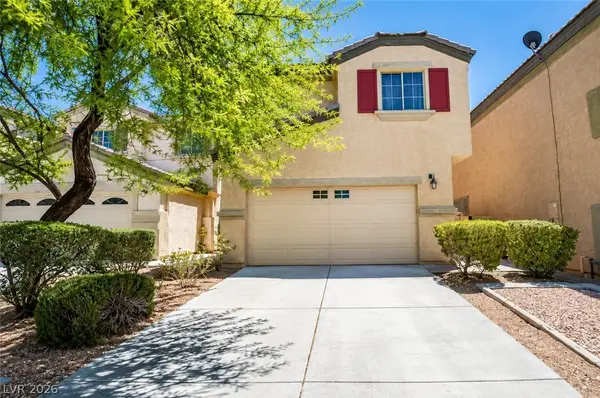
 $319,900Active2 beds 2 baths1,266 sq. ft.
6944 Skyline Blue Street, North Las Vegas, NV 89086
MLS# 2790340Listed by: REALTY 360 - New
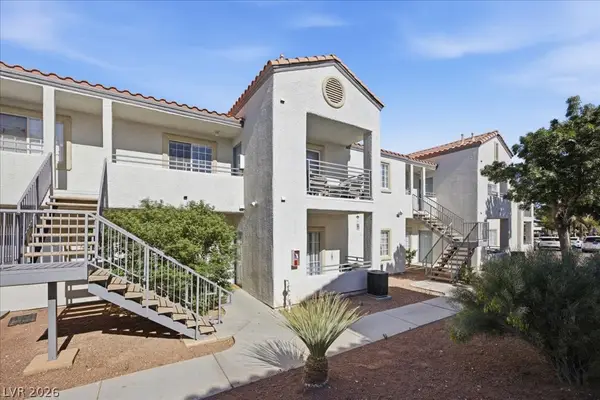
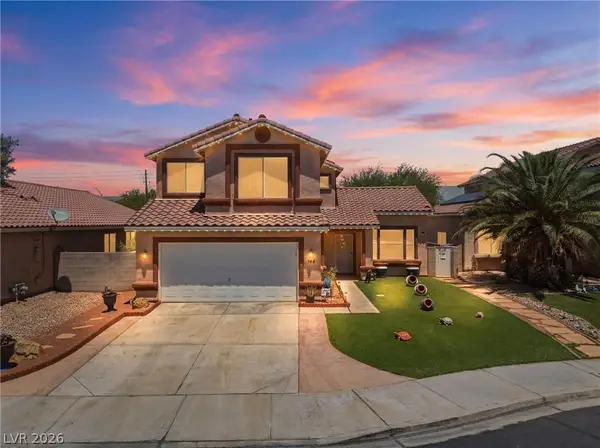
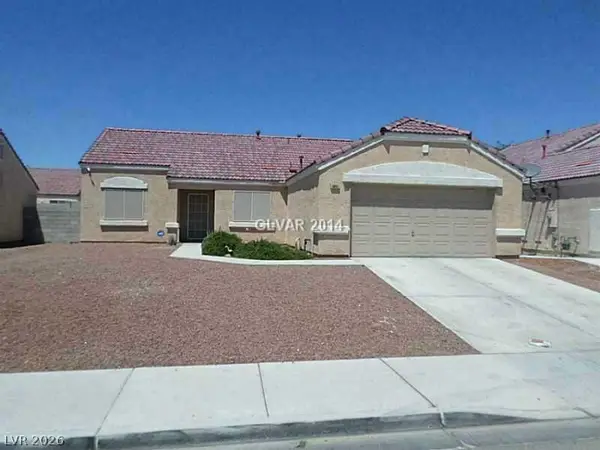
 $165,000Active2 beds 2 baths976 sq. ft.
3318 N Decatur Boulevard #1020, Las Vegas, NV 89130
MLS# 2788929Listed by: KELLER WILLIAMS MARKETPLACE - New
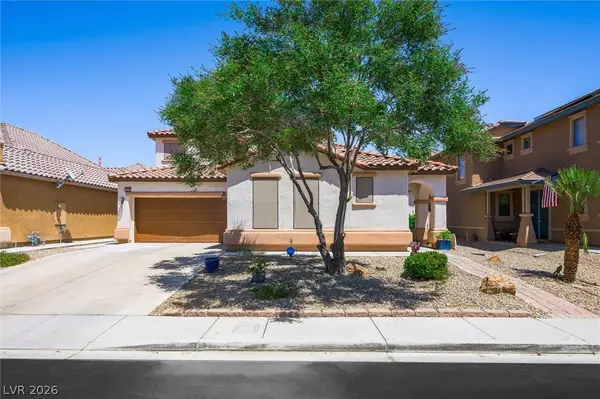
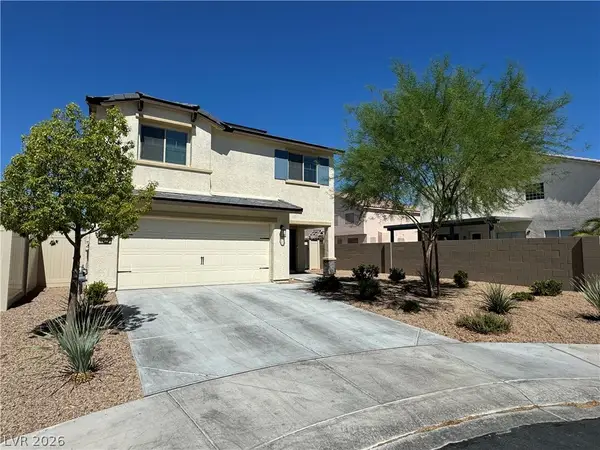
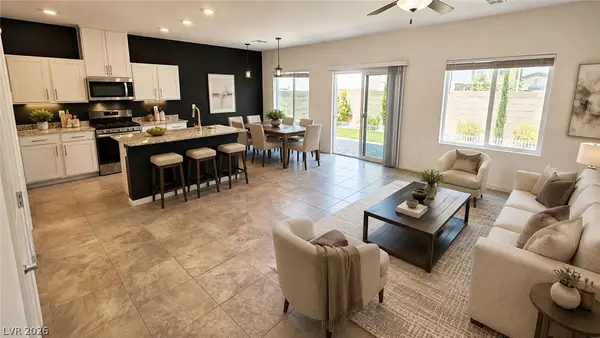
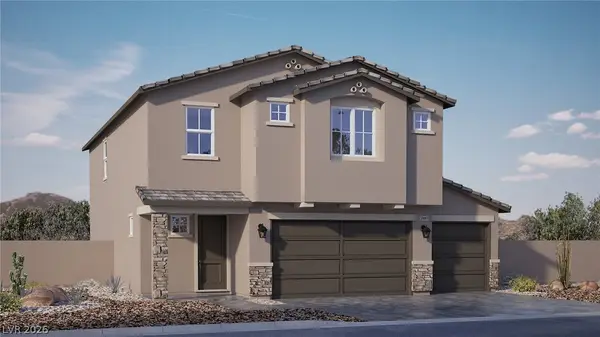
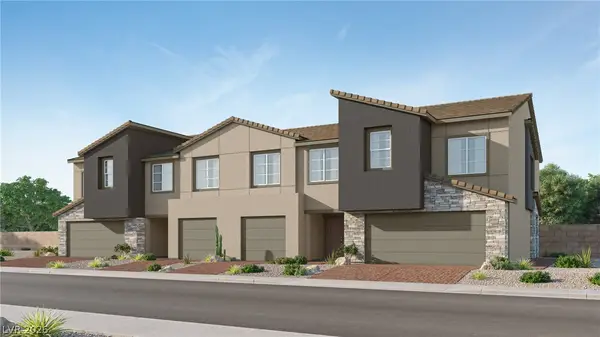 $376,552Active3 beds 3 baths1,481 sq. ft.
194 Stardust Grove Avenue, North Las Vegas, NV 89031
MLS# 2790197Listed by: LENNAR SALES CORP - New
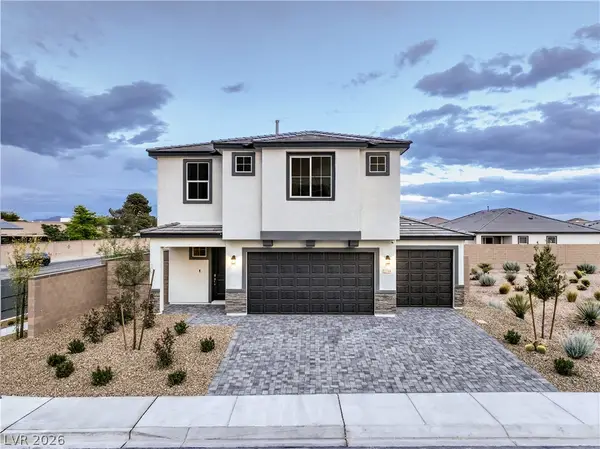
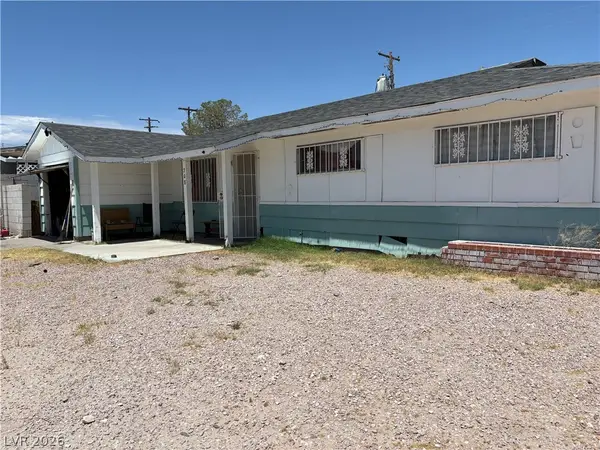
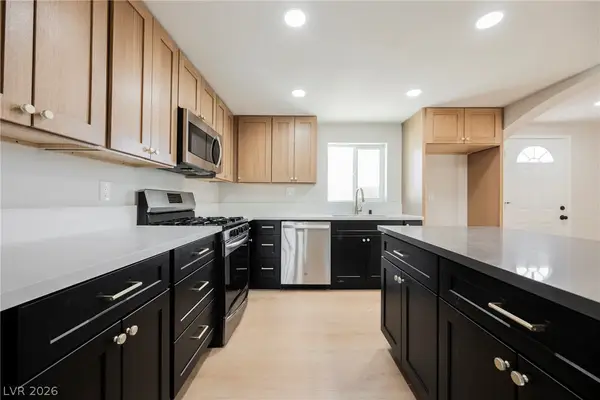
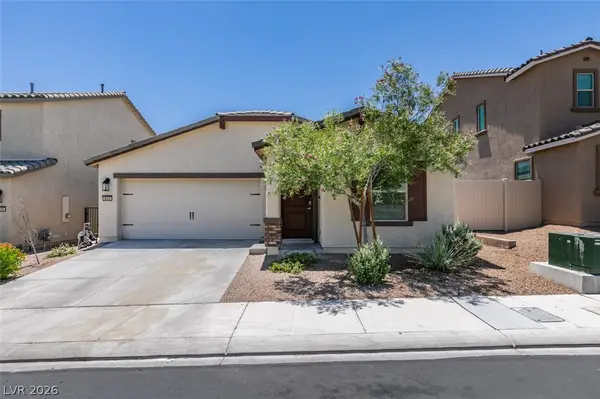
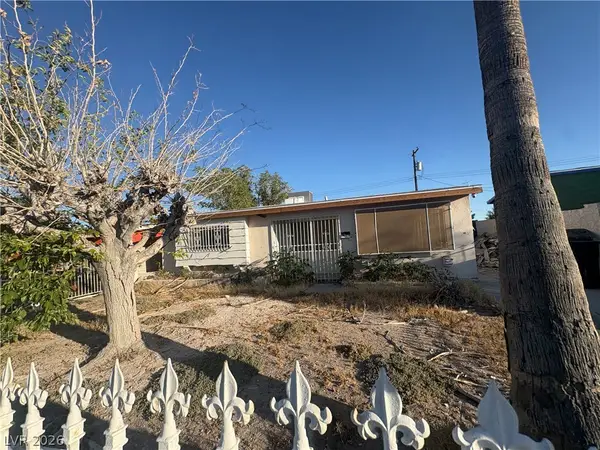
 $329,999Active3 beds 2 baths1,000 sq. ft.
2539 Noble Street, North Las Vegas, NV 89030
MLS# 2788655Listed by: EXP REALTY - New
 $149,900Active2 beds 2 baths976 sq. ft.
3318 N Decatur Boulevard #1165, Las Vegas, NV 89130
MLS# 2789956Listed by: KELLER WILLIAMS REALTY LAS VEG - Open Wed, 10am to 5pmNew
 $533,440Active5 beds 3 baths2,660 sq. ft.
5144 Conway Street, North Las Vegas, NV 89031
MLS# 2790269Listed by: D R HORTON INC - New
 $425,000Active3 beds 2 baths1,776 sq. ft.
5123 Fiji Island Court, North Las Vegas, NV 89031
MLS# 2789655Listed by: LAS VEGAS REALTY GROUP - New
 $429,000Active3 beds 2 baths1,826 sq. ft.
1811 Night Shadow Avenue, North Las Vegas, NV 89031
MLS# 2790025Listed by: GALINDO GROUP REAL ESTATE - New
 $315,000Active3 beds 3 baths1,588 sq. ft.
3412 Robust Robin Place #3, North Las Vegas, NV 89084
MLS# 2789698Listed by: EXP REALTY - New
 $403,000Active3 beds 2 baths1,873 sq. ft.
4717 Cedar Ranch Court, North Las Vegas, NV 89031
MLS# 2790143Listed by: REAL BROKER LLC - New
 $379,000Active3 beds 3 baths1,610 sq. ft.
7855 Pandora Sky Street #3, North Las Vegas, NV 89084
MLS# 2790085Listed by: REALTY ONE GROUP, INC - Open Thu, 1 to 6pmNew
 $425,000Active4 beds 2 baths1,696 sq. ft.
2926 Steppingstone Court, North Las Vegas, NV 89031
MLS# 2788875Listed by: EXP REALTY - New
 $330,000Active4 beds 3 baths1,608 sq. ft.
2114 Yale Street, North Las Vegas, NV 89030
MLS# 2790078Listed by: FATHOM REALTY - New
 $350,000Active4 beds 3 baths1,989 sq. ft.
7037 Fossil Rim Street, North Las Vegas, NV 89084
MLS# 2789567Listed by: EXP REALTY - New
 $379,000Active3 beds 2 baths1,196 sq. ft.
1402 Great Hollow Avenue, North Las Vegas, NV 89086
MLS# 2789786Listed by: ICON REALTY - New
 $499,990Active5 beds 3 baths2,715 sq. ft.
5024 Ferrell Street, Las Vegas, NV 89031
MLS# 2789994Listed by: SIMPLY VEGAS - New
 $639,990Active5 beds 3 baths3,040 sq. ft.
6328 Bunch Grass Court, Las Vegas, NV 89031
MLS# 2789998Listed by: SIMPLY VEGAS - New
 $520,990Active5 beds 3 baths3,000 sq. ft.
3837 Hibiscus Haven Avenue, North Las Vegas, NV 89081
MLS# 2790045Listed by: D R HORTON INC - New
 $400,000Active3 beds 2 baths1,527 sq. ft.
4511 Socrates Street, North Las Vegas, NV 89031
MLS# 2790046Listed by: INNOVATIVE REAL ESTATE STRATEG  $325,000Pending3 beds 2 baths1,451 sq. ft.
4330 Cobblehill Way, North Las Vegas, NV 89032
MLS# 2790066Listed by: JMG REAL ESTATE- New

 $645,000Active3 beds 2 baths2,196 sq. ft.
7324 Bugler Swan Way, North Las Vegas, NV 89084
MLS# 2787447Listed by: CENTURY 21 AMERICANA - New
 $374,150Active3 beds 3 baths1,475 sq. ft.
Address Withheld By Seller, North Las Vegas, NV 89031
MLS# 2789978Listed by: LENNAR SALES CORP - New
 $395,000Active3 beds 2 baths1,266 sq. ft.
4436 Summer Glen Lane, North Las Vegas, NV 89031
MLS# 2789928Listed by: INNOVATIVE REAL ESTATE STRATEG - New
 $394,000Active5 beds 2 baths1,896 sq. ft.
2843 Flower Avenue, North Las Vegas, NV 89030
MLS# 2788205Listed by: EPIQUE REALTY - New
 $435,000Active3 beds 3 baths2,299 sq. ft.
6281 Angora Peak Lane, Las Vegas, NV 89115
MLS# 2789269Listed by: KELLER WILLIAMS REALTY LAS VEG - New
 $399,999Active3 beds 3 baths1,393 sq. ft.
513 Sand Sage Avenue, North Las Vegas, NV 89030
MLS# 2789850Listed by: LPT REALTY, LLC - New
 $435,000Active3 beds 2 baths1,871 sq. ft.
1122 Elliot Park Avenue, North Las Vegas, NV 89032
MLS# 2789174Listed by: LAS VEGAS REALTY LLC - New
 $439,000Active4 beds 3 baths2,381 sq. ft.
3147 Alder Grove Court, North Las Vegas, NV 89081
MLS# 2789196Listed by: LAS VEGAS REALTY LLC - New
 $425,000Active4 beds 3 baths1,924 sq. ft.
5442 Iberville Street, North Las Vegas, NV 89031
MLS# 2789003Listed by: PLATINUM REAL ESTATE PROF - New
 $460,000Active3 beds 2 baths1,874 sq. ft.
6120 Satre Court, North Las Vegas, NV 89031
MLS# 2789063Listed by: VEGAS INTERNATIONAL PROPERTIES - New
 $669,000Active6 beds 4 baths3,939 sq. ft.
1777 Gentle Brook Street, North Las Vegas, NV 89084
MLS# 2789117Listed by: INVESTPRO REALTY - New
 $310,000Active2 beds 2 baths1,171 sq. ft.
7850 Jupiter Sky Street #1, North Las Vegas, NV 89084
MLS# 2788571Listed by: REALTY OF AMERICA LLC  $425,000Pending4 beds 3 baths2,733 sq. ft.
113 Sierra Breeze Avenue, North Las Vegas, NV 89031
MLS# 2789418Listed by: HUNTINGTON & ELLIS, A REAL EST- New
 $694,899Active4 beds 3 baths2,021 sq. ft.
415 Hellebores Avenue, North Las Vegas, NV 89084
MLS# 2789635Listed by: EXP REALTY - New
 $720,000Active5 beds 2 baths2,406 sq. ft.
4709 W San Miguel Avenue, North Las Vegas, NV 89032
MLS# 2789592Listed by: CENTURY 21 AMERICANA - New
 $375,000Active4 beds 2 baths1,143 sq. ft.
1604 E Evans Avenue, North Las Vegas, NV 89030
MLS# 2789436Listed by: GOLDEN STARS REALTY GROUP LLC - New
 $460,000Active4 beds 2 baths1,374 sq. ft.
4300 San Diego Street, North Las Vegas, NV 89032
MLS# 2788617Listed by: REAL BROKER LLC - New
 $432,000Active2 beds 2 baths1,908 sq. ft.
7721 Lily Trotter Street, North Las Vegas, NV 89084
MLS# 2789553Listed by: REAL BROKER LLC  $400,000Pending4 beds 2 baths1,560 sq. ft.
5326 Pine Bough Street, North Las Vegas, NV 89031
MLS# 2786457Listed by: EXP REALTY- New
 $790,000Active6 beds 5 baths4,443 sq. ft.
1867 Michael Springs Place, North Las Vegas, NV 89084
MLS# 2788292Listed by: SIMPLY VEGAS - New
 $600,000Active4 beds 3 baths2,659 sq. ft.
1139 Crescent Moon Drive, North Las Vegas, NV 89031
MLS# 2788114Listed by: SIGNATURE REAL ESTATE GROUP - New
 $465,000Active5 beds 3 baths2,459 sq. ft.
230 Pivot Avenue, North Las Vegas, NV 89031
MLS# 2789419Listed by: ELITE REALTY - New
 $444,900Active2 beds 2 baths1,908 sq. ft.
3219 Kingbird Drive, North Las Vegas, NV 89084
MLS# 2787881Listed by: REAL BROKER LLC - New
 $415,000Active3 beds 3 baths1,829 sq. ft.
6022 Evening View Street, North Las Vegas, NV 89031
MLS# 2787356Listed by: CLEAR SKY REALTY LLC - New
 $499,900Active4 beds 3 baths2,415 sq. ft.
7725 Wishbone Falls Street, North Las Vegas, NV 89084
MLS# 2789210Listed by: REAL BROKER LLC - New
 $300,000Active2 beds 2 baths1,118 sq. ft.
4418 Meadow Glade Avenue, North Las Vegas, NV 89084
MLS# 2789238Listed by: THE RIDGE REALTY GROUP - New
 $739,999Active5 beds 4 baths3,732 sq. ft.
7405 Bugler Swan Way, North Las Vegas, NV 89084
MLS# 2789104Listed by: ZENITH REALTY GROUP  $450,000Pending4 beds 3 baths2,236 sq. ft.
4331 Erica Drive, North Las Vegas, NV 89032
MLS# 2788322Listed by: BLUE DIAMOND REALTY LLC- New
 $399,900Active3 beds 2 baths1,585 sq. ft.
5929 Saratoga Reserve Street, North Las Vegas, NV 89081
MLS# 2788918Listed by: LIFE REALTY DISTRICT - New
 $439,900Active4 beds 3 baths2,392 sq. ft.
1320 Evans Canyon Street, North Las Vegas, NV 89031
MLS# 2789162Listed by: VISION REALTY GROUP - New
 $315,000Active3 beds 2 baths1,161 sq. ft.
1720 Belmont Street, North Las Vegas, NV 89030
MLS# 2789345Listed by: REALTY OF AMERICA LLC - New
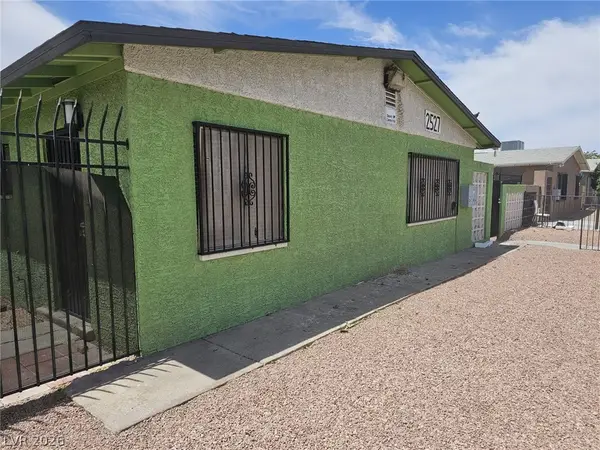 $699,999Active-- beds -- baths2,889 sq. ft.
2527 Carroll Street, North Las Vegas, NV 89030
MLS# 2783901Listed by: VIRTUE REAL ESTATE GROUP - New
 $435,000Active3 beds 2 baths1,640 sq. ft.
4723 Brushfire Street, North Las Vegas, NV 89031
MLS# 2778186Listed by: COLDWELL BANKER PREMIER - New
 $450,000Active4 beds 3 baths2,257 sq. ft.
2087 Johnstown Avenue, North Las Vegas, NV 89081
MLS# 2785184Listed by: CITY NATIONAL PROPERTIES - New
 $464,999Active4 beds 3 baths1,878 sq. ft.
5232 Giallo Vista Court, North Las Vegas, NV 89031
MLS# 2789037Listed by: KELLER WILLIAMS VIP - New
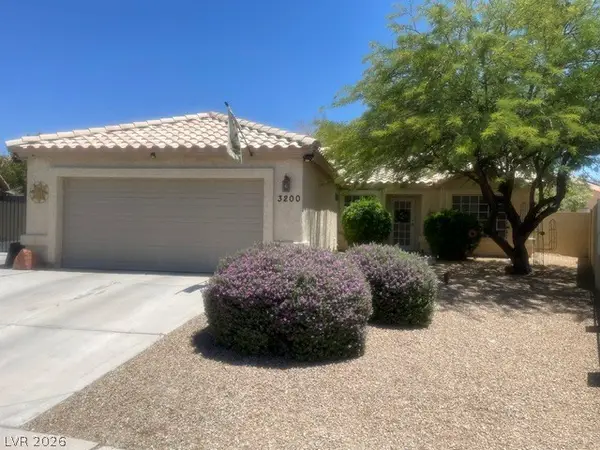 $519,900Active-- beds 2 baths1,390 sq. ft.
3200 Beamery Court, North Las Vegas, NV 89032
MLS# 2789098Listed by: KELLER WILLIAMS VIP - New
 $492,000Active4 beds 3 baths2,963 sq. ft.
4220 Iris Pearl, North Las Vegas, NV 89031
MLS# 2789128Listed by: OPENDOOR BROKERAGE LLC - New
 $308,999Active3 beds 2 baths1,454 sq. ft.
6630 Flaminian Ln Lane #204, North Las Vegas, NV 89084
MLS# 2789213Listed by: UNITED REALTY GROUP - New
 $419,800Active2 beds 2 baths1,415 sq. ft.
4724 W La Madre Way, North Las Vegas, NV 89031
MLS# 2789219Listed by: RE/MAX LEGACY - New
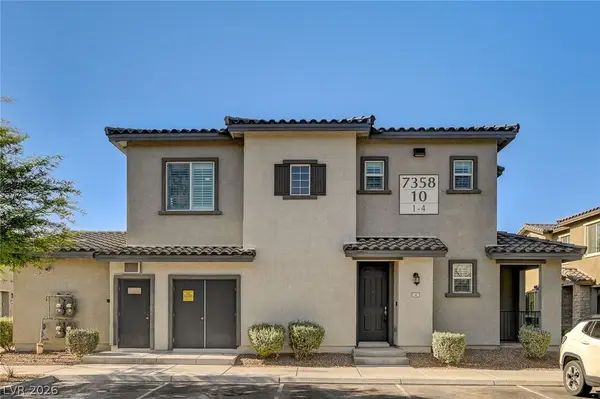 $340,000Active2 beds 3 baths1,342 sq. ft.
7358 N Decatur Boulevard #4, Las Vegas, NV 89131
MLS# 2789275Listed by: KELLER WILLIAMS MARKETPLACE - New
 $449,990Active3 beds 3 baths2,169 sq. ft.
4313 Brazil Palm Court, North Las Vegas, NV 89032
MLS# 2788984Listed by: REFLECTIONS REAL ESTATE GROUP - New
 $440,000Active4 beds 3 baths1,959 sq. ft.
6133 Casa Antiqua Street, North Las Vegas, NV 89081
MLS# 2788618Listed by: KELLER WILLIAMS MARKETPLACE - New
 $485,000Active4 beds 3 baths2,784 sq. ft.
3529 Colby Creek Avenue, North Las Vegas, NV 89081
MLS# 2789056Listed by: COLDWELL BANKER PREMIER - New
 $419,900Active4 beds 2 baths1,888 sq. ft.
3112 Gannon Ridge Avenue, North Las Vegas, NV 89081
MLS# 2787874Listed by: EMPIRE REALTY & MANAGEMENT - New
 $490,000Active3 beds 3 baths2,353 sq. ft.
3604 Kingfishers Catch Avenue, North Las Vegas, NV 89084
MLS# 2787889Listed by: LPT REALTY, LLC - New
 $520,000Active4 beds 3 baths1,997 sq. ft.
4312 Solitude Falls Avenue, North Las Vegas, NV 89084
MLS# 2787922Listed by: RE/MAX ADVANTAGE - New
 $530,000Active4 beds 3 baths2,294 sq. ft.
1219 Dover Glen Drive, North Las Vegas, NV 89031
MLS# 2787943Listed by: BHHS NEVADA PROPERTIES - Open Sat, 12 to 3pmNew
 $519,900Active4 beds 3 baths2,680 sq. ft.
1417 Deep Valley Avenue, North Las Vegas, NV 89084
MLS# 2788345Listed by: BHHS NEVADA PROPERTIES - New
 $529,000Active5 beds 3 baths2,944 sq. ft.
4622 Pointleaf Street, North Las Vegas, NV 89032
MLS# 2788590Listed by: REALTY ONE GROUP, INC - New
 $455,000Active3 beds 3 baths1,943 sq. ft.
1561 Redolence, North Las Vegas, NV 89031
MLS# 2788988Listed by: OPENDOOR BROKERAGE LLC - New
 $412,000Active3 beds 2 baths1,607 sq. ft.
5132 Rocky Bluff, North Las Vegas, NV 89031
MLS# 2789022Listed by: OPENDOOR BROKERAGE LLC - New
 $329,900Active4 beds 2 baths1,178 sq. ft.
3008 Spear Street, North Las Vegas, NV 89030
MLS# 2789038Listed by: SERHANT - New
 $365,000Active3 beds 2 baths1,615 sq. ft.
5150 Riverside Run Court, North Las Vegas, NV 89081
MLS# 2789102Listed by: THE BROKERAGE A RE FIRM - New
 $426,500Active4 beds 2 baths1,814 sq. ft.
1208 E El Campo Grande Avenue, North Las Vegas, NV 89081
MLS# 2789106Listed by: EXP REALTY - New
 $460,000Active3 beds 3 baths1,771 sq. ft.
6234 Orions Belt Peak Street, North Las Vegas, NV 89031
MLS# 2789074Listed by: BROKERS ONLY, LLC - New
 $315,000Active3 beds 2 baths988 sq. ft.
708 Van Ert Avenue, North Las Vegas, NV 89030
MLS# 2786239Listed by: KELLER WILLIAMS REALTY LAS VEG - New
 $585,000Active5 beds 4 baths3,219 sq. ft.
5642 Ouray Street, North Las Vegas, NV 89081
MLS# 2789045Listed by: VISION REALTY GROUP - New
 $349,995Active3 beds 2 baths1,242 sq. ft.
3104 Wright Avenue, North Las Vegas, NV 89030
MLS# 2789053Listed by: INFINITY BROKERAGE - New
 $375,000Active3 beds 2 baths1,274 sq. ft.
3520 Tesoro Del Valle Court, North Las Vegas, NV 89081
MLS# 2787863Listed by: MORE REALTY INCORPORATED - New
 $400,000Active4 beds 3 baths1,989 sq. ft.
1623 Dakota Group Avenue, North Las Vegas, NV 89084
MLS# 2787170Listed by: EPIQUE REALTY - New
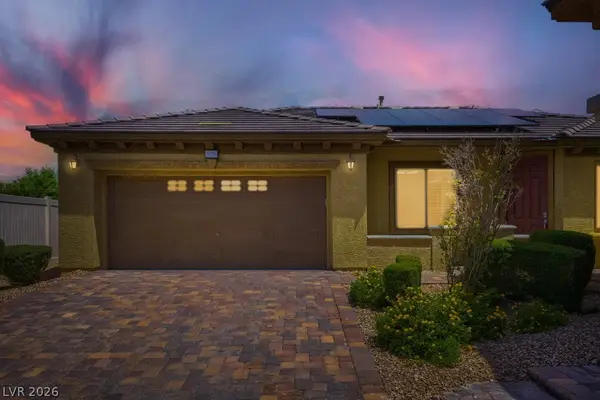
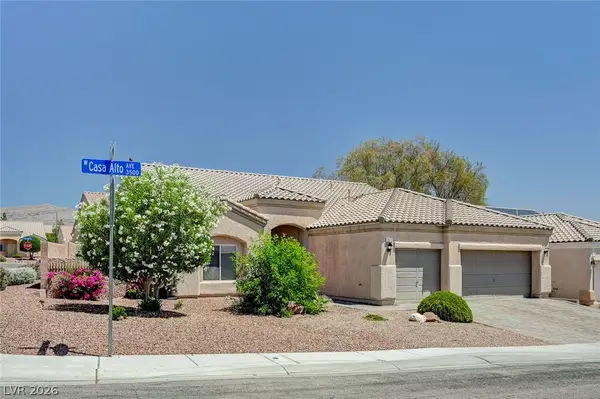 $449,900Active4 beds 2 baths2,039 sq. ft.
3512 Casa Alto Avenue, North Las Vegas, NV 89031
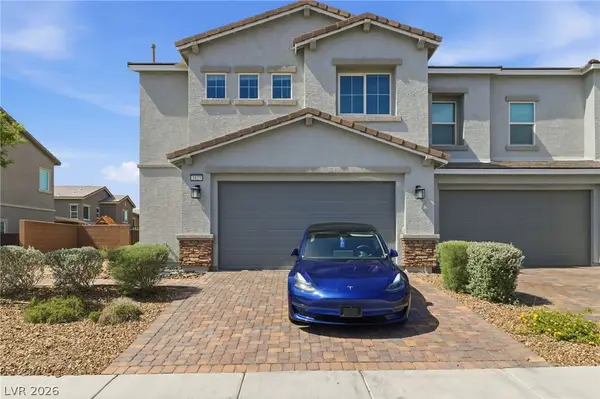
MLS# 2788747Listed by: RED CANYON REALTY 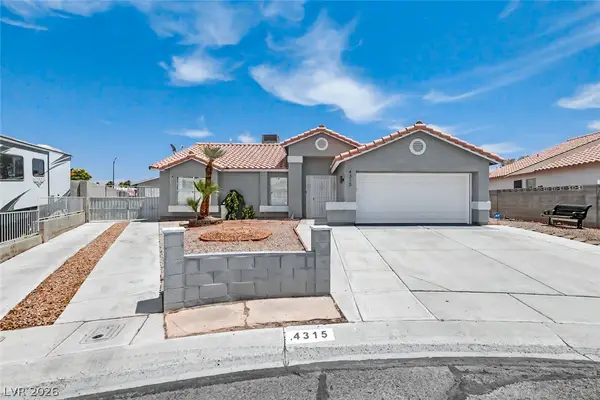 $449,987Pending3 beds 2 baths1,511 sq. ft.
4315 Silvercrest Court, North Las Vegas, NV 89032
MLS# 2786927Listed by: RE/MAX ADVANTAGE- New
 $429,800Active3 beds 2 baths1,470 sq. ft.
6022 Highland Gardens Drive, North Las Vegas, NV 89031
MLS# 2788553Listed by: UNITED REALTY GROUP - New
 $445,000Active3 beds 3 baths2,075 sq. ft.
7255 Dazzle Point Street, North Las Vegas, NV 89084
MLS# 2788796Listed by: SPHERE REAL ESTATE - New
 $455,000Active4 beds 3 baths2,004 sq. ft.
4676 Cactus Sun Lane, North Las Vegas, NV 89031
MLS# 2788920Listed by: NEVADA ASSET PRESERVATION & MA - New
 $375,000Active3 beds 3 baths1,759 sq. ft.
2343 Catskill Court, North Las Vegas, NV 89031
MLS# 2788950Listed by: ROOFTOP REALTY - New
 $560,000Active3 beds 3 baths2,961 sq. ft.
2129 Mistle Thrush Drive, North Las Vegas, NV 89084
MLS# 2788863Listed by: COLDWELL BANKER PREMIER - New
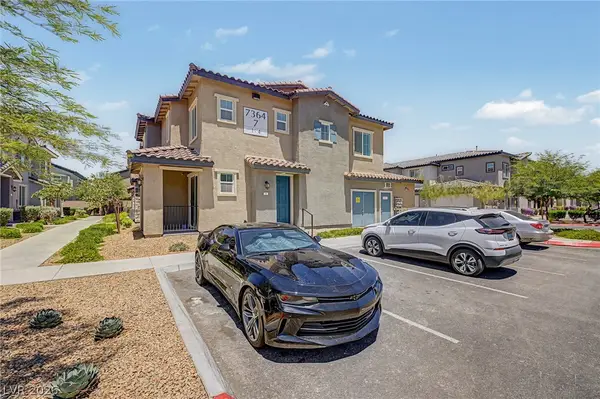 $340,000Active2 beds 3 baths1,342 sq. ft.
7364 N Decatur Boulevard #4, Las Vegas, NV 89131
MLS# 2787803Listed by: REAL BROKER LLC - New
 $435,000Active2 beds 3 baths1,758 sq. ft.
1501 Visible Avenue, North Las Vegas, NV 89031
MLS# 2788656Listed by: INNOVA REALTY & MANAGEMENT - Open Sat, 11am to 1pmNew
 $415,000Active3 beds 2 baths1,629 sq. ft.
1521 Honey Vista Lane, North Las Vegas, NV 89032
MLS# 2788665Listed by: LEGACY REAL ESTATE GROUP - New
 $495,000Active3 beds 2 baths1,984 sq. ft.
3421 Amish Avenue, North Las Vegas, NV 89031
MLS# 2788692Listed by: COLDWELL BANKER PREMIER - New
 $419,000Active4 beds 3 baths1,876 sq. ft.
110 Thankfulness Court, North Las Vegas, NV 89032
MLS# 2788753Listed by: HOMESMART ENCORE - New
 $2,400,000Active2.4 Acres
0 Hwy 93 Great Basin, North Las Vegas, NV 89165
MLS# 2788764Listed by: DOUGLAS ELLIMAN OF NEVADA LLC - New
 $350,000Active4 beds 2 baths1,575 sq. ft.
2239 Opponents Ridge Street, North Las Vegas, NV 89032
MLS# 2788347Listed by: EXCELLENCE FINE LIVING REALTY - New
 $49,000Active0.12 Acres
Reverend Wilson Lot 44 Avenue, North Las Vegas, NV 89030
MLS# 2788497Listed by: SIMPLY VEGAS - New
 $49,000Active0.11 Acres
Reverend Wilson Lot 42 Avenue, North Las Vegas, NV 89030
MLS# 2788515Listed by: SIMPLY VEGAS - New
 $438,000Active3 beds 2 baths1,729 sq. ft.
2421 Sunrise Springs Court, North Las Vegas, NV 89031
MLS# 2788699Listed by: LIFE REALTY DISTRICT - New
 $461,999Active4 beds 3 baths2,419 sq. ft.
5917 Lavender Breeze Street, North Las Vegas, NV 89081
MLS# 2781404Listed by: KELLER WILLIAMS VIP - New
 $500,000Active4 beds 2 baths2,216 sq. ft.
4308 Yorkwood Drive, North Las Vegas, NV 89032
MLS# 2788417Listed by: REAL BROKER LLC - New
 $457,500Active3 beds 2 baths1,593 sq. ft.
910 Cobblestone Cove Road, North Las Vegas, NV 89081
MLS# 2787279Listed by: SIGNATURE REAL ESTATE GROUP - New
 $586,000Active4 beds 3 baths2,696 sq. ft.
1710 Little Bow Avenue, North Las Vegas, NV 89084
MLS# 2779817Listed by: SPHERE REAL ESTATE - New
 $460,000Active4 beds 3 baths1,796 sq. ft.
1656 Bonnie Bay Place, North Las Vegas, NV 89084
MLS# 2786773Listed by: KELLER WILLIAMS REALTY LAS VEG - New
 $419,000Active3 beds 2 baths1,650 sq. ft.
5904 Lady Carolina Street, North Las Vegas, NV 89081
MLS# 2788406Listed by: LPT REALTY, LLC - New
 $595,000Active4 beds 4 baths2,958 sq. ft.
4420 Cityscape Glen Court, North Las Vegas, NV 89084
MLS# 2788422Listed by: BHHS NEVADA PROPERTIES - New
 $304,990Active3 beds 1 baths1,376 sq. ft.
2625 Spear Street, North Las Vegas, NV 89030
MLS# 2788603Listed by: MORE REALTY INCORPORATED - New
 $550,000Active3 beds 3 baths2,182 sq. ft.
716 Fiesta Del Rey Avenue, North Las Vegas, NV 89081
MLS# 2787483Listed by: HOMESMART ENCORE - Open Fri, 11am to 1pmNew
 $460,000Active5 beds 3 baths2,149 sq. ft.
4707 Agave Cactus Street, North Las Vegas, NV 89031
MLS# 2785288Listed by: EXP REALTY - New
 $430,000Active4 beds 2 baths1,574 sq. ft.
3441 Mazzocco Court, North Las Vegas, NV 89032
MLS# 2787757Listed by: COMPASS REALTY & MANAGEMENT - New
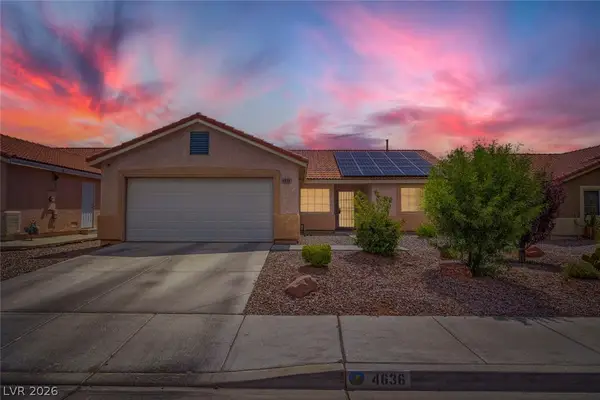 $365,000Active3 beds 2 baths1,381 sq. ft.
4636 Ferrell Street, North Las Vegas, NV 89031
MLS# 2787764Listed by: BHHS NEVADA PROPERTIES - New
 $419,000Active3 beds 3 baths2,218 sq. ft.
7489 Onyx Star Street, North Las Vegas, NV 89084
MLS# 2788117Listed by: HUNTINGTON & ELLIS, A REAL EST - New
 $760,000Active3 beds 3 baths2,711 sq. ft.
6538 Green Sparrow Lane, North Las Vegas, NV 89084
MLS# 2788409Listed by: VEGAS REALTY EXPERTS - New
 $410,000Active3 beds 3 baths1,689 sq. ft.
3405 Green Ice, Las Vegas, NV 89081
MLS# 2787211Listed by: DESERT REALTY - New
 $368,000Active3 beds 2 baths1,420 sq. ft.
2113 Crake Court, North Las Vegas, NV 89084
MLS# 2787324Listed by: ELITE REALTY - New
 $554,900Active5 beds 3 baths3,068 sq. ft.
4410 Outlook Vista Avenue, North Las Vegas, NV 89084
MLS# 2788315Listed by: PLATINUM REAL ESTATE PROF - New
 $665,000Active4 beds 3 baths2,559 sq. ft.
1928 Marks River Place, North Las Vegas, NV 89084
MLS# 2786575Listed by: REALTY ONE GROUP, INC - New
 $525,000Active4 beds 3 baths3,042 sq. ft.
5508 Talmo Street, North Las Vegas, NV 89081
MLS# 2787823Listed by: SPHERE REAL ESTATE - New
 $430,000Active4 beds 3 baths1,989 sq. ft.
7050 Fossil Rim Street, North Las Vegas, NV 89084
MLS# 2788194Listed by: UNITED REALTY GROUP - New
 $407,500Active3 beds 2 baths1,727 sq. ft.
6842 Laguna Blanca Street, North Las Vegas, NV 89086
MLS# 2788203Listed by: COLDWELL BANKER PREMIER - New
 $449,990Active4 beds 3 baths1,882 sq. ft.
104 Zenith Point Avenue, North Las Vegas, NV 89032
MLS# 2787624Listed by: REAL BROKER LLC - New
 $430,000Active3 beds 3 baths1,750 sq. ft.
4929 Finca Street, North Las Vegas, NV 89031
MLS# 2787910Listed by: LIMESTONE INVESTMENTS LLC - New
 $358,999Active3 beds 2 baths1,415 sq. ft.
621 El Gusto Avenue, North Las Vegas, NV 89081
MLS# 2786501Listed by: EXP REALTY - New
 $692,990Active4 beds 3 baths2,754 sq. ft.
1204 Ryan River Place, North Las Vegas, NV 89084
MLS# 2788153Listed by: D R HORTON INC - New
 $725,000Active4 beds 4 baths3,841 sq. ft.
1611 Dire Wolf Avenue, North Las Vegas, NV 89084
MLS# 2787101Listed by: SIGNATURE REAL ESTATE GROUP - New
 $699,000Active6 beds 4 baths3,782 sq. ft.
1912 Ballard Bay Place, North Las Vegas, NV 89084
MLS# 2788046Listed by: SIMPLY VEGAS - New
 $299,900Active3 beds 2 baths1,056 sq. ft.
518 Duchess Avenue, North Las Vegas, NV 89030
MLS# 2787579Listed by: HUNTINGTON & ELLIS, A REAL EST - New
 $645,990Active4 beds 3 baths2,538 sq. ft.
1112 Ryan River Place, North Las Vegas, NV 89084
MLS# 2787397Listed by: D R HORTON INC  $514,990Pending5 beds 3 baths3,000 sq. ft.
233 Vegas Verde Avenue, North Las Vegas, NV 89031
MLS# 2788012Listed by: D R HORTON INC- New
 $557,990Active5 beds 3 baths3,000 sq. ft.
7412 Dominguez Bay Drive, North Las Vegas, NV 89084
MLS# 2788057Listed by: D R HORTON INC - New
 $220,000Active2 beds 2 baths1,151 sq. ft.
1881 W Alexander Road #1037, North Las Vegas, NV 89032
MLS# 2779494Listed by: EXP REALTY - New
 $535,000Active4 beds 3 baths2,819 sq. ft.
5633 Clarendon Lane, North Las Vegas, NV 89081
MLS# 2785359Listed by: KELLER WILLIAMS MARKETPLACE - New
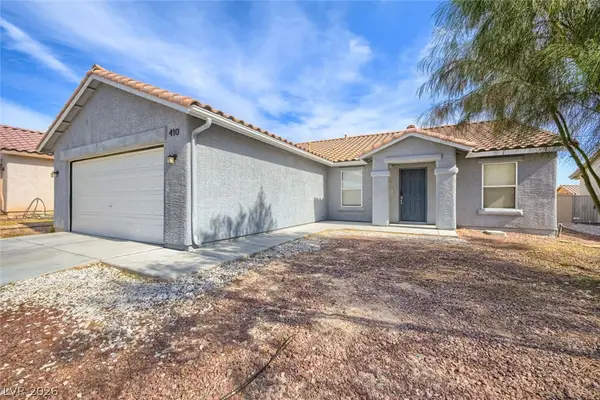 $389,900Active3 beds 2 baths1,719 sq. ft.
410 Foxvale Avenue, North Las Vegas, NV 89032
MLS# 2786480Listed by: ENTERA REALTY LLC - New
 $375,000Active3 beds 3 baths1,615 sq. ft.
404 Copper Pine Avenue, North Las Vegas, NV 89031
MLS# 2787729Listed by: UNITED REALTY GROUP - New
 $399,999Active3 beds 3 baths1,944 sq. ft.
6855 Crimson Shadow Street, North Las Vegas, NV 89086
MLS# 2787732Listed by: REDFIN  $289,999Pending2 beds 3 baths1,430 sq. ft.
2715 Amazing Meadows Avenue #2181, North Las Vegas, NV 89031
MLS# 2787882Listed by: KELLER WILLIAMS REALTY LAS VEG- New
 $394,500Active3 beds 2 baths1,415 sq. ft.
14 E Verde Way, North Las Vegas, NV 89031
MLS# 2787879Listed by: UNITED REALTY GROUP - New
 $519,800Active5 beds 3 baths2,354 sq. ft.
4018 Allyson Rae Street, North Las Vegas, NV 89032
MLS# 2787748Listed by: LAS VEGAS CAPITAL HOMES - New
 $530,000Active2 beds 2 baths1,932 sq. ft.
3805 Riviera Regal Avenue, North Las Vegas, NV 89081
MLS# 2787821Listed by: SIMPLY VEGAS - New
 $460,000Active4 beds 2 baths1,598 sq. ft.
6668 Arctic Breeze Street, North Las Vegas, NV 89084
MLS# 2787289Listed by: LYONS SHARE REAL ESTATE - New
 $380,000Active3 beds 2 baths1,235 sq. ft.
2409 Cockatiel Drive, North Las Vegas, NV 89084
MLS# 2787738Listed by: REALTY OF AMERICA LLC - New
 $792,000Active6 beds 4 baths3,782 sq. ft.
1921 Lewis Bay Avenue, North Las Vegas, NV 89084
MLS# 2786087Listed by: REALTY ONE GROUP, INC - New
 $575,000Active3 beds 3 baths2,727 sq. ft.
6840 Pacific Robin Street, North Las Vegas, NV 89084
MLS# 2787712Listed by: KELLER WILLIAMS MARKETPLACE - New
 $474,900Active3 beds 3 baths1,570 sq. ft.
2304 Carrier Dove Way, North Las Vegas, NV 89084
MLS# 2786915Listed by: REAL BROKER LLC - New
 $340,000Active2 beds 2 baths1,157 sq. ft.
7613 Fruit Dove Street, North Las Vegas, NV 89084
MLS# 2786918Listed by: REAL BROKER LLC - New
 $655,000Active4 beds 3 baths2,610 sq. ft.
7312 Bugler Swan Way, North Las Vegas, NV 89084
MLS# 2787452Listed by: ALCHEMY INVESTMENTS RE - New
 $480,000Active4 beds 3 baths2,628 sq. ft.
2608 Campobello Avenue, North Las Vegas, NV 89081
MLS# 2787591Listed by: KELLER WILLIAMS REALTY LAS VEG - New
 $354,000Active3 beds 2 baths1,172 sq. ft.
1650 Walingwood Drive, North Las Vegas, NV 89031
MLS# 2786967Listed by: COSTELLO REALTY & MGMT - New
 $419,900Active3 beds 3 baths1,756 sq. ft.
5631 Weeping Wall Street, North Las Vegas, NV 89031
MLS# 2787436Listed by: INNOVATION REALTY 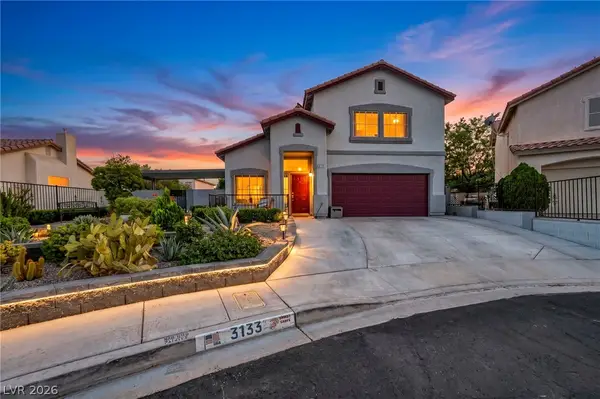 $415,000Pending3 beds 3 baths1,630 sq. ft.
3133 Macaroon Way, North Las Vegas, NV 89031
MLS# 2779131Listed by: KELLER WILLIAMS VIP- New
 $760,000Active3 beds 3 baths2,642 sq. ft.
4713 Overlook Ranch Street, North Las Vegas, NV 89031
MLS# 2783942Listed by: EXP REALTY - New
 $405,000Active4 beds 3 baths1,788 sq. ft.
2880 Vigilante Court, North Las Vegas, NV 89081
MLS# 2785527Listed by: KELLER WILLIAMS MARKETPLACE - New
 $475,000Active3 beds 2 baths1,650 sq. ft.
5817 Hawkeye Bell Street, North Las Vegas, NV 89081
MLS# 2786077Listed by: WARDLEY REAL ESTATE - New
 $479,000Active3 beds 2 baths2,146 sq. ft.
2326 Bahama Point Avenue, North Las Vegas, NV 89031
MLS# 2786856Listed by: KELLER WILLIAMS REALTY LAS VEG - Open Sat, 10am to 3pmNew
 $375,000Active3 beds 3 baths1,656 sq. ft.
6460 Butterfly Sky Street, North Las Vegas, NV 89084
MLS# 2786900Listed by: KELLER WILLIAMS REALTY LAS VEG - New
 $265,000Active3 beds 2 baths1,513 sq. ft.
833 Duquesne Avenue, North Las Vegas, NV 89030
MLS# 2787365Listed by: GALINDO GROUP REAL ESTATE - New
 $425,000Active3 beds 3 baths1,716 sq. ft.
1774 Kylie River Place, North Las Vegas, NV 89084
MLS# 2787475Listed by: BHHS NEVADA PROPERTIES - New
 $420,000Active4 beds 2 baths1,646 sq. ft.
5937 Coleman Street, North Las Vegas, NV 89031
MLS# 2787392Listed by: DESERT WINDS REALTY & PROPERTY  $165,000Pending2 beds 2 baths1,010 sq. ft.
6324 Desert Leaf Street #201, North Las Vegas, NV 89081
MLS# 2787230Listed by: UNITED REALTY GROUP- New
 $630,000Active4 beds 3 baths3,105 sq. ft.
911 Nawkee Drive, North Las Vegas, NV 89031
MLS# 2787199Listed by: JUST REALTY - New
 $395,000Active3 beds 3 baths1,826 sq. ft.
932 E Dorrell, North Las Vegas, NV 89086
MLS# 2787274Listed by: OPENDOOR BROKERAGE LLC - New
 $786,000Active4 beds 4 baths4,266 sq. ft.
4205 W Falcons Flight Avenue, North Las Vegas, NV 89084
MLS# 2777923Listed by: SIGNATURE REAL ESTATE GROUP - New
 $548,235Active6 beds 4 baths3,320 sq. ft.
3536 Kagan Court, North Las Vegas, NV 89081
MLS# 2786959Listed by: REALTY ONE GROUP, INC - New
 $415,000Active4 beds 3 baths1,906 sq. ft.
3720 Gallowtree Avenue, North Las Vegas, NV 89081
MLS# 2786970Listed by: KELLER WILLIAMS MARKETPLACE 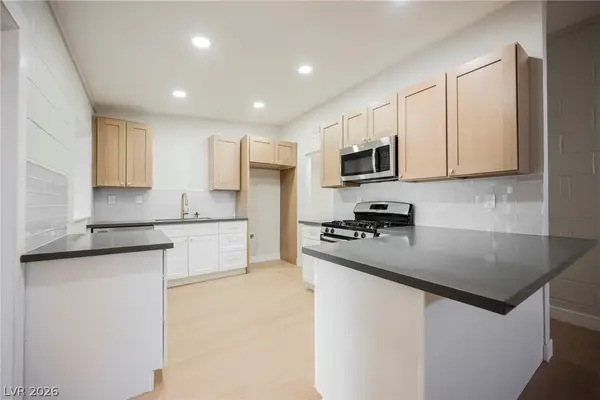 $379,995Pending4 beds 2 baths1,651 sq. ft.
2601 Reynolds Avenue, North Las Vegas, NV 89030
MLS# 2787066Listed by: INFINITY BROKERAGE- New
 $489,999Active4 beds 3 baths2,362 sq. ft.
6612 Ringbill Court, North Las Vegas, NV 89084
MLS# 2787207Listed by: MORE REALTY INCORPORATED - Open Sat, 12 to 3pm
 $625,000Active4 beds 3 baths3,096 sq. ft.
8132 Pink Desert Street, North Las Vegas, NV 89085
MLS# 2785494Listed by: RE/MAX CENTRAL  $415,000Active3 beds 3 baths2,008 sq. ft.
5220 Giallo Vista Court, North Las Vegas, NV 89031
MLS# 2787147Listed by: HUNTINGTON & ELLIS, A REAL EST $474,900Active4 beds 3 baths2,270 sq. ft.
983 Cliff Castle Avenue, North Las Vegas, NV 89081
MLS# 2787117Listed by: HUNTINGTON & ELLIS, A REAL EST $520,000Active4 beds 3 baths2,283 sq. ft.
5448 Flying Arrow Place, North Las Vegas, NV 89031
MLS# 2779388Listed by: KELLER WILLIAMS REALTY LAS VEG $400,000Active3 beds 2 baths1,718 sq. ft.
7748 Island Rail Drive, North Las Vegas, NV 89084
MLS# 2786884Listed by: KELLER WILLIAMS VIP $601,990Active5 beds 3 baths3,000 sq. ft.
7613 Gage Falls Lane, North Las Vegas, NV 89084
MLS# 2787062Listed by: D R HORTON INC $498,900Active5 beds 3 baths2,643 sq. ft.
3759 Berenices Avenue, North Las Vegas, NV 89084
MLS# 2787068Listed by: EXP REALTY $405,000Active3 beds 2 baths1,582 sq. ft.
1237 Taramar Street, North Las Vegas, NV 89031
MLS# 2783444Listed by: SIGNATURE REAL ESTATE GROUP $375,000Active3 beds 2 baths1,260 sq. ft.
5926 Creekside Sands Lane, North Las Vegas, NV 89031
MLS# 2786334Listed by: LPT REALTY, LLC $469,000Active4 beds 3 baths2,442 sq. ft.
6009 Star Point Court, North Las Vegas, NV 89081
MLS# 2786421Listed by: LOVE LAS VEGAS REALTY $284,900Active2 beds 3 baths1,367 sq. ft.
3929 Pepper Thorn Avenue #3, North Las Vegas, NV 89081
MLS# 2786678Listed by: RUSTIC PROPERTIES $570,000Active3 beds 2 baths1,780 sq. ft.
833 Dulcet Drive, North Las Vegas, NV 89032
MLS# 2786589Listed by: LIFE REALTY DISTRICT $425,000Active3 beds 2 baths1,606 sq. ft.
4929 Ferrell Street, North Las Vegas, NV 89031
MLS# 2786932Listed by: KNJ REAL ESTATE $365,000Active3 beds 2 baths1,252 sq. ft.
5830 Berry Hill Lane, North Las Vegas, NV 89031
MLS# 2786326Listed by: REALTY ONE GROUP, INC $345,000Active3 beds 3 baths1,695 sq. ft.
2757 Frosted Teal Avenue, North Las Vegas, NV 89086
MLS# 2783154Listed by: SIGNATURE REAL ESTATE GROUP $395,000Active4 beds 2 baths1,381 sq. ft.
3211 Fontana Colony Court, North Las Vegas, NV 89031
MLS# 2786356Listed by: GALINDO GROUP REAL ESTATE $350,000Active3 beds 2 baths1,121 sq. ft.
3634 Blue Dawn Drive, North Las Vegas, NV 89032
MLS# 2786786Listed by: KELLER WILLIAMS MARKETPLACE $600,000Active4 beds 3 baths2,819 sq. ft.
2612 Cattrack Avenue, North Las Vegas, NV 89081
MLS# 2786847Listed by: HUNTINGTON & ELLIS, A REAL EST $439,990Active3 beds 2 baths1,278 sq. ft.
544 Terrace Point Drive, North Las Vegas, NV 89032
MLS# 2781364Listed by: SIGNATURE REAL ESTATE GROUP $445,000Active4 beds 2 baths2,218 sq. ft.
4308 Brazil Palm Court, North Las Vegas, NV 89032
MLS# 2785948Listed by: REAL BROKER LLC $599,888Active3 beds 3 baths2,611 sq. ft.
3412 Fledgling Drive, North Las Vegas, NV 89084
MLS# 2786522Listed by: KELLER WILLIAMS REALTY LAS VEG $515,000Active4 beds 3 baths2,475 sq. ft.
1223 Great Hollow Avenue, North Las Vegas, NV 89086
MLS# 2786561Listed by: LEADING VEGAS REALTY $555,000Active5 beds 3 baths2,946 sq. ft.
1889 Lawley Cove Place, North Las Vegas, NV 89084
MLS# 2786619Listed by: MORE REALTY INCORPORATED- Open Sat, 12 to 2pm
 $324,000Active2 beds 2 baths1,169 sq. ft.
7330 N Decatur Boulevard #6, Las Vegas, NV 89131
MLS# 2786690Listed by: SIMPLY VEGAS  $528,900Active4 beds 3 baths2,560 sq. ft.
6437 Boatbill Street, North Las Vegas, NV 89084
MLS# 2786728Listed by: KELLER WILLIAMS MARKETPLACE $184,900Active3 beds 2 baths1,140 sq. ft.
3318 N Decatur Boulevard #2072, Las Vegas, NV 89130
MLS# 2785735Listed by: ELITE REALTY $398,888Active3 beds 2 baths1,821 sq. ft.
6728 Sand Swallow Street, North Las Vegas, NV 89084
MLS# 2786423Listed by: HUNTINGTON & ELLIS, A REAL EST $445,000Active3 beds 3 baths2,515 sq. ft.
3221 Aspinwall Court, North Las Vegas, NV 89081
MLS# 2786608Listed by: GOLDEN ASSETS & PROPERTY MGT $384,900Pending3 beds 2 baths1,585 sq. ft.
3709 Citrus Heights Avenue, North Las Vegas, NV 89081
MLS# 2786613Listed by: WEDGEWOOD HOMES REALTY, LLC $438,000Active4 beds 3 baths2,340 sq. ft.
1228 Arc Dome Avenue, North Las Vegas, NV 89031
MLS# 2781566Listed by: KELLER WILLIAMS MARKETPLACE $300,000Active2 beds 2 baths1,081 sq. ft.
3021 Sunrise Bay Avenue, North Las Vegas, NV 89031
MLS# 2785767Listed by: LPT REALTY, LLC $441,000Active4 beds 3 baths2,217 sq. ft.
7058 Noah Raven Street, North Las Vegas, NV 89084
MLS# 2786313Listed by: GALINDO GROUP REAL ESTATE $558,777Active3 beds 3 baths2,366 sq. ft.
6631 Alder Flower Court, North Las Vegas, NV 89084
MLS# 2786500Listed by: CENTENNIAL REAL ESTATE $299,999Active3 beds 2 baths1,266 sq. ft.
7002 Midnight Bronze Street, North Las Vegas, NV 89086
MLS# 2786080Listed by: AXIS REAL ESTATE LLC $399,999Active3 beds 2 baths1,606 sq. ft.
1449 Healing Waters Lane, North Las Vegas, NV 89031
MLS# 2785308Listed by: CLEAR SKY REALTY LLC- Open Sat, 11am to 2pm
 $394,000Active3 beds 3 baths1,832 sq. ft.
6042 Hidden Summit Street, North Las Vegas, NV 89031
MLS# 2782445Listed by: BHHS NEVADA PROPERTIES  $474,999Active4 beds 3 baths2,528 sq. ft.
4729 Challenger Street, North Las Vegas, NV 89031
MLS# 2783974Listed by: THE MOR GROUP $580,000Active5 beds 3 baths2,996 sq. ft.
1409 Sandstone View Way, North Las Vegas, NV 89084
MLS# 2786192Listed by: HUNTINGTON & ELLIS, A REAL EST $337,000Active3 beds 2 baths1,152 sq. ft.
2937 Webster Street, North Las Vegas, NV 89030
MLS# 2785820Listed by: OPENDOOR BROKERAGE LLC $525,000Pending6 beds 3 baths3,196 sq. ft.
1104 High Altitude Avenue, North Las Vegas, NV 89032
MLS# 2785218Listed by: BHHS NEVADA PROPERTIES $435,800Active-- beds -- baths1,656 sq. ft.
2104 White Street, North Las Vegas, NV 89030
MLS# 2777195Listed by: SIGNATURE REAL ESTATE GROUP $440,000Active4 beds 3 baths2,305 sq. ft.
5804 Clear Haven Lane, North Las Vegas, NV 89081
MLS# 2783957Listed by: SIGNATURE REAL ESTATE GROUP $550,000Active5 beds 3 baths2,874 sq. ft.
2502 Parasail Point Avenue, North Las Vegas, NV 89031
MLS# 2784293Listed by: VICE REALTY $330,000Active3 beds 3 baths1,325 sq. ft.
6952 Midnight Bronze Street, North Las Vegas, NV 89086
MLS# 2786102Listed by: RAINTREE REAL ESTATE $385,000Active3 beds 2 baths1,146 sq. ft.
3841 Bach Way, North Las Vegas, NV 89032
MLS# 2785970Listed by: UNITED REALTY GROUP $360,000Active5 beds 3 baths2,018 sq. ft.
3220 Reynolds Avenue, North Las Vegas, NV 89030
MLS# 2786055Listed by: INNOVATIVE REAL ESTATE STRATEG $530,000Active4 beds 3 baths2,206 sq. ft.
6115 Dawn View Lane, North Las Vegas, NV 89031
MLS# 2785697Listed by: SIMPLY VEGAS $599,999Active3 beds 3 baths2,527 sq. ft.
903 Jason Alexander Avenue, North Las Vegas, NV 89031
MLS# 2786018Listed by: REAL BROKER LLC $350,000Pending3 beds 3 baths1,811 sq. ft.
637 W Colton Avenue, North Las Vegas, NV 89032
MLS# 2785887Listed by: WINDERMERE EXCELLENCE $397,558Active4 beds 3 baths2,007 sq. ft.
6028 Gum Springs Street, North Las Vegas, NV 89081
MLS# 2785964Listed by: KEY REALTY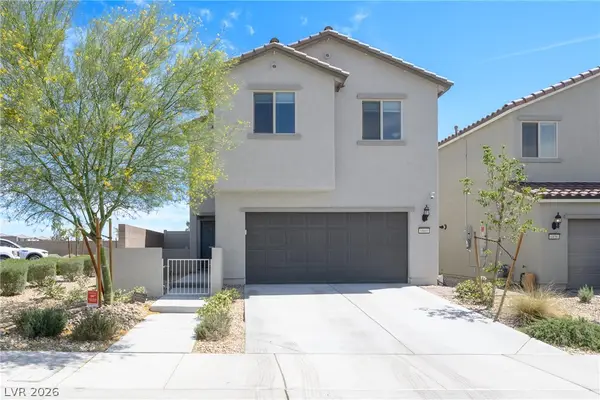 $485,000Active5 beds 3 baths2,290 sq. ft.
6860 Toros Street, Las Vegas, NV 89086
MLS# 2783024Listed by: REAL BROKER LLC- Open Wed, 10am to 5pm
 $519,990Active5 beds 3 baths2,660 sq. ft.
5132 Conway Street, North Las Vegas, NV 89031
MLS# 2785901Listed by: D R HORTON INC 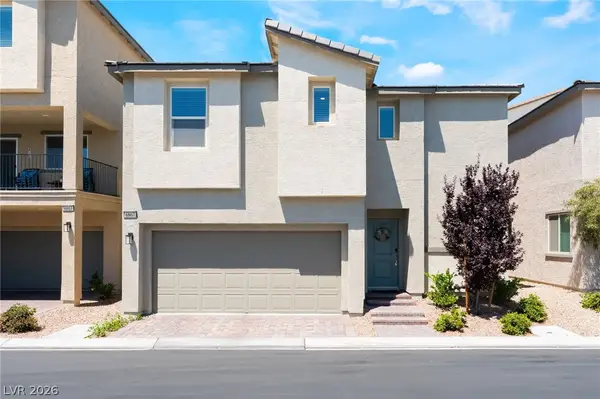 $389,000Active3 beds 3 baths1,577 sq. ft.
6867 Evening Orchid Street, North Las Vegas, NV 89086
MLS# 2784387Listed by: PLATINUM REAL ESTATE PROF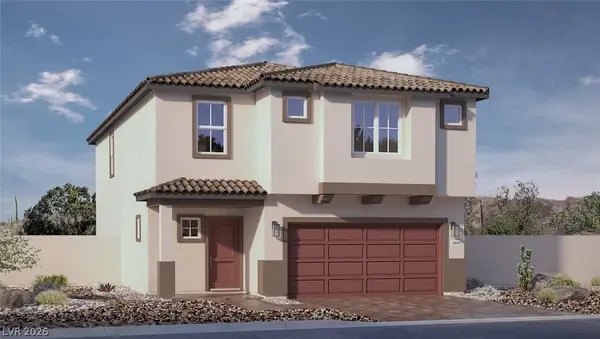 $526,990Active5 beds 3 baths2,660 sq. ft.
7408 Dominguez Bay Drive, North Las Vegas, NV 89084
MLS# 2785842Listed by: D R HORTON INC $669,500Active5 beds 5 baths3,375 sq. ft.
7527 Ardenno Street, North Las Vegas, NV 89084
MLS# 2784818Listed by: ROCK REALTY GROUP $519,990Active5 beds 3 baths2,944 sq. ft.
1173 Pitaya Court, North Las Vegas, NV 89032
MLS# 2785658Listed by: CENTURY 21 AMERICANA $370,000Active3 beds 2 baths1,156 sq. ft.
4048 Knoll Ridge Avenue, North Las Vegas, NV 89032
MLS# 2785563Listed by: REALTY ONE GROUP, INC $501,990Active5 beds 3 baths2,660 sq. ft.
3828 Hibiscus Haven Avenue, North Las Vegas, NV 89081
MLS# 2785702Listed by: D R HORTON INC $395,000Active3 beds 2 baths1,613 sq. ft.
536 Desert Senna Avenue, North Las Vegas, NV 89030
MLS# 2784086Listed by: COMPASS REALTY & MANAGEMENT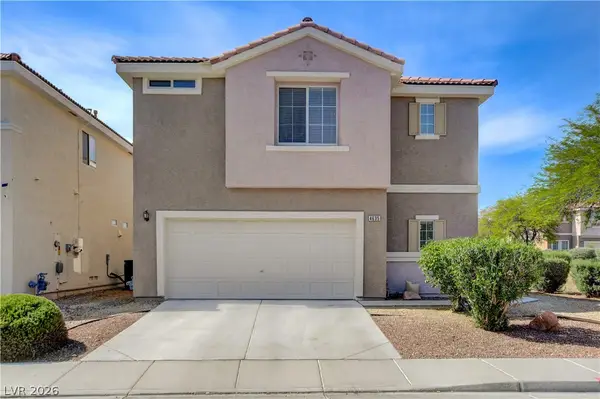 $408,000Active3 beds 3 baths1,805 sq. ft.
4635 Abbottwood Avenue, North Las Vegas, NV 89031
MLS# 2783793Listed by: LIFE REALTY DISTRICT $425,000Active3 beds 2 baths1,468 sq. ft.
525 Rancho Del Mar Way, North Las Vegas, NV 89031
MLS# 2781743Listed by: KELLER WILLIAMS MARKETPLACE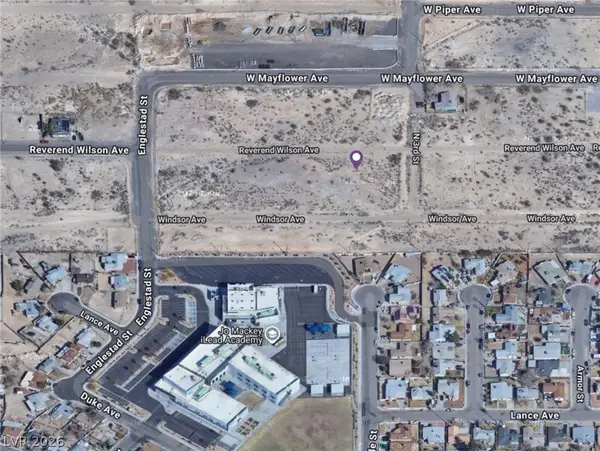 $36,500Active0.11 Acres
Reverend Wilson Avenue, North Las Vegas, NV 89030
MLS# 2784168Listed by: SIGNATURE REAL ESTATE GROUP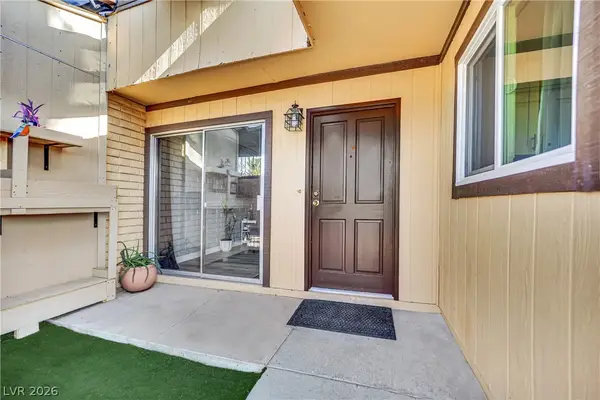 $190,000Active2 beds 2 baths984 sq. ft.
3033 Saint George Street #C, North Las Vegas, NV 89030
MLS# 2785518Listed by: EMPIRE ESTATES REALTY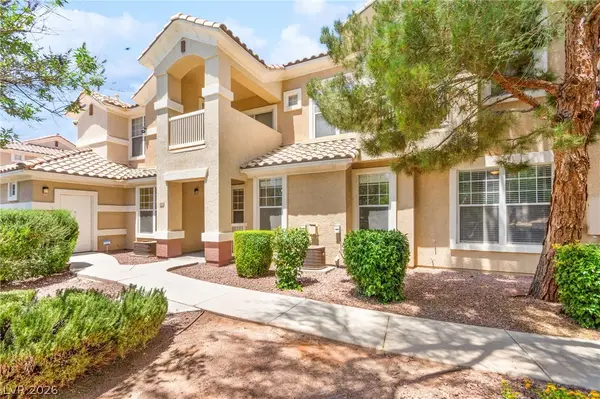 $249,900Active3 beds 2 baths1,487 sq. ft.
5855 Valley Drive #1043, North Las Vegas, NV 89031
MLS# 2785535Listed by: HUNTINGTON & ELLIS, A REAL EST- Open Sat, 3 to 5pm
 $474,888Active4 beds 3 baths2,127 sq. ft.
3823 Berenices Avenue, North Las Vegas, NV 89084
MLS# 2785418Listed by: REAL BROKER LLC 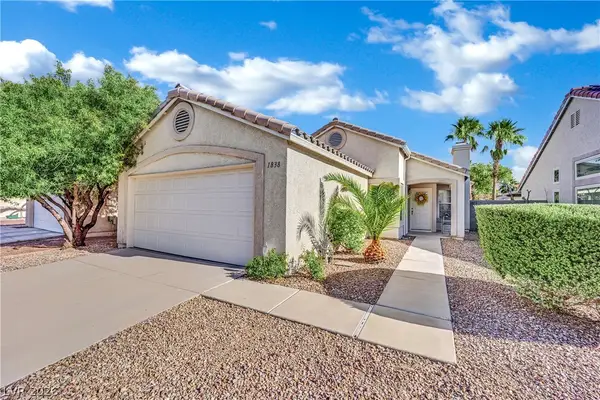 $325,000Pending2 beds 2 baths1,138 sq. ft.
1838 Box Springs Avenue, North Las Vegas, NV 89031
MLS# 2785481Listed by: GALINDO GROUP REAL ESTATE $475,000Pending3 beds 2 baths1,613 sq. ft.
7814 Romulan Street, North Las Vegas, NV 89084
MLS# 2784199Listed by: ALCHEMY INVESTMENTS RE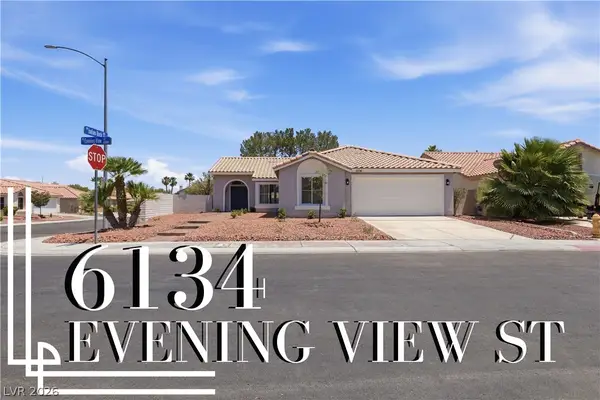 $459,999Active3 beds 2 baths1,826 sq. ft.
6134 Evening View Street, North Las Vegas, NV 89031
MLS# 2785526Listed by: PRECISION REALTY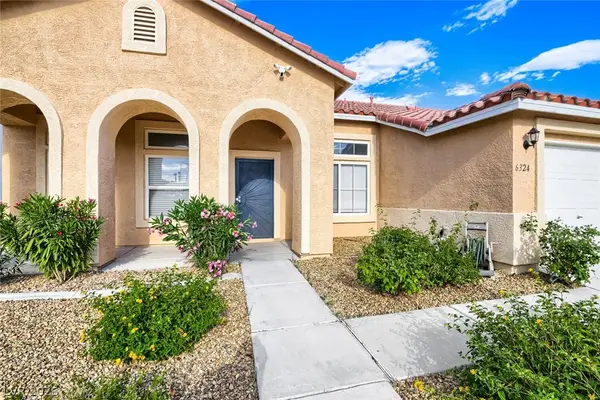 $550,000Active4 beds 3 baths2,747 sq. ft.
6324 Black Oaks Street, North Las Vegas, NV 89031
MLS# 2785523Listed by: REALTY ONE GROUP, INC $344,999Pending3 beds 2 baths1,008 sq. ft.
1201 Taylor Avenue, North Las Vegas, NV 89030
MLS# 2785424Listed by: SIGNATURE REAL ESTATE GROUP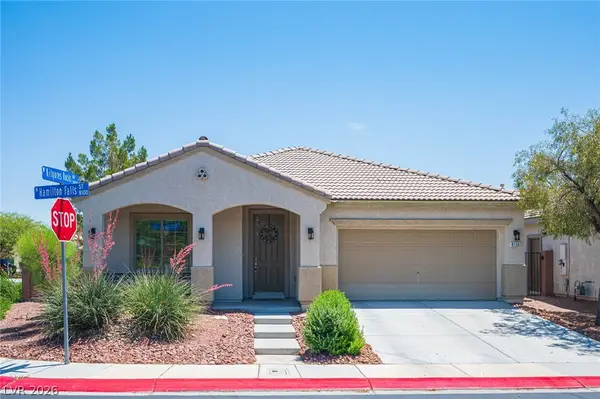 $485,000Active3 beds 2 baths2,119 sq. ft.
8136 Hamilton Falls Street, North Las Vegas, NV 89085
MLS# 2785475Listed by: REAL BROKER LLC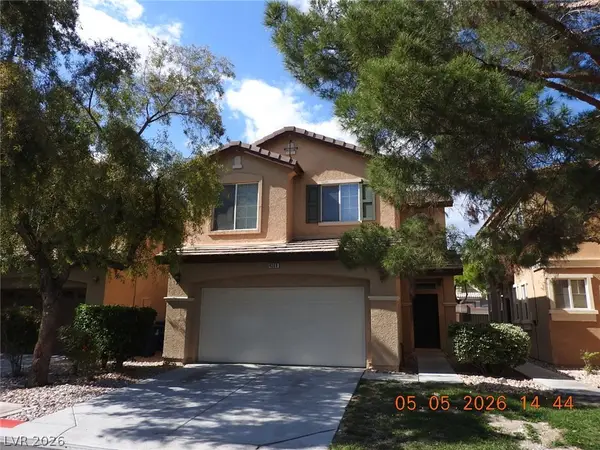 $385,000Active3 beds 3 baths1,517 sq. ft.
4368 Acropolis Avenue, North Las Vegas, NV 89031
MLS# 2785508Listed by: CREATIVE REAL ESTATE ASSOC $400,000Active3 beds 3 baths1,650 sq. ft.
6018 Highland Gardens Drive, North Las Vegas, NV 89031
MLS# 2785517Listed by: REALTY ONE GROUP, INC $454,900Active4 beds 3 baths2,090 sq. ft.
2213 Dale Bumpers Court, North Las Vegas, NV 89081
MLS# 2784248Listed by: REALTY ONE GROUP, INC $371,000Active3 beds 2 baths1,246 sq. ft.
7936 Fantail Drive, North Las Vegas, NV 89084
MLS# 2784325Listed by: SIGNATURE REAL ESTATE GROUP $500,000Active3 beds 3 baths1,850 sq. ft.
5008 Cassia Tree Court, North Las Vegas, NV 89031
MLS# 2785463Listed by: REALTY ONE GROUP, INC $385,000Active3 beds 2 baths1,186 sq. ft.
619 Rancho Del Norte Drive, North Las Vegas, NV 89031
MLS# 2785276Listed by: REALTY ONE GROUP, INC $590,000Active4 beds 4 baths2,520 sq. ft.
4333 Panoramic View Avenue, North Las Vegas, NV 89084
MLS# 2785390Listed by: HUNTZY REALTY, LLC $449,900Active4 beds 3 baths2,319 sq. ft.
3404 Brayton Mist Drive, North Las Vegas, NV 89081
MLS# 2785436Listed by: MORE REALTY INCORPORATED $425,500Active3 beds 2 baths1,606 sq. ft.
Address Withheld By Seller, North Las Vegas, NV 89081
MLS# 2784567Listed by: VEGAS INTERNATIONAL PROPERTIES $409,999Active4 beds 2 baths1,814 sq. ft.
5825 Austin English Street, North Las Vegas, NV 89081
MLS# 2784803Listed by: EXP REALTY $590,000Active3 beds 2 baths2,210 sq. ft.
6205 Gambetta Street, Las Vegas, NV 89115
MLS# 2784927Listed by: EXP REALTY $440,000Active4 beds 3 baths2,316 sq. ft.
2320 Farm Bridge Avenue, North Las Vegas, NV 89081
MLS# 2785352Listed by: REALTY ONE GROUP, INC $579,900Active4 beds 3 baths3,639 sq. ft.
6637 Cliff Shore Court, North Las Vegas, NV 89084
MLS# 2785384Listed by: SIMPLY VEGAS $665,000Active4 beds 4 baths3,806 sq. ft.
3904 Campanario Avenue, North Las Vegas, NV 89084
MLS# 2785395Listed by: COLDWELL BANKER PREMIER $405,900Active3 beds 2 baths1,244 sq. ft.
3245 Basin Desert Street, North Las Vegas, NV 89032
MLS# 2785380Listed by: RW CHRISTIAN $497,900Active4 beds 2 baths1,795 sq. ft.
4536 Cave Lake Avenue, North Las Vegas, NV 89032
MLS# 2785382Listed by: RW CHRISTIAN $413,900Active3 beds 2 baths1,427 sq. ft.
4600 Cave Lake Avenue, North Las Vegas, NV 89032
MLS# 2785386Listed by: RW CHRISTIAN $515,000Active5 beds 3 baths2,639 sq. ft.
941 Willow Berry Avenue, North Las Vegas, NV 89032
MLS# 2784798Listed by: UNITED REALTY GROUP $574,888Active3 beds 2 baths2,196 sq. ft.
7521 Java Sparrow Street, North Las Vegas, NV 89084
MLS# 2783440Listed by: REAL BROKER LLC $349,000Active3 beds 2 baths1,442 sq. ft.
3009 Civic Center Drive, North Las Vegas, NV 89030
MLS# 2785224Listed by: REAL BROKER LLC $380,000Pending4 beds 3 baths2,121 sq. ft.
104 Pollentia Avenue, North Las Vegas, NV 89084
MLS# 2785300Listed by: CHANGE REAL ESTATE, LLC $519,900Active4 beds 3 baths2,329 sq. ft.
7033 Stockton Dunes Street, North Las Vegas, NV 89084
MLS# 2782323Listed by: KELLER WILLIAMS REALTY LAS VEG $399,900Active3 beds 3 baths1,439 sq. ft.
3502 Gold Sluice Avenue, North Las Vegas, NV 89032
MLS# 2785066Listed by: GALINDO GROUP REAL ESTATE $449,990Active5 beds 3 baths2,643 sq. ft.
4127 Agama Street, North Las Vegas, NV 89032
MLS# 2785177Listed by: HUNTINGTON & ELLIS, A REAL EST $425,000Active4 beds 3 baths1,668 sq. ft.
5135 Zapata Lane, North Las Vegas, NV 89031
MLS# 2785269Listed by: LPT REALTY, LLC $505,000Active4 beds 2 baths2,146 sq. ft.
117 Elks Peak Avenue, North Las Vegas, NV 89084
MLS# 2783459Listed by: REALTY ONE GROUP, INC $275,000Active2 beds 2 baths1,220 sq. ft.
495 Dorchester Bend Avenue #3, North Las Vegas, NV 89032
MLS# 2785166Listed by: LIFE REALTY DISTRICT $439,999Active4 beds 3 baths2,482 sq. ft.
7246 Dazzle Point Street, North Las Vegas, NV 89084
MLS# 2784724Listed by: KELLER WILLIAMS REALTY LAS VEG $430,900Active4 beds 3 baths1,989 sq. ft.
6967 Noah Raven Street, North Las Vegas, NV 89084
MLS# 2785081Listed by: RE/MAX CENTRAL $768,000Active6 beds 5 baths3,804 sq. ft.
4104 Cathedral Falls Avenue, North Las Vegas, NV 89085
MLS# 2783989Listed by: LINDSEY BUTLER REAL ESTATE $359,000Active3 beds 2 baths1,247 sq. ft.
4020 Bonita Desert Court, North Las Vegas, NV 89032
MLS# 2785041Listed by: SINCE 1917 REALTY $675,000Active4 beds 3 baths3,050 sq. ft.
1505 Barrington Oaks Street, North Las Vegas, NV 89084
MLS# 2784733Listed by: REAL BROKER LLC $589,000Active4 beds 4 baths2,969 sq. ft.
6432 Birdcall Street, North Las Vegas, NV 89084
MLS# 2784416Listed by: CENTURY 21 AMERICANA $305,000Active3 beds 3 baths1,367 sq. ft.
6312 Sandy Ridge Street #3-102, North Las Vegas, NV 89081
MLS# 2783171Listed by: SPHERE REAL ESTATE $549,000Pending4 beds 3 baths2,747 sq. ft.
6332 Bunch Grass Court, North Las Vegas, NV 89031
MLS# 2784621Listed by: GALINDO GROUP REAL ESTATE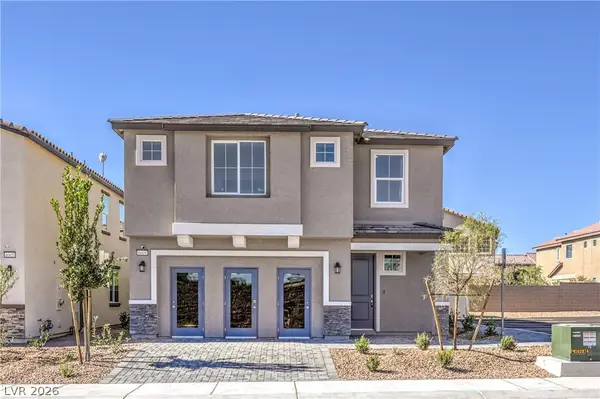 $499,990Active5 beds 3 baths2,660 sq. ft.
3836 Hibiscus Haven Avenue, North Las Vegas, NV 89081
MLS# 2784850Listed by: D R HORTON INC $520,990Pending5 beds 3 baths3,000 sq. ft.
3832 Hibiscus Haven Avenue, North Las Vegas, NV 89081
MLS# 2784868Listed by: D R HORTON INC $350,000Pending3 beds 2 baths1,628 sq. ft.
5021 Cayman Beach Street, North Las Vegas, NV 89031
MLS# 2783948Listed by: LPT REALTY, LLC $399,999Active3 beds 3 baths1,650 sq. ft.
3938 Rain Flower Lane, North Las Vegas, NV 89031
MLS# 2782261Listed by: PREMIER REALTY GROUP $455,000Pending3 beds 2 baths1,917 sq. ft.
4624 Del Laguna Court, North Las Vegas, NV 89031
MLS# 2784617Listed by: REALTY OF AMERICA LLC $385,000Active3 beds 2 baths1,318 sq. ft.
1600 Los Alamos Drive, North Las Vegas, NV 89031
MLS# 2784170Listed by: SERHANT $435,000Active4 beds 3 baths2,138 sq. ft.
6324 Patriot Wave Street, North Las Vegas, NV 89031
MLS# 2784538Listed by: BHHS NEVADA PROPERTIES $429,900Active3 beds 2 baths1,727 sq. ft.
4126 Farmdale Avenue, North Las Vegas, NV 89031
MLS# 2784517Listed by: RED CANYON REALTY $305,000Active4 beds 3 baths1,370 sq. ft.
3389 Cheyenne Gardens Way, North Las Vegas, NV 89032
MLS# 2784658Listed by: NEW CASTLE REALTY & PROPERTY M $365,000Active3 beds 2 baths1,420 sq. ft.
3616 Herring Gull Lane, North Las Vegas, NV 89084
MLS# 2784660Listed by: ZAHLER PROPERTIES LLC $454,900Active4 beds 3 baths2,751 sq. ft.
6428 Amanda Michelle Lane, North Las Vegas, NV 89086
MLS# 2784571Listed by: LPT REALTY LLC $437,000Active4 beds 3 baths1,796 sq. ft.
804 Rancho Sedona Avenue, North Las Vegas, NV 89081
MLS# 2784574Listed by: KNJ REAL ESTATE $424,888Active3 beds 2 baths1,266 sq. ft.
4428 W La Madre Way, North Las Vegas, NV 89031
MLS# 2784443Listed by: J E T REAL ESTATE GROUP $164,900Active2 beds 2 baths976 sq. ft.
3318 N Decatur Boulevard #2007, Las Vegas, NV 89130
MLS# 2784498Listed by: REALTY ONE GROUP, INC $420,000Active3 beds 3 baths2,051 sq. ft.
6375 Ashland Crest Street, Las Vegas, NV 89115
MLS# 2782595Listed by: REAL BROKER LLC $420,000Active3 beds 2 baths1,803 sq. ft.
6720 Sugarbird Court, North Las Vegas, NV 89084
MLS# 2783889Listed by: EQUITY NV REAL ESTATE-VEGAS $349,900Pending4 beds 4 baths2,026 sq. ft.
4650 Ranch House Road #64, North Las Vegas, NV 89031
MLS# 2784410Listed by: WEDGEWOOD HOMES REALTY, LLC $295,000Active3 beds 1 baths999 sq. ft.
3041 Harewood Avenue, North Las Vegas, NV 89030
MLS# 2783973Listed by: ROTHWELL GORNT COMPANIES $614,998Active4 beds 4 baths2,472 sq. ft.
4617 Pacer Avenue, North Las Vegas, NV 89031
MLS# 2784335Listed by: PRECISION REALTY $445,000Active3 beds 2 baths1,772 sq. ft.
5046 Great Abaco Street, North Las Vegas, NV 89031
MLS# 2784320Listed by: VEGAS DREAM HOMES INC $400,000Active3 beds 2 baths1,797 sq. ft.
1709 Eagle View Way, North Las Vegas, NV 89032
MLS# 2775270Listed by: KELLER WILLIAMS MARKETPLACE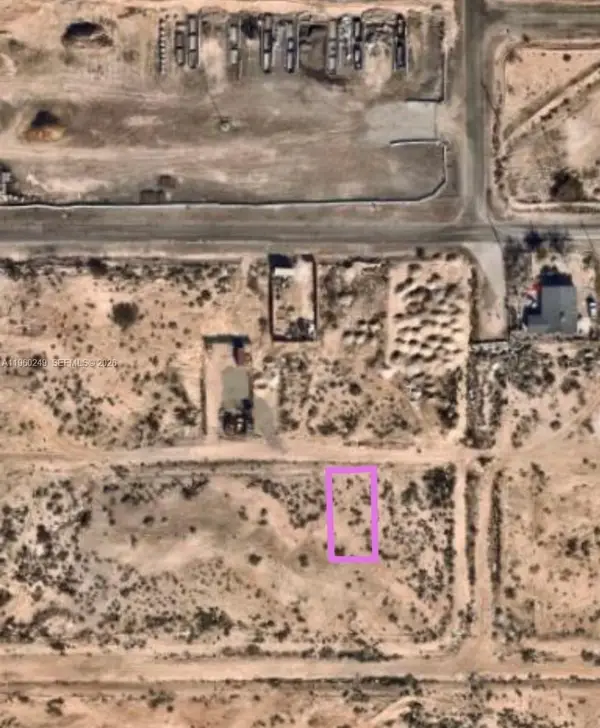 $36,000Active0.16 Acres
Reverend Wilson Ave, ,, NV 89030
MLS# A11960249Listed by: REALTY HUB $444,900Active3 beds 3 baths2,267 sq. ft.
5529 Meridian Rain Street, North Las Vegas, NV 89031
MLS# 2784100Listed by: REAL BROKER LLC $515,990Pending4 beds 2 baths1,839 sq. ft.
7920 Justin Cove Street, North Las Vegas, NV 89084
MLS# 2783576Listed by: D R HORTON INC $600,000Pending5 beds 4 baths3,790 sq. ft.
2225 Mountain Rail Drive, North Las Vegas, NV 89084
MLS# 2783812Listed by: SPHERE REAL ESTATE $559,990Active5 beds 3 baths3,000 sq. ft.
7388 Dominguez Bay Drive, North Las Vegas, NV 89084
MLS# 2784138Listed by: D R HORTON INC $484,542Active4 beds 3 baths2,333 sq. ft.
4249 Zilker Park Avenue, North Las Vegas, NV 89081
MLS# 2784145Listed by: KB HOME NEVADA INC $340,000Pending4 beds 2 baths1,152 sq. ft.
2608 Donna Street, North Las Vegas, NV 89030
MLS# 2784196Listed by: MORE REALTY INCORPORATED $559,990Active5 beds 3 baths3,000 sq. ft.
7396 Dominguez Bay Drive, North Las Vegas, NV 89084
MLS# 2784236Listed by: D R HORTON INC $355,000Pending3 beds 3 baths1,539 sq. ft.
3632 Lakeside Villas Avenue, North Las Vegas, NV 89081
MLS# 2784246Listed by: EASY STREET REALTY LAS VEGAS
Local realty services provided by:CENTURY 21 1st Priority Realty, CENTURY 21 World Connection
Information deemed reliable but not guaranteed. Information is provided, in part, by Greater Miami MLS. This information being provided is for consumer's personal, non-commercial use and may not be used for any other purpose other than to identify prospective properties consumers may be interested in purchasing.
Neighborhoods near North Las Vegas, NV
Zip codes near North Las Vegas, NV
- 89030 homes for sale
- 89031 homes for sale
- 89032 homes for sale
- 89081 homes for sale
- 89084 homes for sale
- 89085 homes for sale
- 89086 homes for sale
- 89101 homes for sale
- 89104 homes for sale
- 89106 homes for sale
- 89107 homes for sale
- 89108 homes for sale
- 89110 homes for sale
- 89115 homes for sale
- 89128 homes for sale
- 89129 homes for sale
- 89130 homes for sale
- 89131 homes for sale
- 89143 homes for sale
- 89149 homes for sale
Popular searches near North Las Vegas, NV
- Blue Diamond homes for sale
- Boulder City homes for sale
- Clark homes for sale
- Cold Creek homes for sale
- Enterprise homes for sale
- Henderson homes for sale
- Indian Springs homes for sale
- Jean homes for sale
- Las Vegas homes for sale
- Moapa homes for sale
- Moapa Town homes for sale
- Moapa Valley homes for sale
- Mt Charleston homes for sale
- Paradise homes for sale
- Sandy Valley homes for sale
- Spring Valley homes for sale
- Summerlin South homes for sale
- Sunrise Manor homes for sale
- Whitney homes for sale
- Winchester homes for sale
Protect your home and budget from life's surprises with an Assurant Home Warranty, backed by a partner that supports you through every step of homeownership. Explore Plans.
©2026 Century 21 Real Estate LLC. All rights reserved. CENTURY 21®, the CENTURY 21 Logo and C21® are service marks owned by Century 21 Real Estate LLC. Century 21 Real Estate LLC fully supports the principles of the Fair Housing Act and the Equal Opportunity Act. Each office is independently owned and operated. Listing information is deemed reliable but not guaranteed accurate.