- Bellechase, Ocala homes for sale
- Citrus Springs, Citrus Springs homes for sale
- Country Club Estates at Rainbow Springs, Dunnellon homes for sale
- Del Webb Stone Creek, Ocala homes for sale
- Heath Brook, Ocala homes for sale
- Kingsland Country, Ocala homes for sale
- Lake Diamond Golf & Country Club, Ocala homes for sale
- Lakeside Landings, Oxford homes for sale
- Oak Run, Ocala homes for sale
- On Top of the World, Ocala homes for sale
- Rolling Hills, Dunnellon homes for sale
- Santo Domingo, The Villages homes for sale
- Silver Springs Shores, Ocala homes for sale
- Spruce Creek Country Club, Summerfield homes for sale
- Stonecrest, Summerfield homes for sale
- The Fairways, Ocala homes for sale
- The Villages, The Villages homes for sale
- Village Alhambra, The Villages homes for sale
- Village of Winifred, The Villages homes for sale
- Village Santiago, The Villages homes for sale
Ocala, FL - homes for rent
2 of 2 results displayed
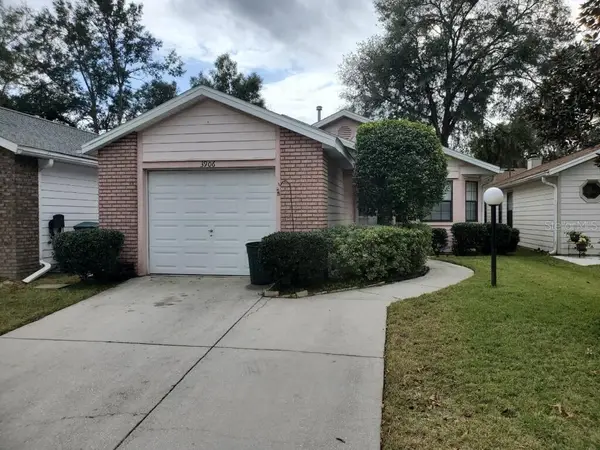
 $1,599 per monthActive2 beds 2 baths1,296 sq. ft.
3906 NE 22nd Street, OCALA, FL 34470
MLS# O6337035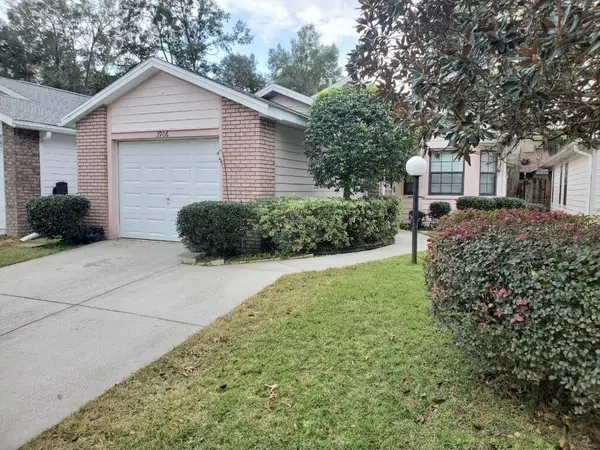 $1,699 per monthActive2 beds 2 baths1,296 sq. ft.
3906 NE 22nd Street, OCALA, FL 34470
MLS# O6296221
Neighborhoods near Ocala, FL
Zip codes near Ocala, FL
- 32113 homes for sale
- 32617 homes for sale
- 32664 homes for sale
- 32686 homes for sale
- 34420 homes for sale
- 34432 homes for sale
- 34434 homes for sale
- 34470 homes for sale
- 34471 homes for sale
- 34472 homes for sale
- 34473 homes for sale
- 34474 homes for sale
- 34475 homes for sale
- 34476 homes for sale
- 34479 homes for sale
- 34480 homes for sale
- 34481 homes for sale
- 34482 homes for sale
- 34484 homes for sale
- 34491 homes for sale
Popular searches near Ocala, FL
- Anthony homes for sale
- Belleview homes for sale
- Citra homes for sale
- Dunnellon homes for sale
- Fellowship homes for sale
- Fort McCoy-Anthony homes for sale
- Liberty Triangle homes for sale
- Marion Oaks homes for sale
- Morriston homes for sale
- Ocala Estates homes for sale
- Ocklawaha homes for sale
- On Top Of The World homes for sale
- Oxford homes for sale
- Rainbow Park homes for sale
- Rainbow Springs homes for sale
- Reddick homes for sale
- Reddick-McIntosh homes for sale
- Silver Springs homes for sale
- Silver Springs Shores homes for sale
- Summerfield homes for sale
Protect your home and budget from life's surprises with an Assurant Home Warranty, backed by a partner that supports you through every step of homeownership. Explore Plans.
©2026 Century 21 Real Estate LLC. All rights reserved. CENTURY 21®, the CENTURY 21 Logo and C21® are service marks owned by Century 21 Real Estate LLC. Century 21 Real Estate LLC fully supports the principles of the Fair Housing Act and the Equal Opportunity Act. Each office is independently owned and operated. Listing information is deemed reliable but not guaranteed accurate.