- Alexander Pointe, Hopkins homes for sale
- Caughman Park, Columbia homes for sale
- Central Rosewood, Columbia homes for sale
- Charlestowne, Columbia homes for sale
- East Lake, Columbia homes for sale
- Eastmont, Columbia homes for sale
- Hampton Hills, Columbia homes for sale
- Hampton Leas, Columbia homes for sale
- Harlem, Columbia homes for sale
- Hazelwood Acres, Columbia homes for sale
- Hickory Ridge, Columbia homes for sale
- Kings Grant, Columbia homes for sale
- Knollwood, Columbia homes for sale
- Lexington Hills, Lexington homes for sale
- Meadowfield, Columbia homes for sale
- Olympia, Columbia homes for sale
- Reflections, Columbia homes for sale
- Rockford Place at Charwood, West Columbia homes for sale
- South Kilbourne, Columbia homes for sale
- Waterbury, Columbia homes for sale
Orangeburg, SC - homes for sale
232 of 232 results displayed
- New
 $240,000Active6 beds 2 baths3,843 sq. ft.
1438 Glover Street, Orangeburg, SC 29115
MLS# 635970Listed by: NORTHGROUP REAL ESTATE LLC - New
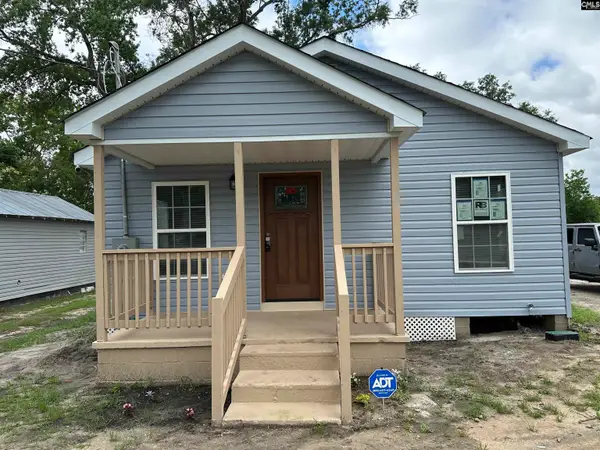
 $199,500Active4 beds 3 baths2,424 sq. ft.
332 Berry Street, Orangeburg, SC 29115
MLS# 26016569Listed by: THE MOORE GROUP - A DIVISION OF THE LITCHFIELD COMPANY - New
 $70,000Active2 beds 2 baths1,092 sq. ft.
112 Garnet Street, Orangeburg, SC 29118
MLS# 26016555Listed by: BETTER HOMES AND GARDENS REAL ESTATE PALMETTO - New
 $45,000Active0.68 Acres
1711 Chestnut Street, Orangeburg, SC 29115
MLS# 635611Listed by: CENTURY 21 VANGUARD - New
 $162,500Active2 beds 1 baths875 sq. ft.
862 Bleakley Street, Orangeburg, SC 29115
MLS# 635435Listed by: FELDER & ASSOCIATES - New
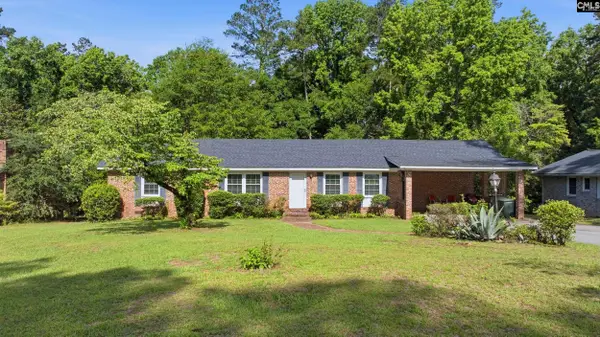
 $239,900Active3 beds 2 baths1,734 sq. ft.
1353 Marshall Street, Orangeburg, SC 29118
MLS# 26015837Listed by: NEXT LEVEL REAL ESTATE - New
 $272,500Active3 beds 2 baths1,400 sq. ft.
2034 NE Longwood Road, Orangeburg, SC 29118
MLS# 26015758Listed by: SYNERGY GROUP PROPERTIES - New
 $245,000Active4 beds 2 baths2,406 sq. ft.
1968 Pinebrook Street, Orangeburg, SC 29118
MLS# 635270Listed by: KELLER WILLIAMS REALTY - New
 $99,999Active8 beds 2 baths2,229 sq. ft.
147 Lowman Street, Orangeburg, SC 29115
MLS# 26015575Listed by: SINCERE HOME SOLUTIONS, LLC  $109,900Active3 beds 2 baths1,247 sq. ft.
1230 Brickle St, Orangeburg, SC 29118
MLS# 635105Listed by: TRANSIT REALTY LLC $79,900Active2 beds 1 baths616 sq. ft.
117 Roache Ct, Orangeburg, SC 29115
MLS# 635067Listed by: REAL BROKER LLC $269,900Active4 beds 3 baths2,200 sq. ft.
592 Medway Drive, Orangeburg, SC 29118
MLS# 635055Listed by: CENTURY 21 803 REALTY $199,900Active3 beds 2 baths1,344 sq. ft.
1770 Nix Street, Orangeburg, SC 29115
MLS# 635049Listed by: JPAR MAGNOLIA GROUP $199,999Active3 beds 2 baths1,475 sq. ft.
565 Louis Street, Orangeburg, SC 29115
MLS# 26015078Listed by: SINCERE HOME SOLUTIONS, LLC $265,000Active3 beds 3 baths1,704 sq. ft.
126 Tahoe Drive, Orangeburg, SC 29118
MLS# 26015062Listed by: D. R. HORTON, INC $199,500Active2 beds 1 baths1,608 sq. ft.
2203 Middleton Street, Orangeburg, SC 29115
MLS# 26014920Listed by: THE MOORE GROUP - A DIVISION OF THE LITCHFIELD COMPANY $300,000Active4 beds 4 baths2,722 sq. ft.
1419 Gue Road, Orangeburg, SC 29115
MLS# 634239Listed by: COLDWELL BANKER REALTY $295,000Active2 beds 3 baths2,188 sq. ft.
112 Aster Court, Orangeburg, SC 29118
MLS# 26014007Listed by: THE MOORE GROUP - A DIVISION OF THE LITCHFIELD COMPANY $245,000Active3 beds 2 baths1,524 sq. ft.
571 Hodges Drive, Orangeburg, SC 29118
MLS# 26013907Listed by: BETTER HOMES AND GARDENS REAL ESTATE PALMETTO $298,330Active3 beds 3 baths2,547 sq. ft.
275 Club Acres Boulevard, Orangeburg, SC 29118
MLS# 634078Listed by: EXIT REAL EST CONSULTANTS $245,900Active4 beds 3 baths1,839 sq. ft.
238 Club Acres Boulevard, Orangeburg, SC 29118
MLS# 26013771Listed by: KELLER WILLIAMS PALMETTO $198,500Active3 beds 2 baths1,378 sq. ft.
949 Nance Street, Orangeburg, SC 29115
MLS# 26013616Listed by: MIDDLETON AND ASSOCIATES, REALTORS, INC. $350,000Active5 beds 3 baths2,104 sq. ft.
2313 NW Fairway Drive, Orangeburg, SC 29118
MLS# 26013344Listed by: LPT REALTY, LLC $350,000Pending5 beds 3 baths2,104 sq. ft.
2313 Fairway Drive, Orangeburg, SC 29118
MLS# 633613Listed by: LPT REALTY LLC $185,000Active3 beds 2 baths1,178 sq. ft.
516 Rosewood Drive, Orangeburg, SC 29115
MLS# 26013245Listed by: ROBINSON REAL ESTATE SERVICES INC. $245,000Active4 beds 2 baths1,928 sq. ft.
2753 Hillcrest Avenue, Orangeburg, SC 29118
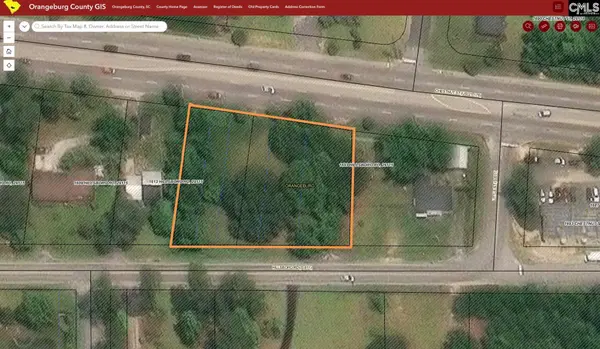
MLS# 26013097Listed by: NEXT LEVEL REAL ESTATE $125,000Active1.67 Acres
TBD Magnolia Street, Orangeburg, SC 29118
MLS# 633412Listed by: CBA REALTY $195,000Active3.49 Acres
TBD Magnolia Street, Orangeburg, SC 29118
MLS# 633415Listed by: CBA REALTY $15,000Active0.29 Acres
118 Third Avenue, Orangeburg, SC 29115
MLS# 633370Listed by: GRAND PALMETTO REALTY LLC $219,500Pending3 beds 2 baths1,189 sq. ft.
436 Young Town Circle, Orangeburg, SC 29118
MLS# 633283Listed by: MIDDLETON & ASSOC REALTORS INC $125,000Pending2 beds 1 baths1,209 sq. ft.
2300 Russell Street, Orangeburg, SC 29115
MLS# 26012662Listed by: KELLER WILLIAMS REALTY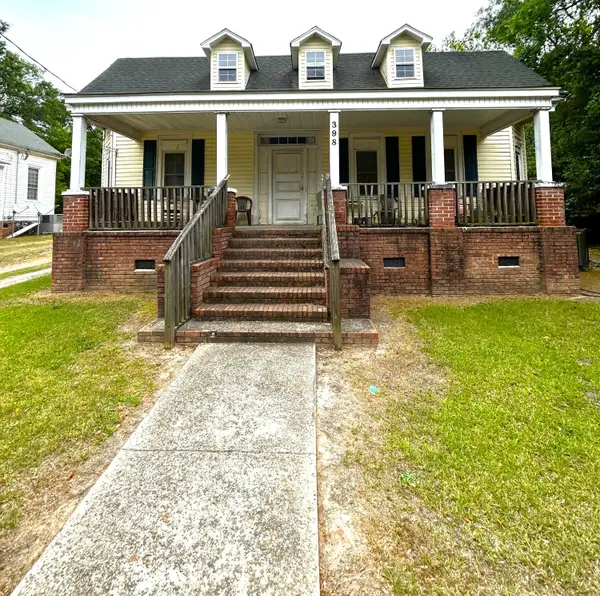 $99,000Active2 beds 2 baths1,267 sq. ft.
398 Sellers Street, Orangeburg, SC 29115
MLS# 26012589Listed by: TRUHOME REALTY $265,000Active3 beds 3 baths1,704 sq. ft.
126 Tahoe Drive, Orangeburg, SC 29118
MLS# 633004Listed by: DR HORTON INC $290,900Active3 beds 3 baths1,871 sq. ft.
761 Partridge Rd, Orangeburg, SC 29118
MLS# 633006Listed by: KELLER WILLIAMS PALMETTO $30,000Active3 beds 1 baths844 sq. ft.
111 Stevefelkel Drive, Orangeburg, SC 29115
MLS# 632891Listed by: GRAND PALMETTO REALTY LLC $20,000Active3 beds 1 baths1,074 sq. ft.
116 Third Street, Orangeburg, SC 29115
MLS# 632889Listed by: GRAND PALMETTO REALTY LLC $25,000Active3 beds 1 baths1,505 sq. ft.
140 Franklin Street, Orangeburg, SC 29115
MLS# 632890Listed by: GRAND PALMETTO REALTY LLC $39,900Pending2 beds 1 baths1,004 sq. ft.
377 Sprinkle Avenue, Orangeburg, SC 29115
MLS# 26012250Listed by: MIDDLETON AND ASSOCIATES, REALTORS, INC. $234,500Active4 beds -- baths1,782 sq. ft.
944 Park Street, Orangeburg, SC 29115
MLS# 26012396Listed by: ERA WILDER REALTY INC. $75,000Pending3 beds 1 baths1,519 sq. ft.
1043 Henley St, Orangeburg, SC 29115
MLS# 632583Listed by: REAL BROKER LLC $290,000Active3 beds 2 baths1,720 sq. ft.
1286 Beauregard Street, Orangeburg, SC 29115
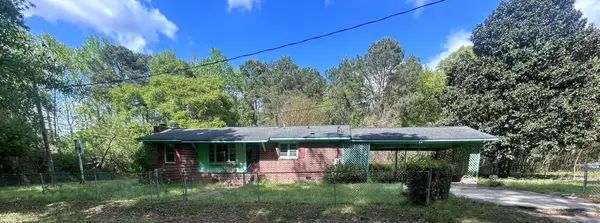
MLS# 26011847Listed by: BETTER HOMES AND GARDENS REAL ESTATE PALMETTO $59,900Active3 beds 1 baths1,490 sq. ft.
936 Glover Street, Orangeburg, SC 29115
MLS# 26011845Listed by: ROBINSON REAL ESTATE SERVICES INC. $234,900Active4 beds 2 baths2,046 sq. ft.
2070 Loblolly Lane, Orangeburg, SC 29115
MLS# 632363Listed by: NEXTHOME SPECIALISTS $499,500Active4 beds 3 baths3,243 sq. ft.
220 Club Acres Boulevard, Orangeburg, SC 29118
MLS# 26011668Listed by: TRUHOME REALTY $319,000Active3 beds 4 baths2,400 sq. ft.
260 Perryclear Street, Orangeburg, SC 29115
MLS# 26011440Listed by: ERA WILDER REALTY, INC $379,000Active4 beds 3 baths2,324 sq. ft.
Address Withheld By Seller, Orangeburg, SC 29115
MLS# 26011364Listed by: TRUHOME REALTY $299,500Pending5 beds 3 baths3,586 sq. ft.
443 Club Acres Boulevard, Orangeburg, SC 29118
MLS# 26011329Listed by: TRUHOME REALTY $229,500Active4 beds 4 baths3,006 sq. ft.
940 Ellis Avenue, Orangeburg, SC 29115
MLS# 632071Listed by: TRUHOME REALTY $299,500Pending5 beds 3 baths3,586 sq. ft.
443 Club Acres Boulevard, Orangeburg, SC 29115
MLS# 632072Listed by: TRUHOME REALTY $400,000Active8 beds 9 baths4,543 sq. ft.
155 Lovell Street, Orangeburg, SC 29115
MLS# 26011783Listed by: BHHS CAROLINA SUN REAL ESTATE $319,900Active4 beds 3 baths2,167 sq. ft.
252 Club Acres, Orangeburg, SC 29118
MLS# 26011196Listed by: BEYCOME BROKERAGE REALTY LLC $149,900Pending3 beds 2 baths
842 Links Court, Orangeburg, SC 29115
MLS# 1588675Listed by: REAL BROKER, LLC $185,000Active3 beds 2 baths1,899 sq. ft.
1241 Park Street, Orangeburg, SC 29115
MLS# 26010297Listed by: BETTER HOMES AND GARDENS REAL ESTATE PALMETTO $130,000Pending3 beds 2 baths1,390 sq. ft.
1571 Marshall Street, Orangeburg, SC 29118
MLS# 26010717Listed by: MIDDLETON AND ASSOCIATES, REALTORS, INC. $21,500Active0.79 Acres
0 S Circle Drive, Orangeburg, SC 29118
MLS# 26010526Listed by: MIDDLETON AND ASSOCIATES, REALTORS, INC. $35,000Pending3 beds 2 baths1,954 sq. ft.
1554 Glover Street, Orangeburg, SC 29115
MLS# 26010425Listed by: BEYCOME BROKERAGE REALTY LLC $105,000Active6.98 Acres
0 Moorecrum Road, Orangeburg, SC 29118
MLS# 26010085Listed by: MIDDLETON AND ASSOCIATES, REALTORS, INC. $315,000Active3 beds 2 baths2,801 sq. ft.
2279 Chestnut Street, Orangeburg, SC 29115
MLS# 26009858Listed by: TRUHOME REALTY $232,800Pending3 beds 2 baths1,198 sq. ft.
472 Young Town Circle, Orangeburg, SC 29118
MLS# 26009832Listed by: MIDDLETON AND ASSOCIATES, REALTORS, INC. $219,500Active3 beds 2 baths1,189 sq. ft.
448 Young Town Circle, Orangeburg, SC 29118
MLS# 26009823Listed by: MIDDLETON AND ASSOCIATES, REALTORS, INC. $219,500Active3 beds 2 baths1,189 sq. ft.
424 Young Town Circle, Orangeburg, SC 29118
MLS# 26009815Listed by: MIDDLETON AND ASSOCIATES, REALTORS, INC. $219,500Pending3 beds 2 baths1,189 sq. ft.
436 Young Town Circle, Orangeburg, SC 29118
MLS# 26009820Listed by: MIDDLETON AND ASSOCIATES, REALTORS, INC. $255,115Pending3 beds 2 baths1,281 sq. ft.
125 Tahoe Drive, Orangeburg, SC 29118
MLS# 26009697Listed by: D. R. HORTON, INC $45,000Pending3 beds 1 baths868 sq. ft.
1655 Irvin Street, Orangeburg, SC 29115
MLS# 630876Listed by: PARAGON REALTY $215,000Pending3 beds 2 baths1,256 sq. ft.
141 Hale Road, Orangeburg, SC 29115
MLS# 630850Listed by: DR HORTON INC- $99,000Active3 beds 1 baths1,732 sq. ft.
955 Whitman Street, Orangeburg, SC 29115
MLS# 630814Listed by: REALTY ONE GROUP RESIDE  $133,000Active3 beds 1 baths1,200 sq. ft.
356 Seminole Drive, Orangeburg, SC 29115
MLS# 26009575Listed by: THE MOORE GROUP - A DIVISION OF THE LITCHFIELD COMPANY $559,000Active4 beds 5 baths3,846 sq. ft.
Address Withheld By Seller, Orangeburg, SC 29118
MLS# 26009451Listed by: TRUHOME REALTY $148,000Active2 beds 1 baths1,103 sq. ft.
Address Withheld By Seller, Orangeburg, SC 29115
MLS# 26009441Listed by: TRUHOME REALTY $330,000Pending5 beds 3 baths2,200 sq. ft.
384 Young Town Circle, Orangeburg, SC 29115
MLS# 630604Listed by: MIDDLETON & ASSOC REALTORS INC $320,000Pending5 beds 3 baths2,200 sq. ft.
460 Young Town Circle, Orangeburg, SC 29118
MLS# 630609Listed by: MIDDLETON & ASSOC REALTORS INC $229,500Active4 beds 4 baths3,006 sq. ft.
940 Ellis Avenue, Orangeburg, SC 29115
MLS# 26009345Listed by: TRUHOME REALTY $133,900Active3 beds 1 baths1,102 sq. ft.
1324 Springdale Drive, Orangeburg, SC 29118
MLS# 26009025Listed by: FELDER & ASSOCIATES REAL ESTATE SERVICES $425,000Active4 beds 3 baths2,982 sq. ft.
1165 Pruitt Drive, Orangeburg, SC 29118
MLS# 26009003Listed by: MIDDLETON AND ASSOCIATES, REALTORS, INC. $245,000Pending3 beds 2 baths1,459 sq. ft.
129 Tahoe Drive, Orangeburg, SC 29118
MLS# 630344Listed by: DR HORTON INC $75,500Active2 beds 1 baths1,032 sq. ft.
320 Wade Court, Orangeburg, SC 29115
MLS# 26008970Listed by: BEYCOME BROKERAGE REALTY LLC $127,000Active3 beds 1 baths1,139 sq. ft.
1069 Chestnut Street, Orangeburg, SC 29115
MLS# 26008943Listed by: NEXT LEVEL REAL ESTATE $150,000Active8 beds 4 baths3,600 sq. ft.
1660 Windsor Street, Orangeburg, SC 29115
MLS# 4358102Listed by: KELLER WILLIAMS BALLANTYNE AREA $175,000Active3 beds 2 baths1,686 sq. ft.
1896 Middleton Street, Orangeburg, SC 29115
MLS# 630155Listed by: REAL ESTATE ASSOCIATES LLC $269,000Active3 beds 3 baths2,211 sq. ft.
2069 Hydrick Ave, Orangeburg, SC 29118
MLS# 630115Listed by: TRUHOME REALTY $197,500Active2 beds 2 baths1,045 sq. ft.
145 Hale Road, Orangeburg, SC 29115
MLS# 26008562Listed by: D. R. HORTON, INC $200,000Active0.77 Acres
1308 Cordova Road, Orangeburg, SC 29115
MLS# 630018Listed by: SOUTHERN VISIONS REALTY I LLC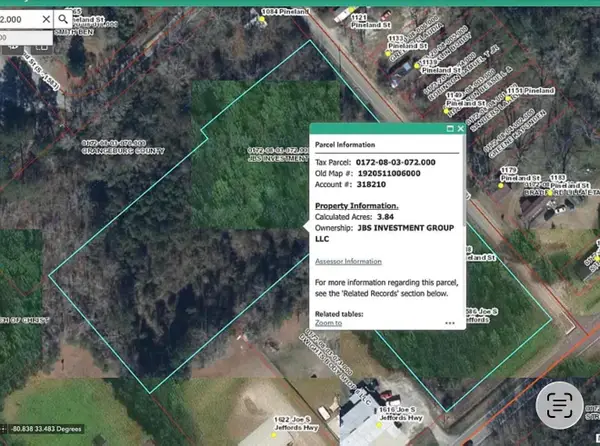 $215,000Active3.84 Acres
000 Joe S Jeffords Highway, Orangeburg, SC 29115
MLS# 26008268Listed by: LPT REALTY, LLC $257,900Active3 beds 3 baths2,304 sq. ft.
2015 Middleton Street, Orangeburg, SC 29115
MLS# 629596Listed by: SLATE REALTY $217,000Pending3 beds 2 baths1,256 sq. ft.
157 Stamford Road, Orangeburg, SC 29115
MLS# 26007798Listed by: D. R. HORTON, INC $480,000Active-- beds -- baths2,025 sq. ft.
471 Reid Street, Orangeburg, SC 29115
MLS# 26007607Listed by: LPT REALTY, LLC $199,900Active2 beds 1 baths1,363 sq. ft.
1697 Broughton Street, Orangeburg, SC 29115
MLS# 26007524Listed by: THE MOORE GROUP - A DIVISION OF THE LITCHFIELD COMPANY $217,500Pending3 beds 2 baths1,256 sq. ft.
155 Hale Road, Orangeburg, SC 29115
MLS# 629327Listed by: DR HORTON INC $209,500Pending3 beds 2 baths1,181 sq. ft.
156 Hale Road, Orangeburg, SC 29115
MLS# 629304Listed by: DR HORTON INC $208,500Pending3 beds 2 baths1,181 sq. ft.
161 Stamford Road, Orangeburg, SC 29115
MLS# 629282Listed by: DR HORTON INC $324,900Active4 beds 3 baths2,768 sq. ft.
755 Brewton Street, Orangeburg, SC 29115
MLS# 26007355Listed by: MIDDLETON AND ASSOCIATES, REALTORS, INC. $215,000Active48 Acres
Mahogany Lane, Orangeburg, SC 29115
MLS# 629199Listed by: ERA WILDER REALTY $134,000Pending2 beds 1 baths1,230 sq. ft.
1183 Sawyer Street, Orangeburg, SC 29115
MLS# 628733Listed by: MIDDLETON & ASSOC REALTORS INC $260,000Active4 beds 3 baths2,324 sq. ft.
1590 Rhoad Street, Orangeburg, SC 29118
MLS# 26006647Listed by: THE MOORE GROUP - A DIVISION OF THE LITCHFIELD COMPANY $25,000Active0.59 Acres
0 Spring Valley, Orangeburg, SC 29115
MLS# 628613Listed by: REAL BROKER LLC $259,900Active-- beds 3 baths945 sq. ft.
1325-1311 Windsor, Orangeburg, SC 29115
MLS# 26006381Listed by: MIDDLETON AND ASSOCIATES, REALTORS, INC. $159,900Active4 beds 2 baths1,066 sq. ft.
720 Newman Street, Orangeburg, SC 29115
MLS# 26006382Listed by: MIDDLETON AND ASSOCIATES, REALTORS, INC. $85,000Active5 beds 3 baths3,320 sq. ft.
1350 4 Holes Road, Orangeburg, SC 29115
MLS# 628409Listed by: CENTURY 21 VANGUARD $364,900Active4 beds 3 baths2,397 sq. ft.
289 Brookside Drive, Orangeburg, SC 29115
MLS# 26005905Listed by: THE MOORE GROUP - A DIVISION OF THE LITCHFIELD COMPANY $234,900Active3 beds 2 baths2,540 sq. ft.
772 Hillsboro Road, Orangeburg, SC 29118
MLS# 26005867Listed by: JEFF COOK REAL ESTATE LPT REALTY $27,900Active0.92 Acres
475 Coleman Avenue, Orangeburg, SC 29115
MLS# 26005656Listed by: SINCERE HOME SOLUTIONS, LLC $182,500Active3 beds 2 baths1,863 sq. ft.
2243 Riverbank Drive, Orangeburg, SC 29118
MLS# 26005645Listed by: THE MOORE GROUP - A DIVISION OF THE LITCHFIELD COMPANY $80,000Active3 beds 1 baths864 sq. ft.
378 Quick Street, Orangeburg, SC 29115
MLS# 627901Listed by: KELLER WILLIAMS REALTY $35,000Active2 beds 1 baths575 sq. ft.
424 Jamison Avenue, Orangeburg, SC 29115
MLS# 627892Listed by: KELLER WILLIAMS REALTY $189,900Pending5 beds 3 baths4,236 sq. ft.
385 Boulevard Street, Orangeburg, SC 29115
MLS# 627814Listed by: MIDDLETON & ASSOC REALTORS INC $194,900Active2 beds 2 baths2,265 sq. ft.
630 Highland Street, Orangeburg, SC 29115
MLS# 26004946Listed by: MIDDLETON AND ASSOCIATES, REALTORS, INC. $574,900Active5 beds 7 baths5,337 sq. ft.
1560 Lee Boulevard, Orangeburg, SC 29118
MLS# 627381Listed by: MIDDLETON & ASSOC REALTORS INC $209,500Pending3 beds 2 baths1,181 sq. ft.
164 Stamford Road, Orangeburg, SC 29115
MLS# 627275Listed by: DR HORTON INC $27,500Active0.16 Acres
007 Fern Drive, Orangeburg, SC 29115
MLS# 26004755Listed by: TRUHOME REALTY $27,500Active0.16 Acres
008 Fern Drive, Orangeburg, SC 29115
MLS# 26004756Listed by: TRUHOME REALTY $27,500Active0.17 Acres
009 Fern Drive, Orangeburg, SC 29115
MLS# 26004757Listed by: TRUHOME REALTY $29,900Active0.23 Acres
010 Aster Court, Orangeburg, SC 29115
MLS# 26004758Listed by: TRUHOME REALTY $27,500Active0.16 Acres
011 Aster Court, Orangeburg, SC 29115
MLS# 26004760Listed by: TRUHOME REALTY $29,500Active0.23 Acres
012 Aster Court, Orangeburg, SC 29115
MLS# 26004761Listed by: TRUHOME REALTY $27,500Active0.19 Acres
013 Aster Court, Orangeburg, SC 29115
MLS# 26004763Listed by: TRUHOME REALTY $29,500Active0.23 Acres
014 Aster Court, Orangeburg, SC 29115
MLS# 26004766Listed by: TRUHOME REALTY $27,500Active0.18 Acres
001 Fern Drive, Orangeburg, SC 29115
MLS# 26004741Listed by: TRUHOME REALTY $27,500Active0.17 Acres
002 Fern Drive, Orangeburg, SC 29115
MLS# 26004745Listed by: TRUHOME REALTY $27,500Active0.18 Acres
003 Fern Drive, Orangeburg, SC 29115
MLS# 26004748Listed by: TRUHOME REALTY $27,500Active0.17 Acres
004 Fern Drive, Orangeburg, SC 29115
MLS# 26004750Listed by: TRUHOME REALTY $27,500Active0.17 Acres
005 Fern Drive, Orangeburg, SC 29115
MLS# 26004752Listed by: TRUHOME REALTY $27,500Active0.17 Acres
006 Fern Drive, Orangeburg, SC 29115
MLS# 26004753Listed by: TRUHOME REALTY $125,000Active2 beds 1 baths1,209 sq. ft.
2300 Russell Street, Orangeburg, SC 29115
MLS# 627238Listed by: KELLER WILLIAMS REALTY $238,500Active3 beds 2 baths1,480 sq. ft.
175 Willow Bay Drive, Orangeburg, SC 29118
MLS# 627099Listed by: EXP REALTY LLC $225,000Active-- beds 2 baths2,800 sq. ft.
808 Ellis Avenue, Orangeburg, SC 29115
MLS# 26004443Listed by: THE MOORE GROUP - A DIVISION OF THE LITCHFIELD COMPANY $199,000Active4 beds 3 baths1,981 sq. ft.
1587 Henley Street, Orangeburg, SC 29115
MLS# 26004241Listed by: EXP REALTY LLC- $85,000Active1 beds 1 baths4,138 sq. ft.
692 Murray Road, Orangeburg, SC 29115
MLS# 26004084Listed by: RAVENEL ASSOCIATES REAL ESTATE. LLC  $159,900Active3 beds 1 baths1,202 sq. ft.
1135 Gloria Street, Orangeburg, SC 29115
MLS# 26004081Listed by: NEXT LEVEL REAL ESTATE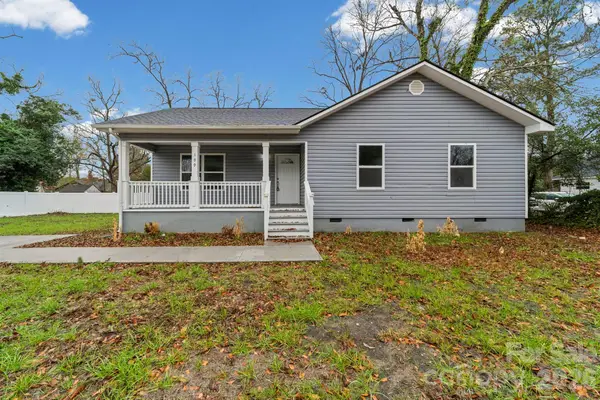 $199,000Active3 beds 2 baths1,200 sq. ft.
109 NW Haddock Road, Orangeburg, SC 29115
MLS# 4345296Listed by: VOTTA REALTY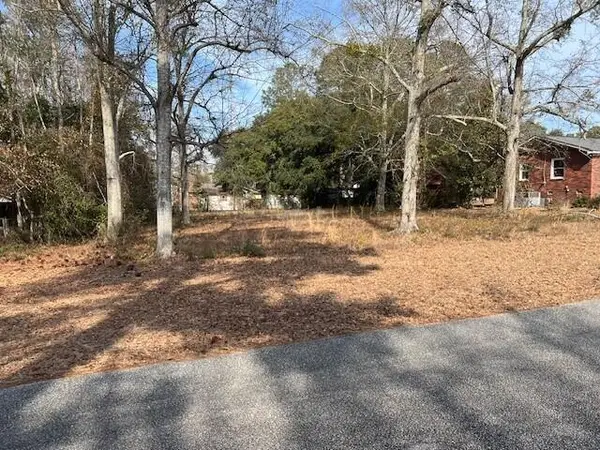 $29,900Active0.4 Acres
0 Northside Street, Orangeburg, SC 29118
MLS# 26003782Listed by: THE MOORE GROUP - A DIVISION OF THE LITCHFIELD COMPANY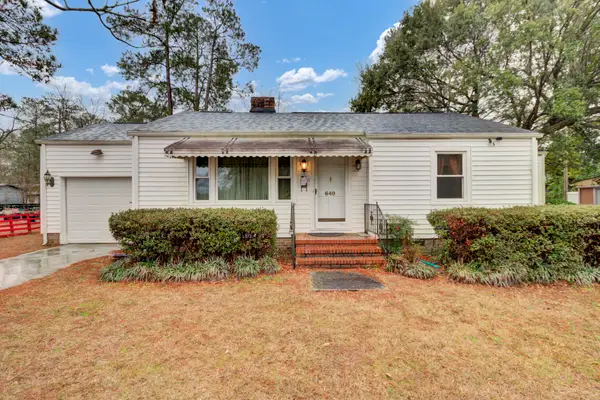 $192,500Active3 beds 2 baths1,700 sq. ft.
640 Bennett Street, Orangeburg, SC 29115
MLS# 26003737Listed by: KELLER WILLIAMS REALTY CHARLESTON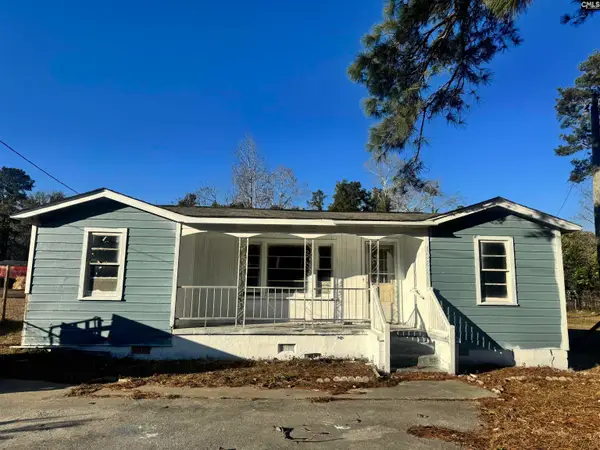 $40,000Pending4 beds 1 baths1,240 sq. ft.
1988 Ott Street, Orangeburg, SC 29115
MLS# 626510Listed by: THE HIGHLAND COMPANY REAL ESTATE LLC $141,900Active-- beds 2 baths1,450 sq. ft.
1294 / 1296 Union Street, Orangeburg, SC 29118
MLS# 626483Listed by: COLDWELL BANKER REALTY $36,000Active0.99 Acres
2359 Broughton Street, Orangeburg, SC 29115
MLS# 504586Listed by: GIBBS REALTY & AUCTION CO INC
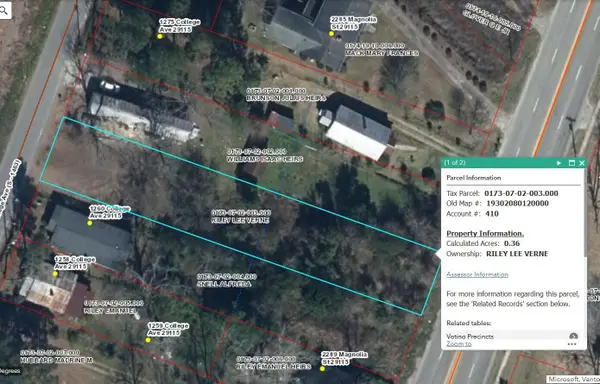 $45,000Active0.36 Acres
0 Magnolia Street, Orangeburg, SC 29115
MLS# 26003580Listed by: MIDDLETON AND ASSOCIATES, REALTORS, INC.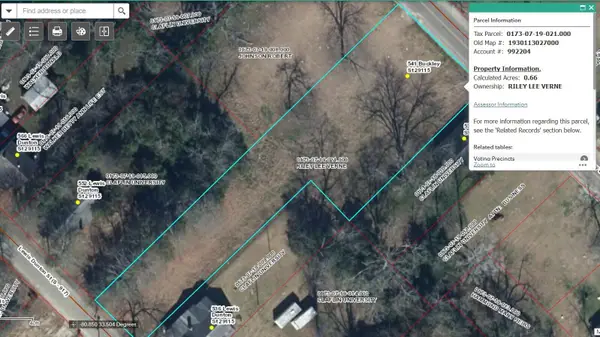 $199,900Active0.66 Acres
541 Buckley Street, Orangeburg, SC 29115
MLS# 26003578Listed by: MIDDLETON AND ASSOCIATES, REALTORS, INC. $179,000Pending3 beds 2 baths1,938 sq. ft.
Address Withheld By Seller, Orangeburg, SC 29115
MLS# 26003245Listed by: TRUHOME REALTY $89,000Active2 beds 3 baths988 sq. ft.
2251 Hillcrest Avenue #6-C, Orangeburg, SC 29115
MLS# 26002921Listed by: MIDDLETON AND ASSOCIATES, REALTORS, INC. $230,000Pending3 beds 2 baths1,281 sq. ft.
133 Tahoe Drive, Orangeburg, SC 29118
MLS# 625926Listed by: DR HORTON INC $129,000Active3 beds 2 baths1,213 sq. ft.
645 Highland Street, Orangeburg, SC 29115
MLS# 504193Listed by: GIBBS REALTY & AUCTION CO INC $89,000Active2 beds 2 baths988 sq. ft.
2251 Hillcrest Avenue #6C, Orangeburg, SC 29118
MLS# 625566Listed by: MIDDLETON & ASSOC REALTORS INC $1,599,000Active8 beds 4 baths6,720 sq. ft.
596 Neeses Hwy Highway, Orangeburg, SC 29115
MLS# 26001648Listed by: BRAND NAME REAL ESTATE $316,500Active4 beds 3 baths2,020 sq. ft.
177 Willow Bay Drive, Orangeburg, SC 29118
MLS# 26001393Listed by: MIDDLETON AND ASSOCIATES, REALTORS, INC. $238,500Active3 beds 2 baths1,480 sq. ft.
179 Willow Bay Drive, Orangeburg, SC 29118
MLS# 26001388Listed by: MIDDLETON AND ASSOCIATES, REALTORS, INC. $575,000Active5 beds 7 baths4,967 sq. ft.
555 Willington Drive, Orangeburg, SC 29118
MLS# 625001Listed by: TRUHOME REALTY $154,000Active3 beds 1 baths1,396 sq. ft.
507 Mimosa Drive, Orangeburg, SC 29115
MLS# 624851Listed by: NEXTHOME MIDLANDS $16,000Active0.35 Acres
0 Magnolia Street, Orangeburg, SC 29115
MLS# 26001008Listed by: MIDDLETON AND ASSOCIATES, REALTORS, INC. $179,856Active3 beds 2 baths975 sq. ft.
825 1st Street, Orangeburg, SC 29115
MLS# 26001015Listed by: CAROLINA ONE REAL ESTATE $239,900Active4 beds 2 baths2,300 sq. ft.
2514 Old Edisto Drive, Orangeburg, SC 29115
MLS# 624682Listed by: SOUTH CAROLINA REALTY $299,000Pending4 beds 3 baths3,125 sq. ft.
Address Withheld By Seller, Orangeburg, SC 29115
MLS# 26000716Listed by: TRUHOME REALTY $263,500Pending3 beds 3 baths1,704 sq. ft.
114 Kirkwood Court, Orangeburg, SC 29118
MLS# 26000439Listed by: D. R. HORTON, INC $60,000Active0.37 Acres
111 Sago Palm Drive, Orangeburg, SC 29118
MLS# 26000372Listed by: PARAGON REALTY $80,000Active0.42 Acres
201 Sago Palm Drive, Orangeburg, SC 29118
MLS# 26000373Listed by: PARAGON REALTY $625,000Active4 beds 4 baths4,224 sq. ft.
1272 NW Lee Blvd Nw Boulevard, Orangeburg, SC 29118
MLS# 26000041Listed by: COLDWELL BANKER REALTY $239,900Active3 beds 2 baths1,642 sq. ft.
2572 Spring Valley Circle, Orangeburg, SC 29118
MLS# 25033184Listed by: BEYCOME BROKERAGE REALTY LLC $206,500Pending3 beds 2 baths1,181 sq. ft.
156 Stamford Road, Orangeburg, SC 29115
MLS# 623908Listed by: DR HORTON INC $150,000Active3 beds 1 baths1,604 sq. ft.
410 Nature Lane, Orangeburg, SC 29115
MLS# 623732Listed by: TRUHOME REALTY $230,000Active4 beds 2 baths1,923 sq. ft.
2198 Skyland Lane, Orangeburg, SC 29118
MLS# 25032816Listed by: CAROLINA ONE REAL ESTATE $316,500Pending4 beds 3 baths2,020 sq. ft.
273 Young Town Circle, Orangeburg, SC 29118
MLS# 623125Listed by: MIDDLETON & ASSOC REALTORS INC $289,900Pending4 beds 3 baths1,778 sq. ft.
372 Young Town Circle, Orangeburg, SC 29118
MLS# 623120Listed by: MIDDLETON & ASSOC REALTORS INC $266,000Active3 beds 3 baths1,704 sq. ft.
167 Tahoe Drive, Orangeburg, SC 29118
MLS# 25032087Listed by: D. R. HORTON, INC $39,900Pending2 beds 1 baths1,004 sq. ft.
377 Sprinkle Avenue, Orangeburg, SC 29115
MLS# 25031679Listed by: MIDDLETON AND ASSOCIATES, REALTORS, INC. $219,900Pending3 beds 2 baths1,189 sq. ft.
249 Young Town Circle, Orangeburg, SC 29115
MLS# 622276Listed by: MIDDLETON & ASSOC REALTORS INC $245,000Pending4 beds 2 baths1,500 sq. ft.
106 Kirkwood Court, Orangeburg, SC 29118
MLS# 25030894Listed by: D. R. HORTON, INC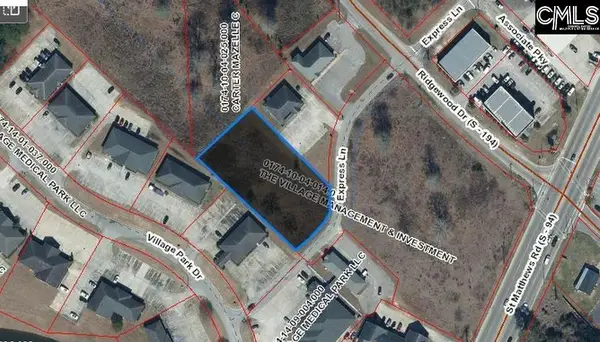 $125,000Active0.88 Acres
Express Lane #2, Orangeburg, SC 29118
MLS# 621854Listed by: SOUTH EAST LAND AND REAL ESTATE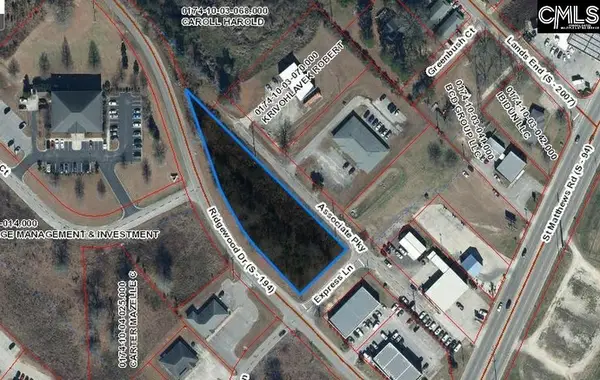 $150,000Active1.05 Acres
Ridgewood Drive #3, Orangeburg, SC 29118
MLS# 621855Listed by: SOUTH EAST LAND AND REAL ESTATE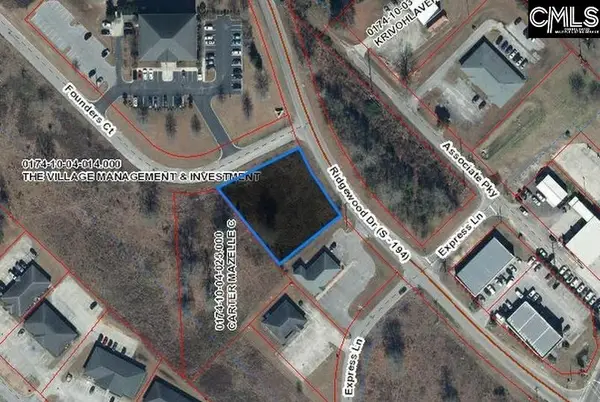 $125,000Active0.74 Acres
Founders Court #4, Orangeburg, SC 29118
MLS# 621856Listed by: SOUTH EAST LAND AND REAL ESTATE $263,500Pending3 beds 3 baths1,704 sq. ft.
118 Kirkwood Court, Orangeburg, SC 29118
MLS# 621839Listed by: DR HORTON INC $219,900Pending2 beds 2 baths1,294 sq. ft.
119 Wellsgrove Lane, Orangeburg, SC 29115
MLS# 621544Listed by: MIDDLETON & ASSOC REALTORS INC $299,900Active4 beds 3 baths1,657 sq. ft.
1359 Columbia Road, Orangeburg, SC 29115
MLS# 621442Listed by: MIDDLETON & ASSOC REALTORS INC $225,000Pending4 beds 2 baths1,851 sq. ft.
675 Alexander Drive, Orangeburg, SC 29118
MLS# 25030110Listed by: NEXT LEVEL REAL ESTATE $25,000Active1 beds 1 baths682 sq. ft.
668 Maple Street, Orangeburg, SC 29115
MLS# 25029991Listed by: CAROLINA ONE REAL ESTATE- $10,000Active0.77 Acres
00 Riley Street, Orangeburg, SC 29118
MLS# 25029691Listed by: THE MOORE GROUP - A DIVISION OF THE LITCHFIELD COMPANY  $329,850Pending5 beds 3 baths2,200 sq. ft.
360 Young Town Circle, Orangeburg, SC 29118
MLS# 25029077Listed by: MIDDLETON AND ASSOCIATES, REALTORS, INC. $34,500Active0 Acres
2359 Broughton Street, Orangeburg, SC 29115
MLS# 502419Listed by: GIBBS REALTY & AUCTION CO INC $35,000Active0.27 Acres
0 Robert E Lee Street, Orangeburg, SC 29115
MLS# 25028450Listed by: HQ REAL ESTATE LLC $225,000Active5 beds 4 baths2,314 sq. ft.
320 Clarendon Street, Orangeburg, SC 29115
MLS# 25028311Listed by: COLDWELL BANKER REALTY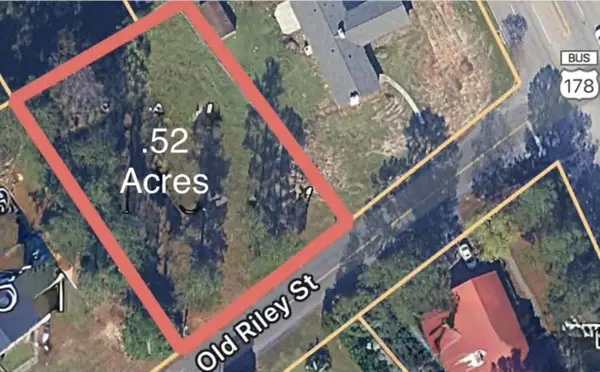 $20,000Active0.52 Acres
0 Old Riley Street, Orangeburg, SC 29115
MLS# 25027894Listed by: NORTHGROUP REAL ESTATE LLC $265,000Active3 beds 3 baths1,704 sq. ft.
110 Kirkwood Court, Orangeburg, SC 29118
MLS# 619531Listed by: DR HORTON INC $770,000Active5 beds 6 baths5,547 sq. ft.
1176 Moore Road, Orangeburg, SC 29118
MLS# 25027428Listed by: THE CASSINA GROUP $189,990Active2 beds 2 baths1,045 sq. ft.
139 Sprocket Road, Orangeburg, SC 29115
MLS# 25026695Listed by: D. R. HORTON, INC $295,000Active4 beds 3 baths3,020 sq. ft.
465 Pike Street, Orangeburg, SC 29115
MLS# 25026340Listed by: THE MOORE GROUP - A DIVISION OF THE LITCHFIELD COMPANY $212,500Pending3 beds 2 baths1,181 sq. ft.
150 Sprocket Road, Orangeburg, SC 29115
MLS# 25025851Listed by: D. R. HORTON, INC $230,000Active3 beds 2 baths1,394 sq. ft.
1895 Columbia Road Road, Orangeburg, SC 29115
MLS# 25024181Listed by: EXP REALTY LLC $24,900Active0.6 Acres
0 Essex Drive, Orangeburg, SC 29118
MLS# 25024109Listed by: MIDDLETON AND ASSOCIATES, REALTORS, INC. $33,900Active0.29 Acres
359 Whaley Street, Orangeburg, SC 29115
MLS# 25023426Listed by: THE MOORE GROUP - A DIVISION OF THE LITCHFIELD COMPANY $74,500Pending3 beds 2 baths1,056 sq. ft.
533 Louis Street, Orangeburg, SC 29115
MLS# 616035Listed by: MIDDLETON & ASSOC REALTORS INC $139,900Active3 beds 2 baths1,478 sq. ft.
1446 Ridgewood Drive, Orangeburg, SC 29115
MLS# 615918Listed by: MIDDLETON & ASSOC REALTORS INC $25,000Pending5.6 Acres
0 Off North Road, Orangeburg, SC 29118
MLS# 25023017Listed by: THE MOORE GROUP - A DIVISION OF THE LITCHFIELD COMPANY $29,900Active0.96 Acres
1550 Riverbank Drive, Orangeburg, SC 29115
MLS# 25022933Listed by: THE MOORE GROUP - A DIVISION OF THE LITCHFIELD COMPANY $319,900Active3 beds 2 baths2,476 sq. ft.
2260 Middleton Street, Orangeburg, SC 29115
MLS# 25022898Listed by: THE MOORE GROUP - A DIVISION OF THE LITCHFIELD COMPANY $225,000Active8.58 Acres
0 Charleston Highway, Orangeburg, SC 29115
MLS# 614830Listed by: EXIT REAL EST CONSULTANTS $184,500Active2 beds 2 baths1,638 sq. ft.
1840 Carolina Avenue, Orangeburg, SC 29115
MLS# 25021448Listed by: MIDDLETON AND ASSOCIATES, REALTORS, INC. $399,500Active5 beds 4 baths3,078 sq. ft.
2467 Griffith Drive, Orangeburg, SC 29118
MLS# 25020706Listed by: THE MOORE GROUP - A DIVISION OF THE LITCHFIELD COMPANY $339,900Active2 Acres
421 Neeses Highway, Orangeburg, SC 29115
MLS# 614043Listed by: MIDDLETON & ASSOC REALTORS INC $249,000Active4 beds 3 baths2,558 sq. ft.
591 Azalea Drive Drive, Orangeburg, SC 29115
MLS# 25020488Listed by: NEXT LEVEL REAL ESTATE $5,500Pending0.06 Acres
TBD Winslow Street, Orangeburg, SC 29115
MLS# 613538Listed by: JEFFCOAT REALTY $30,500Active2 beds 2 baths837 sq. ft.
925 Chitwood Street, Orangeburg, SC 29115
MLS# 25019848Listed by: EXP REALTY LLC $22,000Active0.5 Acres
0 Hidden Valley Drive, Orangeburg, SC 29115
MLS# 613013Listed by: MIDDLETON & ASSOC REALTORS INC $22,000Active0.5 Acres
0 Hidden Drive, Orangeburg, SC 29115
MLS# 25019415Listed by: MIDDLETON AND ASSOCIATES, REALTORS, INC. $195,000Pending2 beds 2 baths1,045 sq. ft.
151 Sprocket Road, Orangeburg, SC 29115
MLS# 25018932Listed by: D. R. HORTON, INC $179,000Active4 beds 3 baths2,150 sq. ft.
1542 Belleville Road, Orangeburg, SC 29115
MLS# 612674Listed by: EXP REALTY LLC $234,000Active3 beds 2 baths1,708 sq. ft.
2778 Riley Street, Orangeburg, SC 29118
MLS# 627356Listed by: MIDDLETON & ASSOC REALTORS INC $25,000Active1.4 Acres
2762 Myrtle Drive, Orangeburg, SC 29115
MLS# 25016731Listed by: TRUHOME REALTY $15,000Active0.67 Acres
2797 Hilda Drive, Orangeburg, SC 29115
MLS# 25016735Listed by: TRUHOME REALTY $15,000Active0.55 Acres
968 Fawn Lane, Orangeburg, SC 29115
MLS# 25016736Listed by: TRUHOME REALTY $25,000Active1.1 Acres
808 Lakeside View Lane, Orangeburg, SC 29115
MLS# 25016737Listed by: TRUHOME REALTY $399,000Active4 beds 4 baths2,451 sq. ft.
2133 Griffith Drive, Orangeburg, SC 29118
MLS# 25011411Listed by: NEXT LEVEL REAL ESTATE $321,500Active4 beds 3 baths2,883 sq. ft.
1848 Broughton Street, Orangeburg, SC 29115
MLS# 25008314Listed by: THE MOORE GROUP - A DIVISION OF THE LITCHFIELD COMPANY $259,990Active3 beds 3 baths1,901 sq. ft.
1103 Ellis Avenue, Orangeburg, SC 29115
MLS# 25029018Listed by: CAROLINA ELITE REAL ESTATE $299,000Pending5 beds 4 baths2,532 sq. ft.
481 Rutledge Avenue, Orangeburg, SC 29115
MLS# 25005288Listed by: MIDDLETON AND ASSOCIATES, REALTORS, INC. $180,000Active4 beds 2 baths1,786 sq. ft.
2128 Old Edisto Drive, Orangeburg, SC 29115
MLS# 628067Listed by: CENTURY 21 VANGUARD $80,000Active2 beds 1 baths1,000 sq. ft.
108 3rd Street, Orangeburg, SC 29115
MLS# 628069Listed by: CENTURY 21 VANGUARD $319,500Active3 beds 2 baths1,560 sq. ft.
280 Old Orchard Way, Orangeburg, SC 29115
MLS# 25002528Listed by: THE MOORE GROUP - A DIVISION OF THE LITCHFIELD COMPANY $319,500Active3 beds 2 baths1,540 sq. ft.
140 Old Orchard Way, Orangeburg, SC 29115
MLS# 25002534Listed by: THE MOORE GROUP - A DIVISION OF THE LITCHFIELD COMPANY $190,000Pending3 beds 3 baths2,096 sq. ft.
2415 Riley Street, Orangeburg, SC 29118
MLS# 600183Listed by: ELITE PROPERTIES REALTY, LLC $220,000Active11.35 Acres
000 Belle Acres Drive, Orangeburg, SC 29118
MLS# 24022655Listed by: THE MOORE GROUP - A DIVISION OF THE LITCHFIELD COMPANY $400,000Active2 Acres
421 S Hwy 4 & Hwy 301, Orangeburg, SC 29115
MLS# 24030800Listed by: ATLANTIC EDGE REAL ESTATE $287,000Pending3 beds 2 baths1,868 sq. ft.
284 Young Town Circle Circle, Orangeburg, SC 29118
MLS# 24029970Listed by: MIDDLETON AND ASSOCIATES, REALTORS, INC. $249,895Pending3 beds 3 baths1,535 sq. ft.
272 Young Town Circle, Orangeburg, SC 29118
MLS# 24018853Listed by: MIDDLETON AND ASSOCIATES, REALTORS, INC. $39,900Pending2 beds 2 baths950 sq. ft.
2251 Hillcrest #6C, Orangeburg, SC 29118
MLS# 24022320Listed by: UNITED COUNTRY THE MCDANIEL CO $29,900Pending3 beds 1 baths1,000 sq. ft.
1230 Goff Avenue, Orangeburg, SC 29115
MLS# 24022451Listed by: MIDDLETON AND ASSOCIATES, REALTORS, INC. $30,000Pending0.43 Acres
1219 Eastbrook, Orangeburg, SC 29115
MLS# 24023124Listed by: ERA WILDER REALTY, INC $529,000Active6 beds 6 baths3,116 sq. ft.
1254 Sawyer, Orangeburg, SC 29115
MLS# 24023142Listed by: ERA WILDER REALTY, INC $349,000Active5 beds 5 baths3,387 sq. ft.
1775 Broughton Street Street, Orangeburg, SC 29115
MLS# 26000737Listed by: ERA WILDER REALTY, INC $299,000Pending4 beds 2 baths1,951 sq. ft.
1571 Green Valley Street, Orangeburg, SC 29115
MLS# 24022409Listed by: COLDWELL BANKER REALTY $124,500Active3 beds 2 baths1,110 sq. ft.
1859 Atlantic Avenue, Orangeburg, SC 29115
MLS# 24022466Listed by: THE MOORE GROUP - A DIVISION OF THE LITCHFIELD COMPANY $275,000Active3 beds 3 baths2,766 sq. ft.
2354 Griffith Drive, Orangeburg, SC 29118
MLS# 24022629Listed by: THE MOORE GROUP - A DIVISION OF THE LITCHFIELD COMPANY $23,000Active0.46 Acres
Columbia Road, Orangeburg, SC 29118
MLS# 24022676Listed by: RE/MAX REAL ESTATE CENTER $35,900Pending0.34 Acres
1235 Sawyer Street, Orangeburg, SC 29115
MLS# 24022746Listed by: MIDDLETON AND ASSOCIATES, REALTORS, INC. $69,000Pending3 beds 1 baths1,202 sq. ft.
1135 Gloria Street, Orangeburg, SC 29115
MLS# 24022419Listed by: ERA WILDER REALTY INC $475,000Active25 Acres
219 SW Cannon Bridge Road, Orangeburg, SC 29115
MLS# 24016252Listed by: SC VIEWS LLC
Local realty services provided by:CENTURY 21 803, CENTURY 21 Triangle Group, CENTURY 21 Northland, CENTURY 21 DiGioia Realty, CENTURY 21 North East
Last Updated: June 6, 2026 The data relating to real estate on this Web site derive in part from the Carolina Multiple Listing Services, Inc. IDX program. Brokers make an effort to deliver accurate information, but buyers should independently verify any information on which they will rely in a transaction. All properties are subject to prior sale, change or withdrawal. Neither CENTURY 21 803nor any listing broker shall be responsible for any typographical errors, misinformation, or misprints, and they shall be held totally harmless from any damages arising from reliance upon this data. This data is provided exclusively for consumers' personal, non-commercial use and may not be used for any purpose other than to identify prospective properties they may be interested in purchasing. Copyright 2026 Carolina Multiple Listing Services, Inc.
Copyright 2026 Charleston Trident MLS. Information is being provided is for consumers' personal, non-commercial use and may not be used for any purpose other than to identify prospective properties consumers may be interested in purchasing. Information deemed reliable but not guaranteed.
Listings courtesy of Canopy MLS as distributed by MLS GRID. Copyright 2021 Canopy MLS. All rights reserved. Canopy MLS, provides content displayed here (“provided content”) on an “as is” basis and makes no representations or warranties regarding the provided content, including, but not limited to those of non-infringement, timeliness, accuracy, or completeness. Individuals and companies using information presented are responsible for verification and validation of information they utilize and present to their customers and clients. Canopy MLS will not be liable for any damage or loss resulting from use of the provided content or the products available through Portals, IDX, VOW, and/or Syndication. Recipients of this information shall not resell, redistribute, reproduce, modify, or otherwise copy any portion thereof without the expressed written consent of Canopy MLS.
Neighborhoods near Orangeburg, SC
Zip codes near Orangeburg, SC
- 29003 homes for sale
- 29018 homes for sale
- 29030 homes for sale
- 29038 homes for sale
- 29039 homes for sale
- 29042 homes for sale
- 29047 homes for sale
- 29107 homes for sale
- 29112 homes for sale
- 29115 homes for sale
- 29118 homes for sale
- 29133 homes for sale
- 29135 homes for sale
- 29142 homes for sale
- 29146 homes for sale
- 29160 homes for sale
- 29163 homes for sale
- 29432 homes for sale
- 29471 homes for sale
- 29817 homes for sale
Popular searches near Orangeburg, SC
- Bamberg homes for sale
- Bowman homes for sale
- Branchville homes for sale
- Brookdale homes for sale
- Cameron homes for sale
- Cope homes for sale
- Cordova homes for sale
- Denmark homes for sale
- Edisto homes for sale
- Elloree homes for sale
- Neeses homes for sale
- North homes for sale
- Orangeburg West homes for sale
- Rowesville homes for sale
- St Matthews homes for sale
- Sandy Run-Staley Crossroads homes for sale
- Santee homes for sale
- Swansea homes for sale
- Swansea homes for sale
- Wilkinson Heights homes for sale
Protect your home and budget from life's surprises with an Assurant Home Warranty, backed by a partner that supports you through every step of homeownership. Explore Plans.
©2026 Century 21 Real Estate LLC. All rights reserved. CENTURY 21®, the CENTURY 21 Logo and C21® are service marks owned by Century 21 Real Estate LLC. Century 21 Real Estate LLC fully supports the principles of the Fair Housing Act and the Equal Opportunity Act. Each office is independently owned and operated. Listing information is deemed reliable but not guaranteed accurate.