- Bryant Park, Lake Worth Beach homes for sale
- College Park, Lake Worth Beach homes for sale
- Colonial Estates, West Palm Beach homes for sale
- Downtown Jewel, Lake Worth Beach homes for sale
- Eden Place, Lake Worth Beach homes for sale
- Genesis, Lake Worth Beach homes for sale
- Ibis Island, Palm Beach homes for sale
- Mango Groves, Lake Worth Beach homes for sale
- Parker Ridge, West Palm Beach homes for sale
- Parrot Cove, Lake Worth Beach homes for sale
- Pineapple Beach, Lake Worth Beach homes for sale
- ROLO, Lake Worth homes for sale
- Royal Poinciana, Lake Worth Beach homes for sale
- South Flagler Drive, West Palm Beach homes for sale
- Southside, West Palm Beach homes for sale
- Southwest, West Palm Beach homes for sale
- Southwinds, Lake Worth homes for sale
- Sunset Ridge, Lake Worth Beach homes for sale
- Tropical Ridge, Lake Worth Beach homes for sale
- Whispering Palms, Lake Worth Beach homes for sale
Palm Springs, FL - homes for sale
8 of 8 results displayed
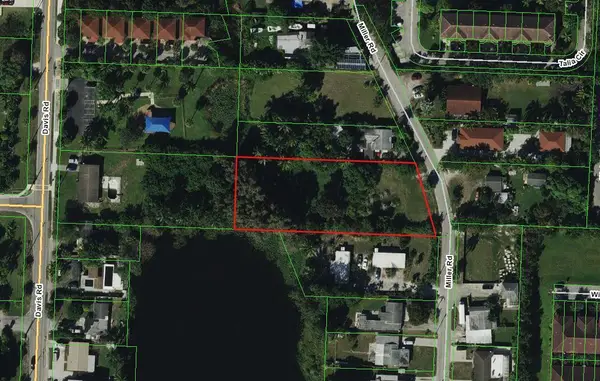 $775,000Active0.77 Acres
17 Miller Road, Palm Springs, FL 33461
MLS# B26028327Listed by: LAER REALTY PARTNERS BOWEN/WELLINGTON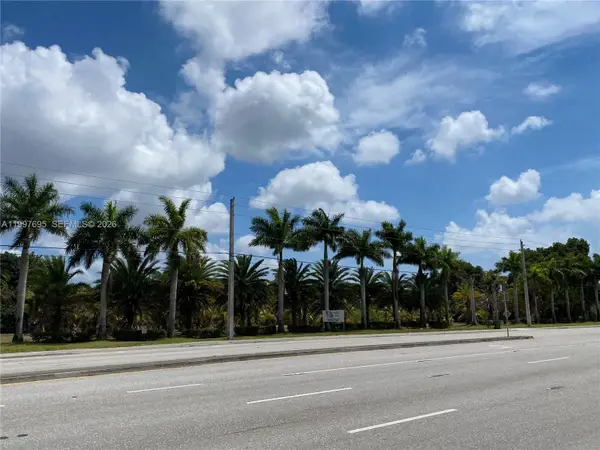 $8,000,000Active8.74 Acres
4411 Forest Hill Blvd, Palm Springs, FL 33406
MLS# A11997695Listed by: THE REAL ESTATE OFFICE CO. $6,250,000Active5.84 Acres
0 Dalinda Lane, Palm Springs, FL 33406
MLS# R11124370Listed by: TOUCHSTONE-WEBB REALTY CO. $750,000Active1.03 Acres
Address Withheld By Seller, Lake Worth, FL 33461
MLS# R11142095Listed by: OCEAN WALK EAST INC $2,300,000Active0.38 Acres
3801 N 10th Ave N, Palm Springs, FL 33461
MLS# A11938681Listed by: BEACHFRONT REALTY INC $23,400Active8.79 Acres
6000 Canal Drive, Lake Worth, FL 33463
MLS# A11798061Listed by: INTER RELATED CORP $12,000Active8.79 Acres
6000 Canal Drive, Lake Worth, FL 33463
MLS# A11797423Listed by: INTER RELATED CORP $85,000Active0.25 Acres
0 Ruta Luquesan Bernardino, San Bernardino, FL
MLS# A11782668Listed by: AVANTI WAY REALTY LLC
Local realty services provided by:CENTURY 21 Hansen Realty, CENTURY 21 Carioti
Information deemed reliable but not guaranteed. Information is provided, in part, by Greater Miami MLS. This information being provided is for consumer's personal, non-commercial use and may not be used for any other purpose other than to identify prospective properties consumers may be interested in purchasing. SEFMLS Member Broker: Albert Carioti
Neighborhoods near Palm Springs, FL
Zip codes near Palm Springs, FL
- 33401 homes for sale
- 33405 homes for sale
- 33406 homes for sale
- 33407 homes for sale
- 33409 homes for sale
- 33411 homes for sale
- 33413 homes for sale
- 33414 homes for sale
- 33415 homes for sale
- 33417 homes for sale
- 33426 homes for sale
- 33435 homes for sale
- 33436 homes for sale
- 33437 homes for sale
- 33460 homes for sale
- 33461 homes for sale
- 33462 homes for sale
- 33463 homes for sale
- 33467 homes for sale
- 33480 homes for sale
Popular searches near Palm Springs, FL
- Atlantis homes for sale
- Greenacres homes for sale
- Haverhill homes for sale
- Hypoluxo homes for sale
- Kenwood Estates homes for sale
- Lake Belvedere Estates homes for sale
- Lake Clarke Shores homes for sale
- Lake Worth homes for sale
- Lake Worth Beach homes for sale
- Lantana homes for sale
- Manalapan homes for sale
- Palm Beach homes for sale
- Pine Air homes for sale
- Plantation Mobile Home Park homes for sale
- Royal Palm Estates homes for sale
- San Castle homes for sale
- Schall Circle homes for sale
- Seminole Manor homes for sale
- South Palm Beach homes for sale
- Westgate homes for sale
Protect your home and budget from life's surprises with an Assurant Home Warranty, backed by a partner that supports you through every step of homeownership. Explore Plans.
©2026 Century 21 Real Estate LLC. All rights reserved. CENTURY 21®, the CENTURY 21 Logo and C21® are service marks owned by Century 21 Real Estate LLC. Century 21 Real Estate LLC fully supports the principles of the Fair Housing Act and the Equal Opportunity Act. Each office is independently owned and operated. Listing information is deemed reliable but not guaranteed accurate.