- Belle Haven, Menlo Park homes for sale
- Clearfield Park, San Carlos homes for sale
- Edgewood Park, Redwood City homes for sale
- El Sereno Corte, San Carlos homes for sale
- Fair Oaks, Menlo Park homes for sale
- Friendly Acres, Redwood City homes for sale
- Howard Park, San Carlos homes for sale
- Lindenwood, Atherton homes for sale
- Marlin, Redwood City homes for sale
- Palm Park, Redwood City homes for sale
- Redwood Oaks, Redwood City homes for sale
- Redwood Shores, Redwood City homes for sale
- Redwood Village, Redwood City homes for sale
- Roosevelt, Redwood City homes for sale
- San Carlos, San Carlos homes for sale
- Sea Colony, San Mateo homes for sale
- Stambaugh Heller, Redwood City homes for sale
- West Atherton, Atherton homes for sale
- White Oaks, San Carlos homes for sale
- Woodside Plaza, Redwood City homes for sale
Redwood City, CA - homes for sale
110 of 110 results displayed
- Open Sat, 2 to 4pmNew
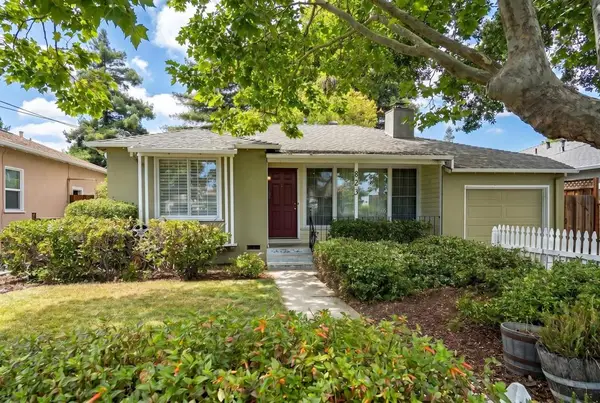 $1,198,000Active3 beds 2 baths1,470 sq. ft.
823 7th Avenue, Redwood City, CA 94063
MLS# ML82050189Listed by: REALSMART PROPERTIES - Open Sat, 1 to 3pmNew
 $3,195,000Active4 beds 4 baths2,680 sq. ft.
428 Santa Clara Avenue, Redwood City, CA 94061
MLS# ML82048958Listed by: COMPASS - Open Sun, 12 to 4pmNew
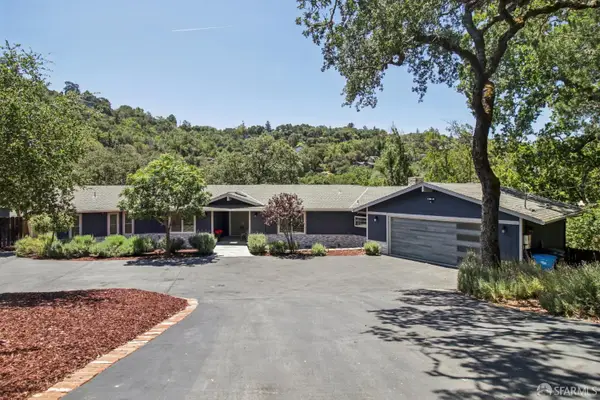 $4,688,000Active6 beds 6 baths5,099 sq. ft.
1955 Edgewood Road, Redwood City, CA 94062
MLS# 426114632Listed by: BERKSHIRE HATHAWAY HOME SERVICES DRYSDALE PROPERTIES - Open Sat, 2 to 4pmNew
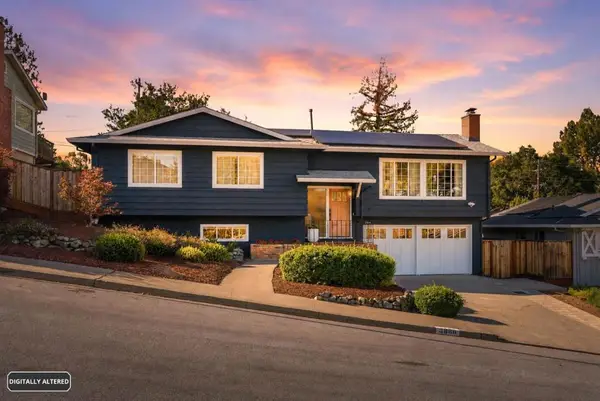 $2,698,000Active4 beds 3 baths2,035 sq. ft.
3860 Autumn Drive, Redwood City, CA 94061
MLS# ML82050070Listed by: COMPASS - New
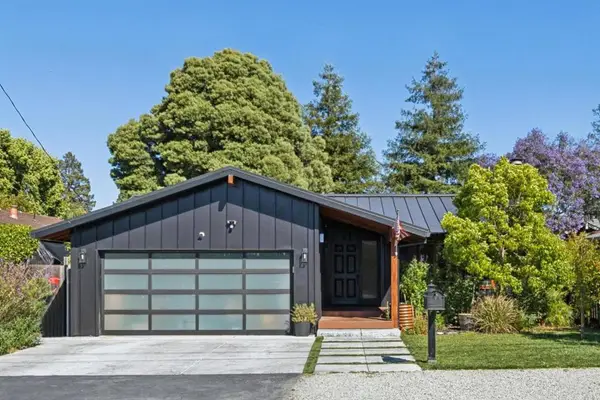 $1,495,000Active3 beds 2 baths1,310 sq. ft.
774 7th Avenue, Redwood City, CA 94063
MLS# ML82049838Listed by: COMPASS - New
 $2,088,000Active3 beds 2 baths1,495 sq. ft.
1276 Connecticut Drive, Redwood City, CA 94061
MLS# ML82049922Listed by: KW ADVISORS - New
 $1,248,000Active3 beds 2 baths990 sq. ft.
1145 Ebener Street, Redwood City, CA 94061
MLS# ML82049805Listed by: COLDWELL BANKER REALTY - New
 $1,795,000Active3 beds 2 baths1,300 sq. ft.
902 Glennan Dr, Redwood City, CA 94061
MLS# 41137142Listed by: DUDUM REAL ESTATE GROUP - New
 $1,799,000Active3 beds 3 baths1,537 sq. ft.
1123 17th Avenue, Redwood City, CA 94063
MLS# ML82049642Listed by: REPRESENT REALTY  $4,288,000Pending4 beds 5 baths4,324 sq. ft.
3687 Brandy Rock Way, Redwood City, CA 94061
MLS# ML82049600Listed by: COLDWELL BANKER REALTY- New
 $1,998,000Active3 beds 2 baths1,710 sq. ft.
1306 Edgewood Road, Redwood City, CA 94062
MLS# ML82049501Listed by: KW ADVISORS - New
 $989,000Active2 beds 1 baths1,160 sq. ft.
827 Chestnut Street, Redwood City, CA 94063
MLS# ML82049316Listed by: BAYVIEW REALTY & FINANCIAL - New
 $2,595,000Active3 beds 3 baths2,040 sq. ft.
1745 Virginia Avenue, Redwood City, CA 94061
MLS# ML82049292Listed by: INTERO REAL ESTATE SERVICES  $2,898,000Pending4 beds 4 baths2,895 sq. ft.
272 Grand Street, Redwood City, CA 94062
MLS# ML82049173Listed by: GILMARTIN GROUP $1,400,000Active3 beds 2 baths1,260 sq. ft.
3021 Glendale Avenue, Redwood City, CA 94063
MLS# ML82049154Listed by: WRIGLEY REAL ESTATE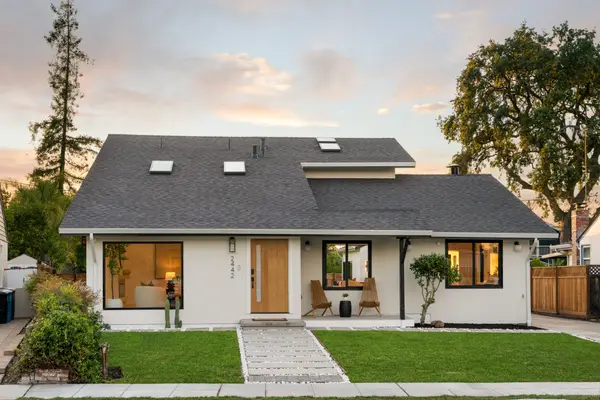 $3,988,000Active4 beds 4 baths3,000 sq. ft.
2442 Hampton Avenue, Redwood City, CA 94061
MLS# ML82049140Listed by: GOLDEN GATE SOTHEBY'S INTERNATIONAL REALTY $3,498,000Pending4 beds 3 baths3,246 sq. ft.
510 Hudson Street, Redwood City, CA 94062
MLS# ML82049127Listed by: WHEARLEY & CO. REAL ESTATE $2,249,000Pending4 beds 2 baths1,730 sq. ft.
1117 Chesterton Ave, Redwood City, CA 94061
MLS# 41135883Listed by: SC REALTY $1,599,000Pending4 beds 3 baths2,370 sq. ft.
567 Sapphire Street, Redwood City, CA 94062
MLS# ML82048913Listed by: KW ADVISORS $2,498,000Active5 beds 2 baths2,224 sq. ft.
949 Pleasant Hill Road, Redwood City, CA 94061
MLS# ML82048909Listed by: SEQUOIA REALTY SERVICES $2,995,000Pending3 beds 2 baths1,970 sq. ft.
80 Woodsworth Avenue, Redwood City, CA 94062
MLS# ML82048795Listed by: GOLDEN GATE SOTHEBY'S INTERNATIONAL REALTY $2,798,000Pending4 beds 4 baths3,450 sq. ft.
164 Springdale Way, Redwood City, CA 94062
MLS# ML82048714Listed by: EXP REALTY OF CALIFORNIA INC $1,850,000Active3 beds 2 baths1,510 sq. ft.
530 Avenue Del Ora, Redwood City, CA 94062
MLS# ML82048723Listed by: GOLDEN GATE SOTHEBY'S INTERNATIONAL REALTY $4,080,000Active5 beds 5 baths3,149 sq. ft.
519 Lakemead Way, Redwood City, CA 94062
MLS# ML82048673Listed by: COMPASS $1,399,950Active2 beds 1 baths980 sq. ft.
28 Alameda De Las Pulgas, Redwood City, CA 94062
MLS# ML82048004Listed by: INTERO REAL ESTATE SERVICES $2,988,000Active6 beds 4 baths2,747 sq. ft.
Sequoia Avenue, Redwood City, CA 94061
MLS# ML82046765Listed by: ASPIRE HOMES $1,749,999Pending3 beds 3 baths1,335 sq. ft.
209 Lexington Ave, Redwood City, CA 94062
MLS# 41136007Listed by: SOLUTION REAL ESTATE $2,399,000Active4 beds 3 baths2,090 sq. ft.
848 Chesterton Avenue, Redwood City, CA 94061
MLS# ML82047728Listed by: CHRISTIE'S INTERNATIONAL REAL ESTATE SERENO $898,000Pending2 beds 2 baths890 sq. ft.
30 Meadow Lane, Redwood City, CA 94063
MLS# ML82048501Listed by: SC PROPERTIES $1,895,000Active3 beds 2 baths2,130 sq. ft.
234 Madison Avenue, Redwood City, CA 94061
MLS# ML82048454Listed by: THE AGENCY $2,349,000Active7 beds 5 baths3,013 sq. ft.
69 Nueva Avenue, Redwood City, CA 94061
MLS# ML82048333Listed by: KW BAY AREA ESTATES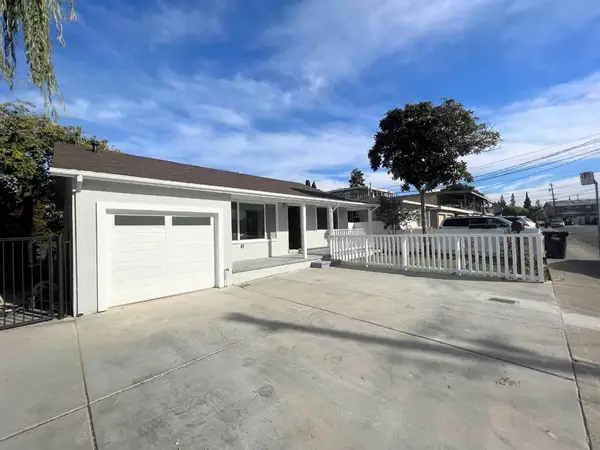 $1,150,000Active3 beds 2 baths1,030 sq. ft.
2921 Calvin Avenue, Redwood City, CA 94063
MLS# ML82048308Listed by: STROMBOM PROPERTIES, INC. $1,799,950Active3 beds 2 baths1,640 sq. ft.
1165 Clinton Street, Redwood City, CA 94061
MLS# ML82044345Listed by: KW BAY AREA ESTATES $1,825,000Active3 beds 3 baths1,584 sq. ft.
1587 Kentfield Avenue, Redwood City, CA 94061
MLS# ML82047819Listed by: INTERO REAL ESTATE SERVICES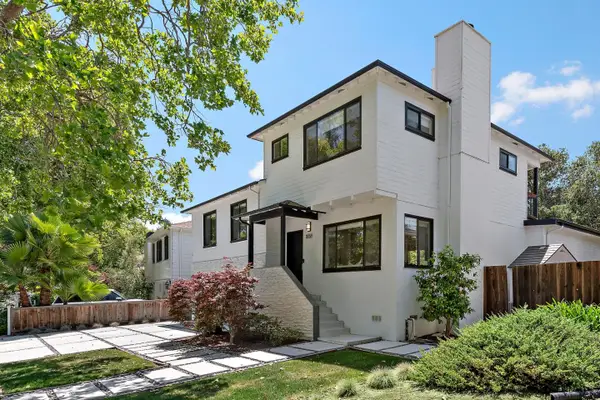 $2,788,000Pending4 beds 2 baths1,975 sq. ft.
1858 Alameda De Las Pulgas, Redwood City, CA 94061
MLS# ML82047682Listed by: PARC AGENCY CORPORATION $1,198,000Pending2 beds 1 baths1,100 sq. ft.
811 7th Avenue, Redwood City, CA 94063
MLS# ML82047684Listed by: INTERO REAL ESTATE SERVICES $3,750,000Active3 beds 3 baths2,600 sq. ft.
1745 Cordilleras Road, Redwood City, CA 94062
MLS# ML82047665Listed by: NETEQUITY REAL ESTATE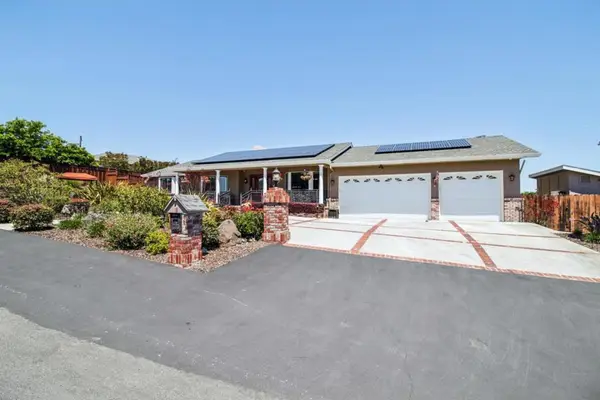 $3,999,950Pending5 beds 4 baths3,980 sq. ft.
733 Temescal Way, Redwood City, CA 94062
MLS# ML82043258Listed by: PARK LANE CAPITAL INC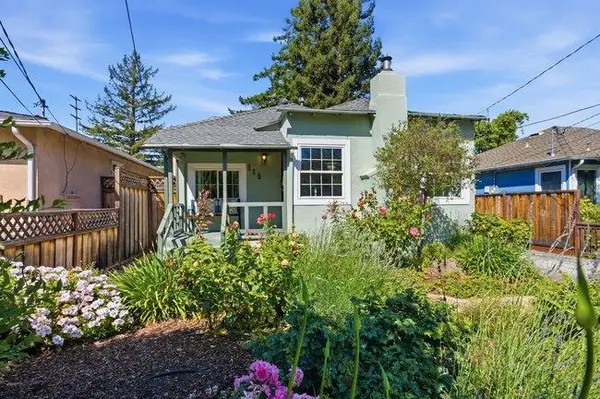 $1,248,000Pending2 beds 2 baths1,131 sq. ft.
115 Alexander Avenue, Redwood City, CA 94061
MLS# ML82047438Listed by: NUTERRA REAL ESTATE GROUP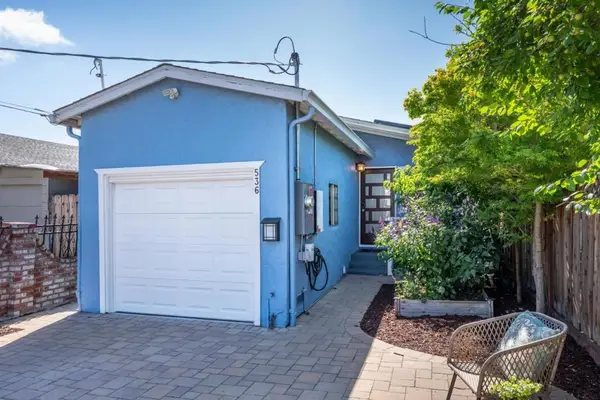 $948,000Active2 beds 1 baths760 sq. ft.
536 Stanford Avenue, Redwood City, CA 94063
MLS# ML82047412Listed by: VERITAS HOMES $2,198,000Pending3 beds 2 baths2,008 sq. ft.
1622 Maryland Street, Redwood City, CA 94061
MLS# ML82047325Listed by: COMPASS $2,198,000Pending4 beds 2 baths1,490 sq. ft.
3708 Brandy Rock Way, Redwood City, CA 94061
MLS# ML82047290Listed by: COMPASS $1,298,000Pending2 beds 1 baths930 sq. ft.
919 6th Avenue, Redwood City, CA 94063
MLS# ML82046674Listed by: REPRESENT REALTY $3,288,000Pending4 beds 3 baths2,810 sq. ft.
25 Carrera Court, Redwood City, CA 94062
MLS# ML82046643Listed by: DELEON REALTY- Open Sat, 11am to 1pm
 $3,399,000Active4 beds 4 baths3,055 sq. ft.
313 Lakeview Way, Redwood City, CA 94062
MLS# ML82046655Listed by: KW ADVISORS  $2,198,000Pending4 beds 2 baths1,440 sq. ft.
2020 Helena Way, Redwood City, CA 94061
MLS# ML82046114Listed by: SEAN PROCTOR REAL ESTATE $2,800,000Pending6 beds 3 baths2,520 sq. ft.
3950 Brookline Way, Redwood City, CA 94062
MLS# ML82045836Listed by: COLDWELL BANKER REALTY $3,998,000Active4 beds 4 baths3,118 sq. ft.
496 Summit Drive, Redwood City, CA 94062
MLS# ML82045632Listed by: CORCORAN ICON PROPERTIES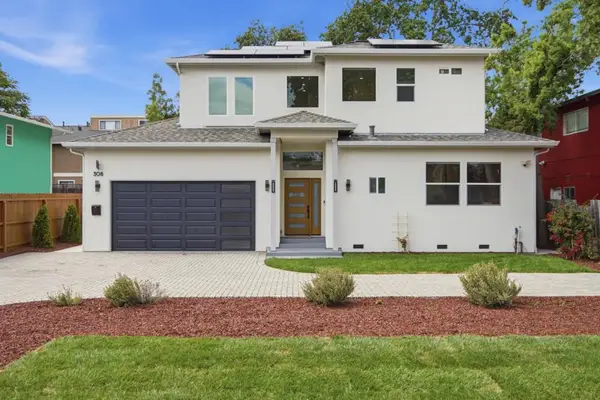 $2,898,000Pending4 beds 4 baths2,200 sq. ft.
308 Redwood Avenue, Redwood City, CA 94061
MLS# ML82046408Listed by: CHRISTIE'S INTERNATIONAL REAL ESTATE SERENO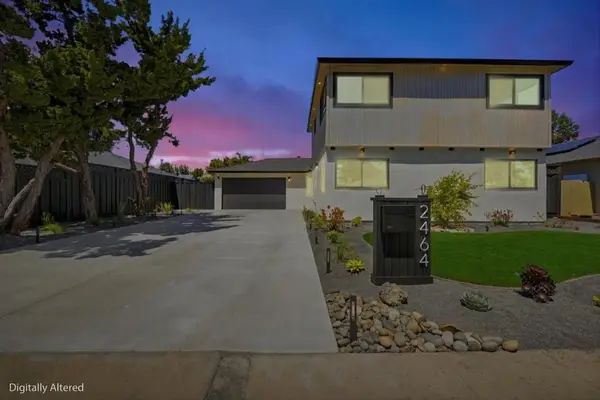 $2,098,000Pending4 beds 3 baths1,784 sq. ft.
2464 Carolina Avenue, Redwood City, CA 94061
MLS# ML82045817Listed by: COLDWELL BANKER REALTY $1,850,000Pending4 beds 2 baths1,780 sq. ft.
1561 Virginia Avenue, Redwood City, CA 94061
MLS# ML82046372Listed by: COMPASS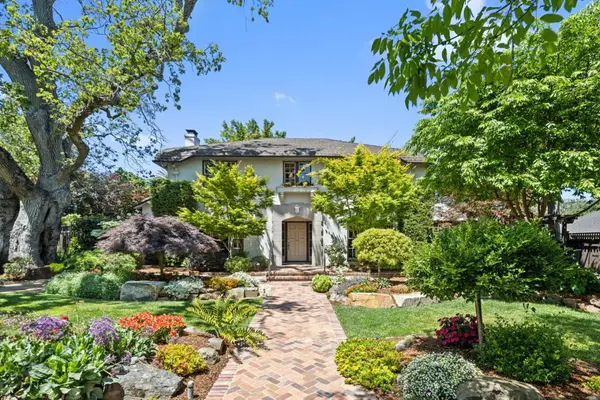 $4,999,950Pending4 beds 3 baths3,235 sq. ft.
828 Blandford Boulevard, Redwood City, CA 94062
MLS# ML82044862Listed by: BERKSHIRE HATHAWAY HOMESERVICES DRYSDALEPROPERTIES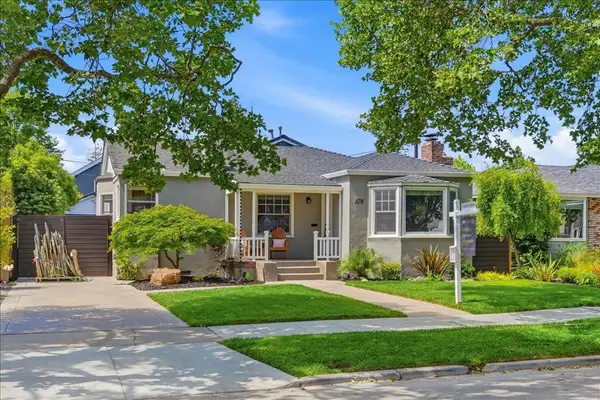 $2,650,000Pending3 beds 2 baths1,640 sq. ft.
278 Iris Street, Redwood City, CA 94062
MLS# ML82045120Listed by: EXP REALTY OF CALIFORNIA INC $2,198,000Pending3 beds 2 baths2,100 sq. ft.
157 Springdale Way, Redwood City, CA 94062
MLS# ML82046353Listed by: GOLDEN GATE SOTHEBY'S INTERNATIONAL REALTY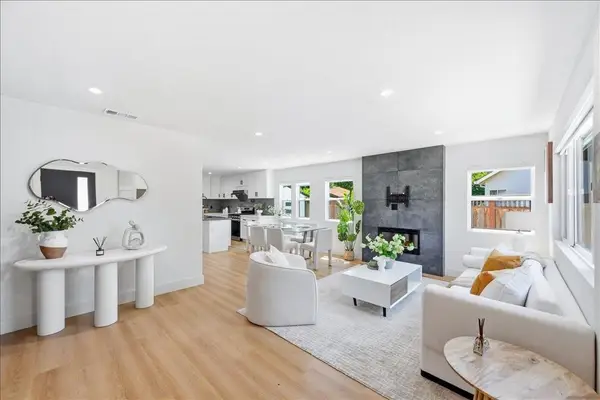 $1,758,000Active3 beds 2 baths1,250 sq. ft.
235 Mcevoy Street, Redwood City, CA 94061
MLS# ML82046306Listed by: ASPIRE HOMES $1,900,000Active3 beds 2 baths1,461 sq. ft.
1162 Oliver Street, Redwood City, CA 94061
MLS# ML82046273Listed by: COLDWELL BANKER REALTY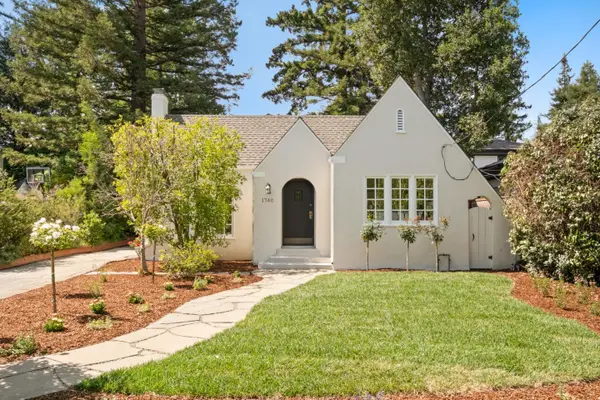 $1,795,000Pending3 beds 1 baths1,400 sq. ft.
1740 Whipple Avenue, Redwood City, CA 94062
MLS# ML82046170Listed by: COMPASS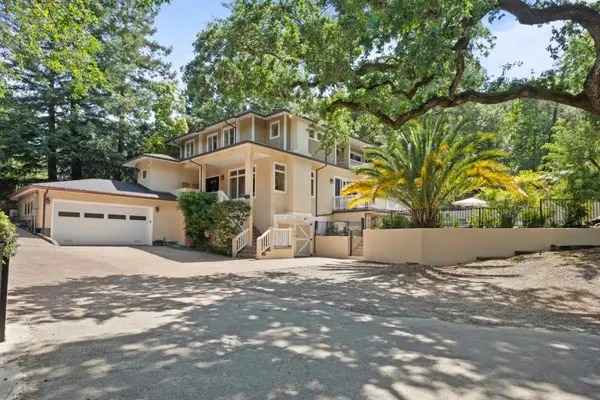 $3,988,800Active5 beds 4 baths2,600 sq. ft.
236 Ferndale Way, Redwood City, CA 94062
MLS# ML82045688Listed by: COMPASS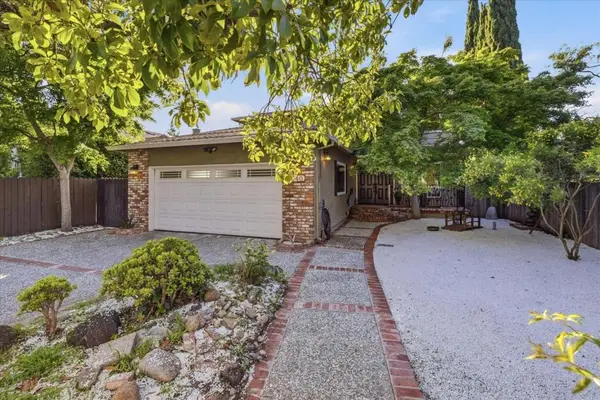 $1,999,999Active3 beds 3 baths2,040 sq. ft.
440 Carlos Avenue, Redwood City, CA 94061
MLS# ML82045463Listed by: CA 1 TEAM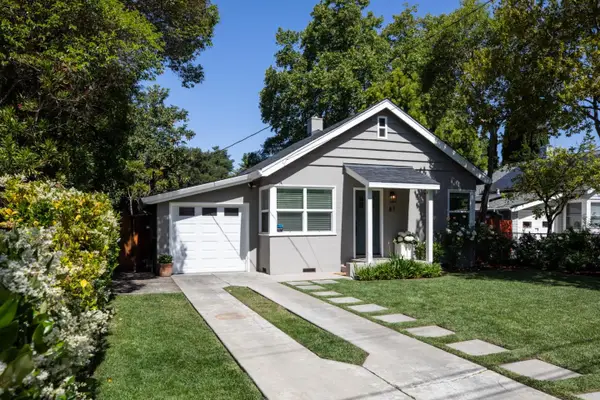 $1,498,000Pending2 beds 1 baths850 sq. ft.
87 Markham Avenue, Redwood City, CA 94063
MLS# ML82045410Listed by: INTERO REAL ESTATE SERVICES $3,595,000Active4 beds 4 baths2,852 sq. ft.
223 San Carlos Avenue, Redwood City, CA 94061
MLS# ML82045391Listed by: THOMAS JAMES REAL ESTATE SERVICES, INC, $2,699,000Active2 beds 3 baths1,150 sq. ft.
271 Sylvan Way, Redwood City, CA 94062
MLS# ML82045004Listed by: COMPASS $2,180,000Active3 beds 2 baths1,680 sq. ft.
2204 Roosevelt Avenue, Redwood City, CA 94061
MLS# ML82041133Listed by: EQ1 $2,388,000Pending3 beds 2 baths1,540 sq. ft.
556 Seahorse Lane, Redwood City, CA 94065
MLS# ML82045344Listed by: RE/MAX GOLD REDWOOD SHORES. $4,995,000Pending4 beds 5 baths3,537 sq. ft.
275 Hubbard Avenue, Redwood City, CA 94062
MLS# ML82045063Listed by: COMPASS $4,288,000Active4 beds 3 baths3,447 sq. ft.
853 Vista Drive, Redwood City, CA 94062
MLS# ML82045095Listed by: COMPASS $2,148,000Active3 beds 2 baths1,810 sq. ft.
546 Compass Circle, Redwood City, CA 94065
MLS# ML82044593Listed by: BERKSHIRE HATHAWAY HOMESERVICES DRYSDALEPROPERTIES $2,180,000Active4 beds 2 baths2,007 sq. ft.
2008 Kentucky Street, Redwood City, CA 94061
MLS# ML82044184Listed by: INTERO REAL ESTATE SERVICES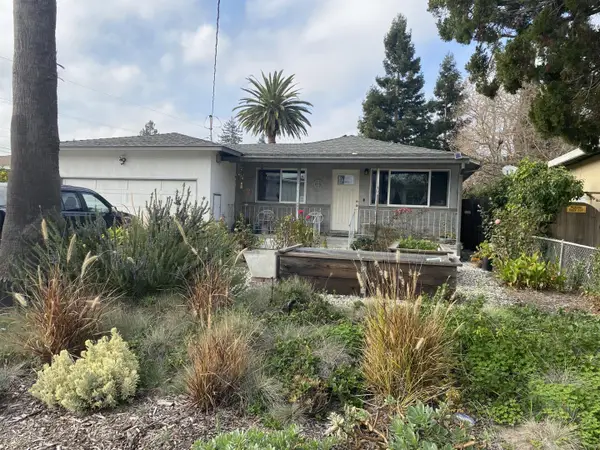 $1,310,000Pending3 beds 2 baths1,210 sq. ft.
2930 Jefferson Avenue, Redwood City, CA 94062
MLS# ML82042729Listed by: COMPASS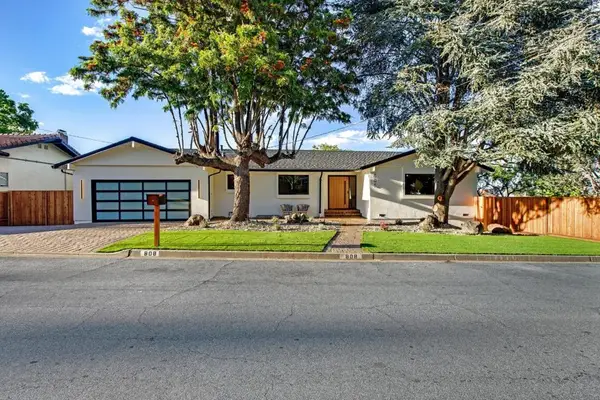 $3,500,000Active4 beds 5 baths3,130 sq. ft.
808 Mohican Way, Redwood City, CA 94062
MLS# ML82042476Listed by: OMARSHALL, INC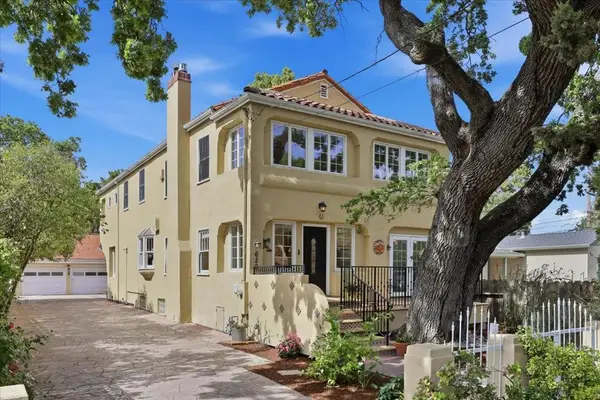 $2,398,000Pending4 beds 4 baths3,530 sq. ft.
620 Vera Avenue, Redwood City, CA 94061
MLS# ML82042005Listed by: MAXREAL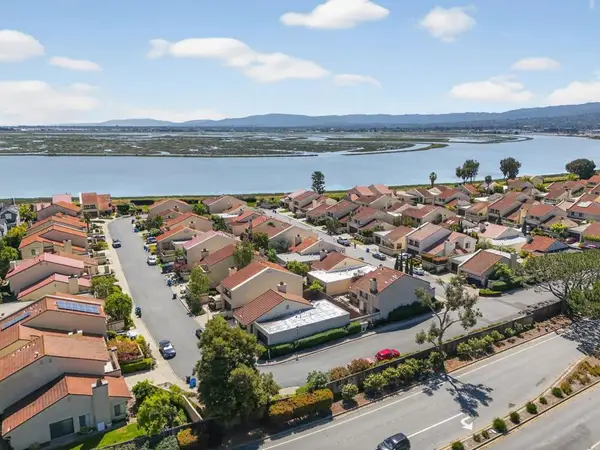 $1,848,000Active2 beds 2 baths1,320 sq. ft.
31 Barcelona Circle, Redwood City, CA 94065
MLS# ML82039966Listed by: LANDMARK REAL ESTATE SERVICES $1,335,000Active3 beds 2 baths1,705 sq. ft.
313 Dumbarton Avenue, Redwood City, CA 94063
MLS# 426118734Listed by: ALLISON JAMES ESTATES & HOMES $2,248,000Pending4 beds 3 baths1,830 sq. ft.
301 Saint Martin Drive, Redwood City, CA 94065
MLS# ML82041439Listed by: COMPASS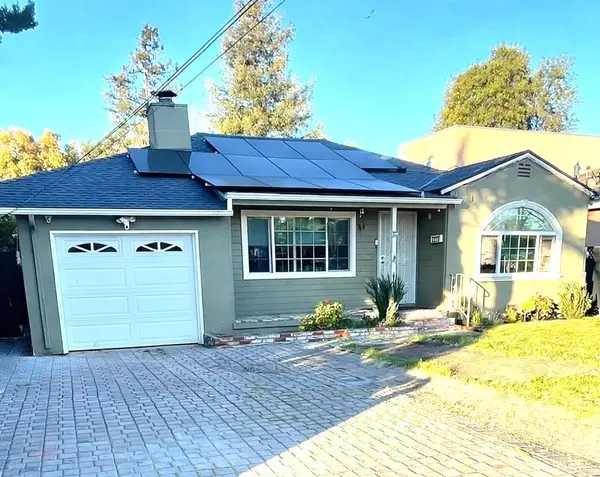 $1,348,000Active2 beds 2 baths1,090 sq. ft.
3223 Spring Street, Redwood City, CA 94063
MLS# ML82040911Listed by: LANDMARK REAL ESTATE SERVICES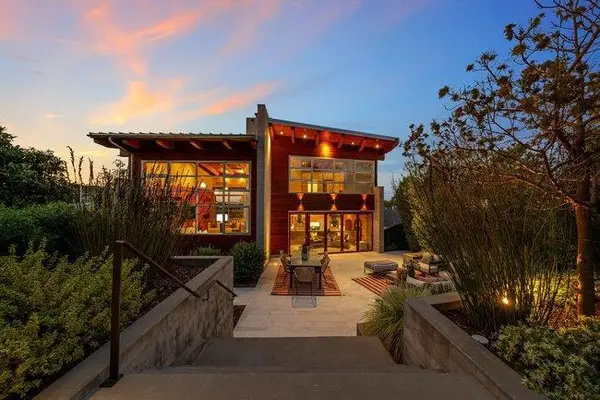 $4,190,000Active4 beds 3 baths2,726 sq. ft.
436 Lakeview Way, Redwood City, CA 94062
MLS# ML82040541Listed by: COMPASS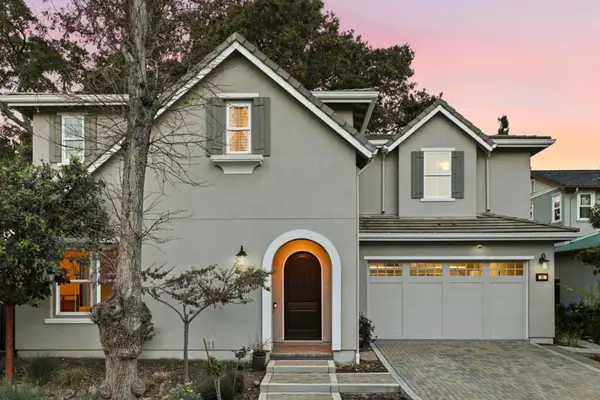 $4,250,000Active4 beds 5 baths3,541 sq. ft.
38 Liberty Hall Lane, Redwood City, CA 94062
MLS# ML82040358Listed by: GUIDE REAL ESTATE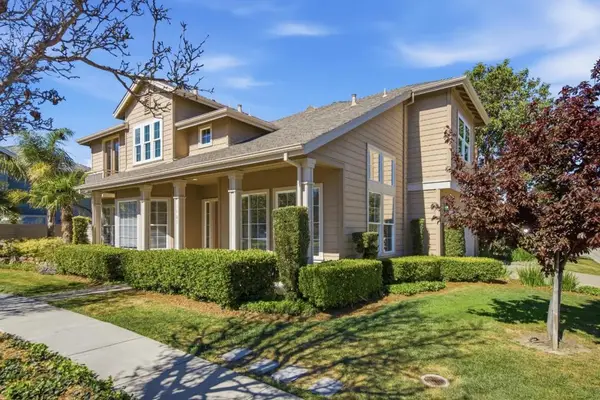 $2,554,000Active4 beds 3 baths2,590 sq. ft.
703 Lacewing Lane, Redwood City, CA 94065
MLS# ML82040245Listed by: COMPASS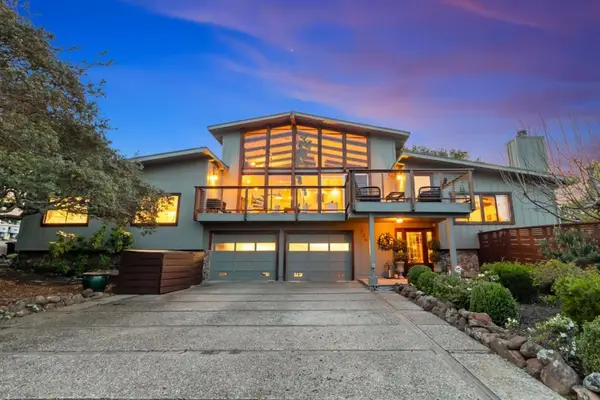 $4,190,000Active5 beds 3 baths3,650 sq. ft.
720 Temescal Way, Redwood City, CA 94062
MLS# ML82039821Listed by: COMPASS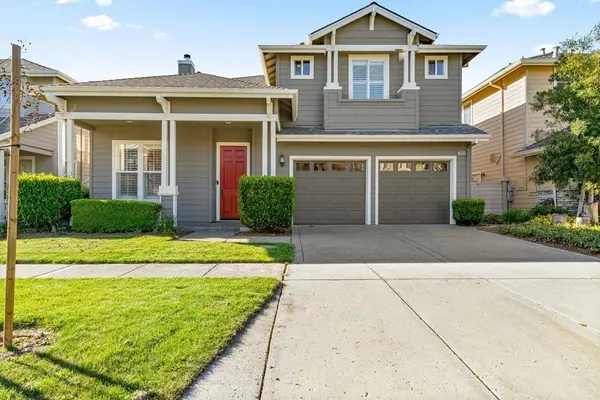 $2,798,000Pending5 beds 3 baths2,965 sq. ft.
2004 Gossamer Avenue, Redwood City, CA 94065
MLS# ML82039583Listed by: DPL REAL ESTATE $2,599,000Pending3 beds 3 baths1,760 sq. ft.
332 Mindanao Drive, Redwood City, CA 94065
MLS# 426112903Listed by: REAL BROKERAGE TECHNOLOGIES $5,349,000Pending5 beds 4 baths4,855 sq. ft.
1365 Edgewood Road, Redwood City, CA 94062
MLS# ML82038764Listed by: COMPASS $2,995,000Pending4 beds 5 baths2,950 sq. ft.
36 Gretel Court, Redwood City, CA 94061
MLS# ML82036397Listed by: COMPASS $1,950,000Pending2 beds 2 baths980 sq. ft.
175 Springdale Way, Redwood City, CA 94062
MLS# ML82035729Listed by: STROMBOM PROPERTIES, INC. $1,898,000Pending3 beds 3 baths1,956 sq. ft.
3455 Dover Road, Redwood City, CA 94061
MLS# ML82035121Listed by: GARRISON PROPERTIES $1,288,000Active3 beds 2 baths1,220 sq. ft.
3 Vera Court, Redwood City, CA 94061
MLS# ML82033208Listed by: GREEN BANKER REALTY $3,880,000Active4 beds 5 baths2,861 sq. ft.
1235 Edgewood Road, Redwood City, CA 94062
MLS# ML82033110Listed by: U16818 FINANCIAL SERVICES $2,198,000Pending4 beds 2 baths1,730 sq. ft.
1716 Rosemary Lane, Redwood City, CA 94061
MLS# ML82032546Listed by: KELLER WILLIAMS THRIVE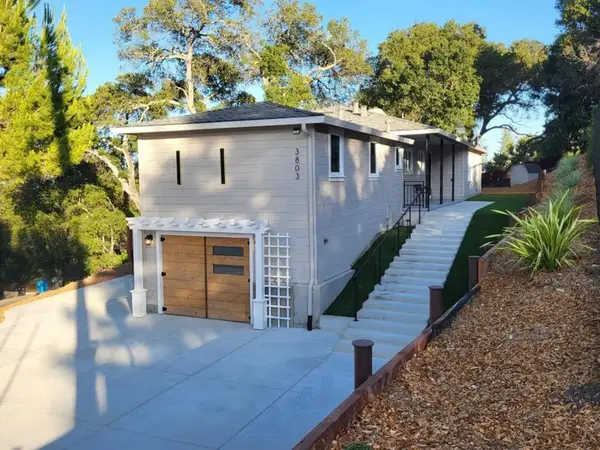 $3,498,000Active4 beds 2 baths2,000 sq. ft.
3803 Hamilton Way, Redwood City, CA 94062
MLS# ML82032490Listed by: INTERO REAL ESTATE SERVICES $1,699,000Active3 beds 2 baths1,440 sq. ft.
754 Topaz Street, Redwood City, CA 94061
MLS# ML82028771Listed by: THE AGENCY $5,549,000Pending6 beds 7 baths6,751 sq. ft.
1353 Edgewood Road, Redwood City, CA 94062
MLS# ML82031364Listed by: GOLDEN GATE SOTHEBY'S INTERNATIONAL REALTY $1,776,250Active3 beds 3 baths1,950 sq. ft.
608 Marlin Court, Redwood City, CA 94065
MLS# 425091114Listed by: REAL PROPERTY SOLUTIONS $1,598,000Pending4 beds 2 baths1,820 sq. ft.
976 2nd Avenue, Redwood City, CA 94063
MLS# ML82033143Listed by: GOLDEN GATE SOTHEBY'S INTERNATIONAL REALTY $2,499,000Pending4 beds 3 baths2,060 sq. ft.
3113 Granger Way, Redwood City, CA 94061
MLS# ML82027780Listed by: COMPASS $2,963,000Active4 beds 2 baths1,810 sq. ft.
577 Anchor Circle, Redwood City, CA 94065
MLS# ML81986720Listed by: DOUGLAS & MOORE REAL ESTATE, INC. $2,998,000Pending6 beds 6 baths4,885 sq. ft.
1 Doris Court, Redwood City, CA 94061
MLS# ML82023766Listed by: COMPASS $6,500,000Pending5 beds 5 baths5,905 sq. ft.
3964 Jefferson Avenue, Redwood City, CA 94062
MLS# ML82011812Listed by: COLDWELL BANKER REALTY $4,599,000Active6 beds 5 baths4,141 sq. ft.
303 Lakeview Way, Redwood City, CA 94062
MLS# ML81988628Listed by: COMPASS- Open Sat, 2 to 4pm
 $2,100,000Active3 beds 2 baths1,569 sq. ft.
536 Summit Drive, Redwood City, CA 94062
MLS# ML82048848Listed by: GOLDEN GATE SOTHEBY'S INTERNATIONAL REALTY  $1,100,000Active2 beds 1 baths1,000 sq. ft.
3279 Hoover Street, Redwood City, CA 94063
MLS# ML81968817Listed by: GREEN BANKER REALTY $1,998,000Pending5 beds 3 baths2,471 sq. ft.
751 Myrtle Street, Redwood City, CA 94061
MLS# ML81952561Listed by: COMPASS $1,299,000Pending4 beds 3 baths2,170 sq. ft.
Address Withheld By Seller, Redwood City, CA 94061
MLS# ML81496672Listed by: COLDWELL BANKER RES. R.E. SVCS $1,949,000Pending4 beds 4 baths3,000 sq. ft.
Address Withheld By Seller, Redwood City, CA 94062
MLS# ML81448504Listed by: SEQUOIA REAL ESTATE $975,000Pending4 beds 2 baths2,650 sq. ft.
Address Withheld By Seller, Redwood City, CA 94061
MLS# ML81423432Listed by: EXP REALTY $818,000Pending3 beds 1 baths1,100 sq. ft.
Address Withheld By Seller, Redwood City, CA 94061
MLS# ML81450411Listed by: REDFIN $1,998,000Pending6 beds 3 baths2,680 sq. ft.
Address Withheld By Seller, Redwood City, CA 94061
MLS# ML81897037Listed by: COMPASS $1,359,000Pending4 beds 3 baths1,562 sq. ft.
Harrison Avenue, Redwood City, CA 94062
MLS# ML81909038Listed by: COLDWELL BANKER REALTY $2,298,000Active7 beds 5 baths3,186 sq. ft.
300 Encina Avenue, Redwood City, CA 94061
MLS# ML81873840Listed by: COMPASS $2,495,000Active7 beds 3 baths2,610 sq. ft.
2083 Washington Avenue, Redwood City, CA 94061
MLS# ML81908389Listed by: RE/MAX GOLD $3,700,000Pending9 beds 7 baths5,084 sq. ft.
W Hudson Street, Redwood City, CA 94061
MLS# ML81900971Listed by: COLDWELL BANKER REALTY
Local realty services provided by:CENTURY 21 Synergia Realty, CENTURY 21 Baldini Real Estate, Inc., CENTURY 21 Sierra Properties, CENTURY 21 Masters
The information being provided by California Regional MLS (Southern California) is for the consumer's personal, non-commercial use and may not be used for any purpose other than to identify prospective properties consumer may be interested in purchasing. Any information relating to real estate for sale referenced on this web site comes from the Internet Data Exchange (IDX) program of the California Regional MLS (Southern California). CENTURY 21 Synergia Realty is not a Multiple Listing Service (MLS), nor does it offer MLS access. This website is a service of CENTURY 21 Synergia Realty, a broker participant of California Regional MLS (Southern California). This web site may reference real estate listing(s) held by a brokerage firm other than the broker and/or agent who owns this web site.
The accuracy of all information, regardless of source, including but not limited to open house information, square footages and lot sizes, is deemed reliable but not guaranteed and should be personally verified through personal inspection by and/or with the appropriate professionals. The data contained herein is copyrighted by California Regional MLS (Southern California) and is protected by all applicable copyright laws. Any unauthorized dissemination of this information is in violation of copyright laws and is strictly prohibited.
Copyright 2021 California Regional MLS (Southern California). All rights reserved. CRMLS Member Broker: Sandy Hernandez
The information being provided by San Francisco Association of REALTORS is for the consumer's personal, non-commercial use and may not be used for any purpose other than to identify prospective properties consumer may be interested in purchasing. Any information relating to real estate for sale referenced on this web site comes from the Internet Data Exchange (IDX) program of the San Francisco Association of REALTORS. This web site may reference real estate listing(s) held by a brokerage firm other than the broker and/or agent who owns this web site. The accuracy of all information, regardless of source, including but not limited to open house information, square footages and lot sizes, is deemed reliable but not guaranteed and should be personally verified through personal inspection by and/or with the appropriate professionals. The data contained herein is copyrighted by San Francisco Association of REALTORS and is protected by all applicable copyright laws. Any unauthorized dissemination of this information is in violation of copyright laws and is strictly prohibited.
MetroList MLS 2026. This information is being provided by MetroList MLS. All measurements and calculations of area are approximate. Information provided by Seller/Other sources, not verified by Broker. All interested persons should independently verify accuracy of information. Provided properties may or may not be listed by the office/agent presenting the information. Data Updated: June 9, 2026. Information being provided is for consumers' personal, non-commercial use and may not be used for any purpose other than to identify prospective properties consumers may be interested in purchasing. Information deemed reliable but not guaranteed. Any offer of compensation is made only to Participants of MLS where the subject listing is filed and in accordance with such MLS's regulations or rules. MFMLS Member Broker: Romeo Aurelio
Neighborhoods near Redwood City, CA
Zip codes near Redwood City, CA
- 94002 homes for sale
- 94025 homes for sale
- 94027 homes for sale
- 94028 homes for sale
- 94043 homes for sale
- 94061 homes for sale
- 94062 homes for sale
- 94063 homes for sale
- 94065 homes for sale
- 94070 homes for sale
- 94301 homes for sale
- 94303 homes for sale
- 94305 homes for sale
- 94306 homes for sale
- 94401 homes for sale
- 94402 homes for sale
- 94403 homes for sale
- 94404 homes for sale
- 94545 homes for sale
- 94555 homes for sale
Popular searches near Redwood City, CA
- Atherton homes for sale
- Baywood Park homes for sale
- Belmont homes for sale
- East Palo Alto homes for sale
- Emerald Lake Hills homes for sale
- Foster City homes for sale
- Hayward homes for sale
- Highlands homes for sale
- Hillsborough homes for sale
- Menlo Park homes for sale
- Mountain View homes for sale
- Newark homes for sale
- North Fair Oaks homes for sale
- Palo Alto homes for sale
- Portola Valley homes for sale
- San Carlos homes for sale
- San Mateo homes for sale
- Stanford homes for sale
- West Menlo Park homes for sale
- Woodside homes for sale
Protect your home and budget from life's surprises with an Assurant Home Warranty, backed by a partner that supports you through every step of homeownership. Explore Plans.
©2026 Century 21 Real Estate LLC. All rights reserved. CENTURY 21®, the CENTURY 21 Logo and C21® are service marks owned by Century 21 Real Estate LLC. Century 21 Real Estate LLC fully supports the principles of the Fair Housing Act and the Equal Opportunity Act. Each office is independently owned and operated. Listing information is deemed reliable but not guaranteed accurate.