- Alessandro Heights, Riverside homes for sale
- Arlanza, Riverside homes for sale
- Arlington, Riverside homes for sale
- Arlington Heights, Riverside homes for sale
- Arlington South, Riverside homes for sale
- Canyon Crest, Riverside homes for sale
- Casa Blanca, Riverside homes for sale
- Downtown Riverside, Riverside homes for sale
- Eastside, Riverside homes for sale
- Grand, Riverside homes for sale
- Hawarden Hills, Riverside homes for sale
- La Sierra Acres, Riverside homes for sale
- Magnolia Center, Riverside homes for sale
- Pedley, Jurupa Valley homes for sale
- Presidential Park, Riverside homes for sale
- Ramona - Riverside, Riverside homes for sale
- Rubidoux, Jurupa Valley homes for sale
- Victoria, Riverside homes for sale
- Victoria Groves, Riverside homes for sale
- Wood Streets, Riverside homes for sale
Riverside, CA - homes for sale
30 of 30 results displayed
- New
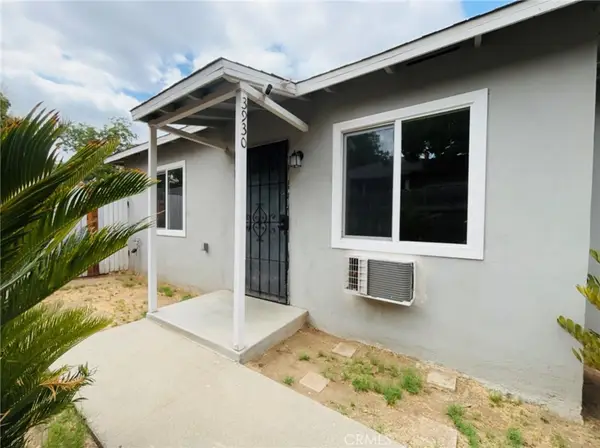 $854,000Active-- beds -- baths1,324 sq. ft.
3928 Everest, Riverside, CA 92503
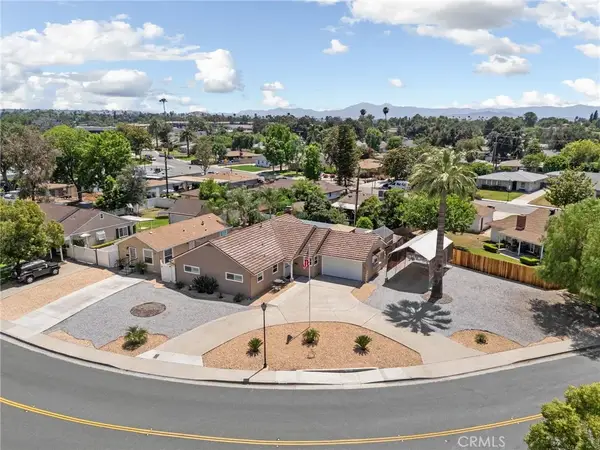
MLS# IV26117396Listed by: BEECHWOOD REALTY  $1,390,000Pending-- beds -- baths2,793 sq. ft.
6869 Marguerita, Riverside, CA 92506
MLS# IV26116704Listed by: INLAND CITIES REALTY- New

 $655,000Active-- beds -- baths1,812 sq. ft.
8231 Carnation Court, Riverside, CA 92503
MLS# MB26115439Listed by: CENTURY 21 REALTY MASTERS  $1,100,000Active-- beds 4 baths3,105 sq. ft.
3564 Elmwood, Riverside, CA 92506
MLS# IV26113728Listed by: COLDWELL BANKER REALTY $899,000Active5 beds 3 baths
2077 Patterson Street, Riverside, CA 92507
MLS# GD26109247Listed by: KELLER WILLIAMS R. E. SERVICES- New
 $940,000Active5 beds -- baths
3540 Nelson, Riverside, CA 92506
MLS# IV26120423Listed by: NATIONAL REALTY GROUP - New
 $940,000Active-- beds 4 baths2,384 sq. ft.
3540 Nelson, Riverside, CA 92506
MLS# IV26120423Listed by: NATIONAL REALTY GROUP 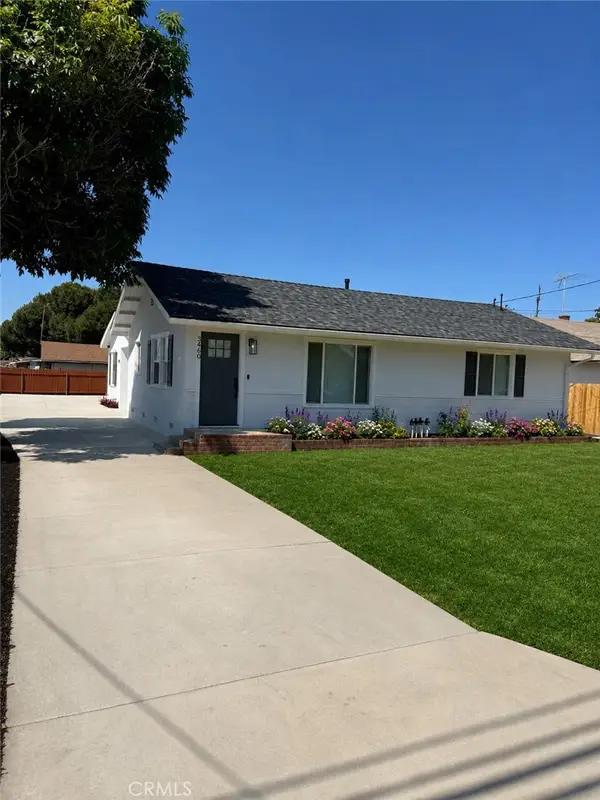 $1,350,000Pending-- beds -- baths2,660 sq. ft.
3460 Washington, Riverside, CA 92504
MLS# IV26101972Listed by: INLAND CITIES REALTY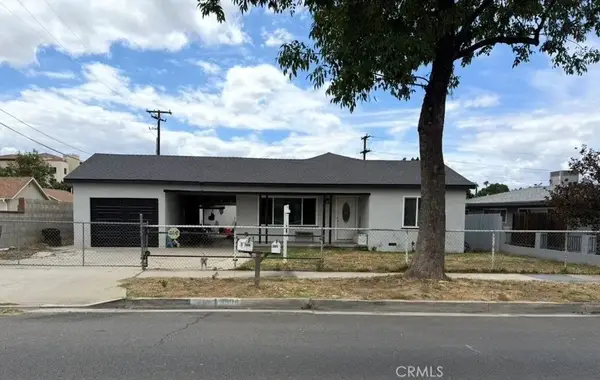 $839,000Active4 beds 2 baths
3904 Monroe, Riverside, CA 92504
MLS# OC26098249Listed by: DOMUS REALTY GROUP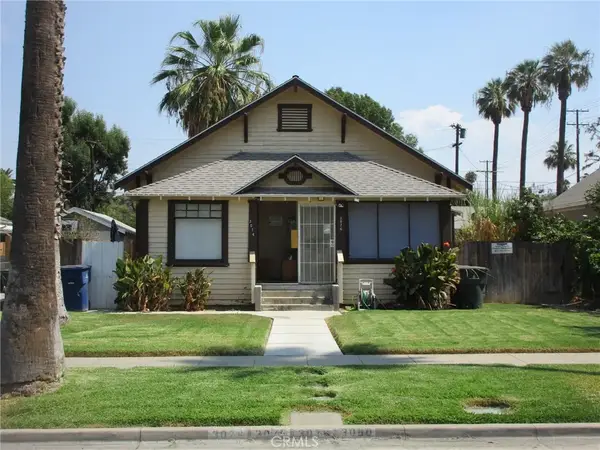 $925,000Active3 beds 4 baths
3076 Lemon, Riverside, CA 92501
MLS# IV26095718Listed by: RICH MERLIN REALTY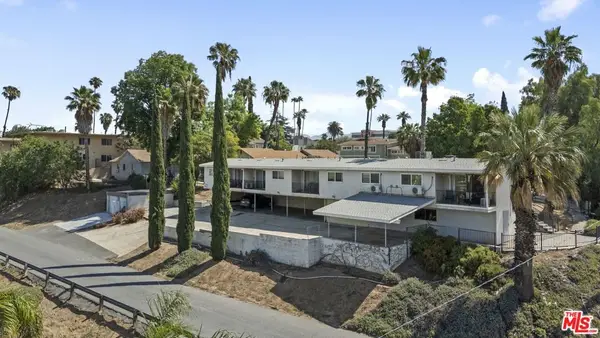 $3,595,000Active-- beds -- baths9,200 sq. ft.
4561 Main Street, Riverside, CA 92501
MLS# 26829247Listed by: MARCUS & MILLICHAP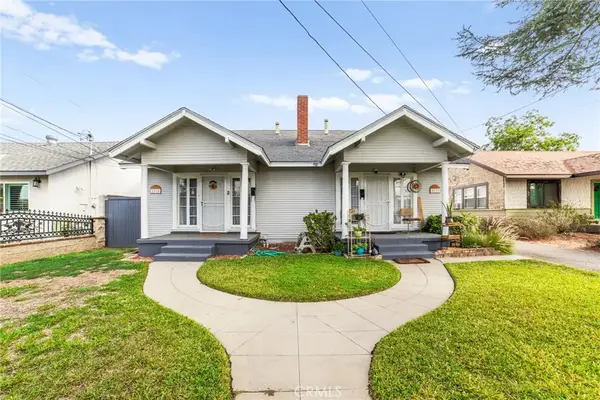 $1,100,000Active8 beds 4 baths
3717 Roosevelt, Riverside, CA 92503
MLS# IV26090701Listed by: LE INVESTMENT GROUP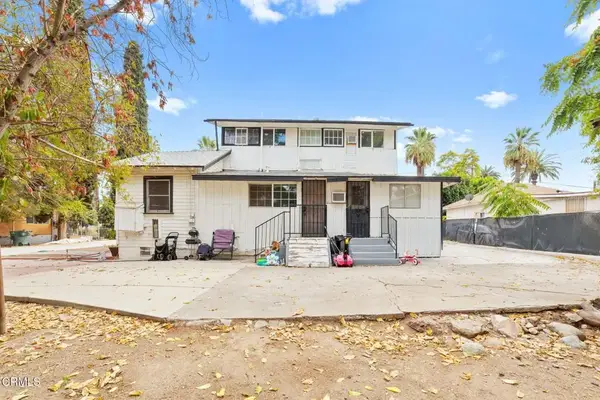 $948,000Active7 beds 4 baths
3633 Kansas Avenue, Riverside, CA 92507
MLS# P1-26538Listed by: DOUGLAS ELLIMAN OF CA INC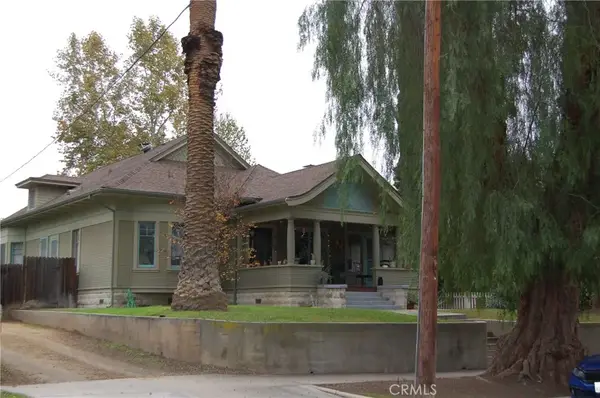 $799,000Active4 beds 3 baths
4160 Chestnut Street, Riverside, CA 92501
MLS# IV26059277Listed by: COAST AND COUNTRY REAL ESTATE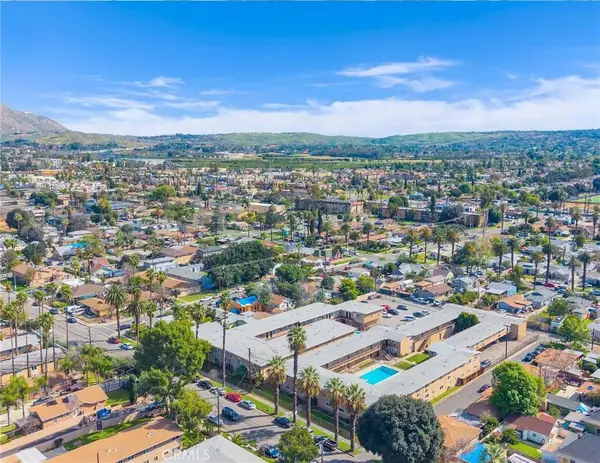 $14,000,000Active3 beds 3 baths
2032 W Linden, Riverside, CA 92507
MLS# CV26053930Listed by: CB RICHARD ELLIS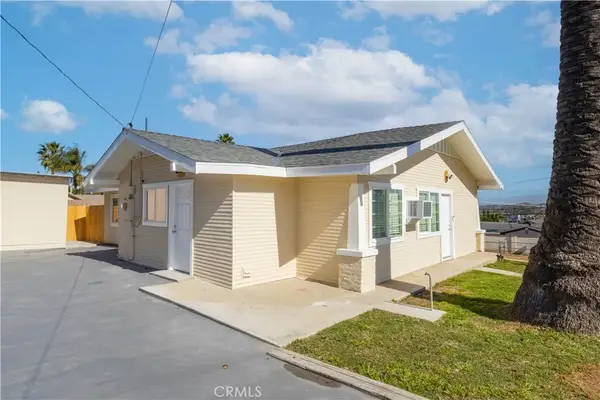 $695,000Active4 beds 3 baths
11711 Carmine Street, Riverside, CA 92505
MLS# PW26022770Listed by: FIRST OPTION REALTY $589,900Pending-- beds -- baths1,378 sq. ft.
4485 Dwight Avenue, Riverside, CA 92507
MLS# IV26021093Listed by: CHRIS ARMEN $1,615,000Active4 beds 4 baths
421 Devener, Riverside, CA 92507
MLS# CV26019708Listed by: MARCUS & MILLICHAP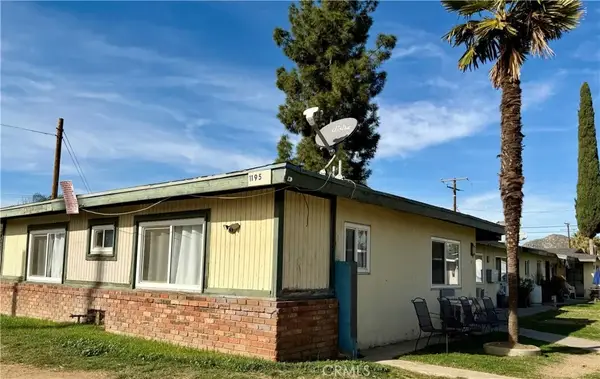 $885,000Active5 beds 4 baths
1195 W Spring Street, Riverside, CA 92507
MLS# CV26019641Listed by: MARCUS & MILLICHAP $529,900Pending4 beds 2 baths
4110 Dwight, Riverside, CA 92507
MLS# PW26006846Listed by: REDTREE REALTY INC $5,595,000Active6 beds 3 baths
1480 7th Street, Riverside, CA 92507
MLS# OC26008212Listed by: KIDDER MATHEWS OF CALIFORNIA, INC $16,995,000Active3 beds 4 baths
3681 Cranford Avenue, Riverside, CA 92507
MLS# OC26004201Listed by: KIDDER MATHEWS OF CALIFORNIA, INC $699,000Active4 beds 2 baths
9330-9332 Saffron Court, Riverside, CA 92503
MLS# ND25282263Listed by: REALTY ONE GROUP PACIFIC $1,075,000Active5 beds 5 baths2,056 sq. ft.
3469 Lime Street, Riverside, CA 92501
MLS# 25621531Listed by: MARCUS & MILLICHAP $1,199,000Active6 beds 4 baths
9460 Garfield, Riverside, CA 92503
MLS# PW25253376Listed by: BOGDANA DEES, BROKER $724,995Active4 beds 3 baths
4308 Lime Street, Riverside, CA 92501
MLS# TR25101045Listed by: RE/MAX TOP PRODUCERS $2,300,000Active9 beds 7 baths
17305 Sage Avenue, Riverside, CA 92504
MLS# IV25046329Listed by: HERITAGE HOME REALTY $675,000Pending3 beds 1 baths
17386 Sage Avenue, Riverside, CA 92504
MLS# IV25019831Listed by: GS STRATEGIES, INC. $975,000Pending10 beds 6 baths
3856 Pontiac Avenue, Riverside, CA 92509
MLS# PW24094387Listed by: THE FOSTER COMPANY $700,000Pending6 beds -- baths2,476 sq. ft.
3515 Albany Street, Riverside, CA 92503
MLS# CRPW23211770Listed by: FIRST TEAM REAL ESTATE
Local realty services provided by:CENTURY 21 Epic, CENTURY 21 Masters, CENTURY 21 Wildwood Properties, Inc.
The information being provided by California Regional MLS (Southern California) is for the consumer's personal, non-commercial use and may not be used for any purpose other than to identify prospective properties consumer may be interested in purchasing. Any information relating to real estate for sale referenced on this web site comes from the Internet Data Exchange (IDX) program of the California Regional MLS (Southern California). CENTURY 21 Epic is not a Multiple Listing Service (MLS), nor does it offer MLS access. This website is a service of CENTURY 21 Epic, a broker participant of California Regional MLS (Southern California). This web site may reference real estate listing(s) held by a brokerage firm other than the broker and/or agent who owns this web site.
The accuracy of all information, regardless of source, including but not limited to open house information, square footages and lot sizes, is deemed reliable but not guaranteed and should be personally verified through personal inspection by and/or with the appropriate professionals. The data contained herein is copyrighted by California Regional MLS (Southern California) and is protected by all applicable copyright laws. Any unauthorized dissemination of this information is in violation of copyright laws and is strictly prohibited.
Copyright 2021 California Regional MLS (Southern California). All rights reserved. CRMLS Member Broker: Mike Southwick
This information is deemed reliable but not guaranteed. You should rely on this information only to decide whether or not to further investigate a particular property. BEFORE MAKING ANY OTHER DECISION, YOU SHOULD PERSONALLY INVESTIGATE THE FACTS (e.g. square footage and lot size) with the assistance of an appropriate professional. You may use this information only to identify properties you may be interested in investigating further. All uses except for personal, non-commercial use in accordance with the foregoing purpose are prohibited. Redistribution or copying of this information, any photographs or video tours is strictly prohibited. This information is derived from the Internet Data Exchange (IDX) service provided by San Diego MLS®. Displayed property listings may be held by a brokerage firm other than the broker and/or agent responsible for this display. The information and any photographs and video tours and the compilation from which they are derived is protected by copyright. Compilation © 2020 San Diego MLS®, Inc. SANDICOR Member Broker: Randy Thompson
Neighborhoods near Riverside, CA
Zip codes near Riverside, CA
- 91752 homes for sale
- 92313 homes for sale
- 92316 homes for sale
- 92324 homes for sale
- 92335 homes for sale
- 92337 homes for sale
- 92501 homes for sale
- 92503 homes for sale
- 92504 homes for sale
- 92505 homes for sale
- 92506 homes for sale
- 92507 homes for sale
- 92508 homes for sale
- 92509 homes for sale
- 92553 homes for sale
- 92557 homes for sale
- 92860 homes for sale
- 92878 homes for sale
- 92879 homes for sale
- 92881 homes for sale
Popular searches near Riverside, CA
- Bloomington homes for sale
- Colton homes for sale
- Corona homes for sale
- Eastvale homes for sale
- El Cerrito homes for sale
- El Sobrante homes for sale
- Fontana homes for sale
- Grand Terrace homes for sale
- Highgrove homes for sale
- Home Gardens homes for sale
- Jurupa homes for sale
- Jurupa Valley homes for sale
- Lake Mathews homes for sale
- Loma Linda homes for sale
- Mead Valley homes for sale
- Mira Loma homes for sale
- Moreno Valley homes for sale
- Norco homes for sale
- Rialto homes for sale
- Woodcrest homes for sale
Protect your home and budget from life's surprises with an Assurant Home Warranty, backed by a partner that supports you through every step of homeownership. Explore Plans.
©2026 Century 21 Real Estate LLC. All rights reserved. CENTURY 21®, the CENTURY 21 Logo and C21® are service marks owned by Century 21 Real Estate LLC. Century 21 Real Estate LLC fully supports the principles of the Fair Housing Act and the Equal Opportunity Act. Each office is independently owned and operated. Listing information is deemed reliable but not guaranteed accurate.