- Bridges At Gilbert, Gilbert homes for sale
- Cadence at Gateway, Mesa homes for sale
- Chandler Heights Citrus, Queen Creek homes for sale
- Charleston Estates, Queen Creek homes for sale
- Church Farm, Queen Creek homes for sale
- Coronado Ranch, Gilbert homes for sale
- Cortina, Queen Creek homes for sale
- Eastmark, Mesa homes for sale
- Encanterra, San Tan Valley homes for sale
- Hastings Farms, Queen Creek homes for sale
- Johnson Ranch, San Tan Valley homes for sale
- Power Ranch, Gilbert homes for sale
- Ranchos Jardines, Queen Creek homes for sale
- San Tan Ranch, Gilbert homes for sale
- Seville, Gilbert homes for sale
- Shamrock Estates, Gilbert homes for sale
- Sossaman Estates, Queen Creek homes for sale
- Sun Groves, Chandler homes for sale
- Trilogy at Power Ranch, Gilbert homes for sale
- Villages At Queen Creek, Queen Creek homes for sale
San Tan Valley, AZ - homes for sale
2 of 2 results displayed
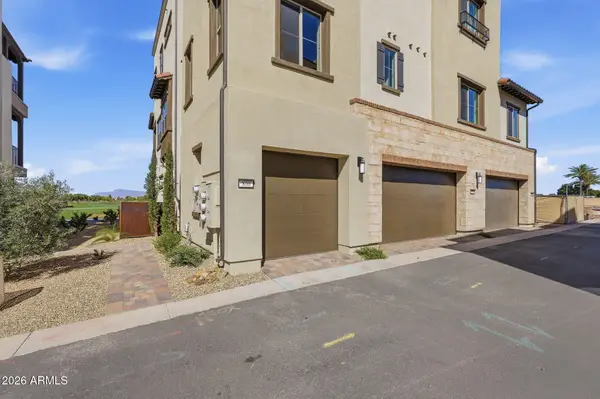 $546,990Pending2 beds 3 baths1,342 sq. ft.
800 E San Marino Drive, Queen Creek, AZ 85140
MLS# 7008030Listed by: KELLER WILLIAMS INTEGRITY FIRST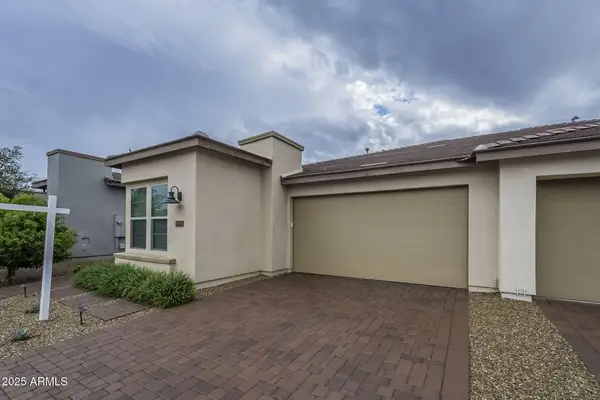 $449,900Pending2 beds 2 baths1,538 sq. ft.
291 E Las Puertas Lane, Queen Creek, AZ 85140
MLS# 6933368Listed by: SERHANT.
Local realty services provided by:CENTURY 21 Arizona West
Neighborhoods near San Tan Valley, AZ
Zip codes near San Tan Valley, AZ
- 85119 homes for sale
- 85120 homes for sale
- 85128 homes for sale
- 85140 homes for sale
- 85142 homes for sale
- 85143 homes for sale
- 85144 homes for sale
- 85206 homes for sale
- 85208 homes for sale
- 85209 homes for sale
- 85212 homes for sale
- 85225 homes for sale
- 85233 homes for sale
- 85234 homes for sale
- 85249 homes for sale
- 85286 homes for sale
- 85295 homes for sale
- 85296 homes for sale
- 85297 homes for sale
- 85298 homes for sale
Popular searches near San Tan Valley, AZ
- Ak-Chin Village homes for sale
- Apache Junction homes for sale
- Cactus Forest homes for sale
- Casa Grande homes for sale
- Chandler homes for sale
- Coolidge homes for sale
- Florence homes for sale
- Fountain Hills homes for sale
- Gilbert homes for sale
- Gold Canyon homes for sale
- Guadalupe homes for sale
- Maricopa homes for sale
- Mesa homes for sale
- North Pinal homes for sale
- Queen Creek homes for sale
- Queen Creek homes for sale
- Queen Valley homes for sale
- Sun Lakes homes for sale
- Superior homes for sale
- Tempe homes for sale
Protect your home and budget from life's surprises with an Assurant Home Warranty, backed by a partner that supports you through every step of homeownership. Explore Plans.
©2026 Century 21 Real Estate LLC. All rights reserved. CENTURY 21®, the CENTURY 21 Logo and C21® are service marks owned by Century 21 Real Estate LLC. Century 21 Real Estate LLC fully supports the principles of the Fair Housing Act and the Equal Opportunity Act. Each office is independently owned and operated. Listing information is deemed reliable but not guaranteed accurate.