- Alum Rock homes for sale
- Burbank homes for sale
- Cambrian Park homes for sale
- Campbell homes for sale
- Corralitos homes for sale
- Day Valley homes for sale
- Diablo Range homes for sale
- East Foothills homes for sale
- Fruitdale homes for sale
- Gilroy homes for sale
- Interlaken homes for sale
- Lexington Hills homes for sale
- Llagas-Uvas homes for sale
- Los Gatos homes for sale
- Monte Sereno homes for sale
- Morgan Hill homes for sale
- San Jose homes for sale
- San Martin homes for sale
- South Santa Clara Valley homes for sale
- Summit Rd homes for sale
Santa Clara County, CA - homes for sale
20 of 20 results displayed
 $599,108Active1 beds 1 baths575 sq. ft.
17050 Depot Street #302, Morgan Hill, CA 95037
MLS# ML82044054Listed by: VAN DAELE DEVELOPMENT
 $2,098,000Active2 beds 3 baths1,548 sq. ft.
103 Koa Court, Palo Alto, CA 94306
MLS# ML82042536Listed by: MARTIN FRANKEL, BROKER- Open Sat, 11am to 4pm
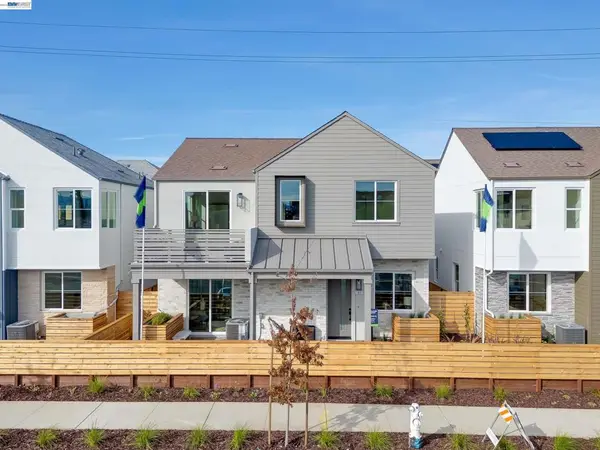 $2,995,000Active4 beds 4 baths2,721 sq. ft.
1897 Cook Court, Santa Clara, CA 95050
MLS# 41129979Listed by: COURTESY BROKERAGE  $1,562,000Active2 beds 3 baths1,424 sq. ft.
3089 El Camino Real #13, Santa Clara, CA 95051
MLS# 41127493Listed by: TOLL BROTHERS REAL ESTATE,INC- Open Sat, 10am to 6pm
 $1,189,990Active4 beds 4 baths2,085 sq. ft.
901 More Lane #1301, Morgan Hill, CA 95037
MLS# 41127153Listed by: BROOKFIELD RESIDENTIAL  $999,990Pending4 beds 4 baths1,844 sq. ft.
909 More Lane #1303, Morgan Hill, CA 95037
MLS# 41127160Listed by: BROOKFIELD RESIDENTIAL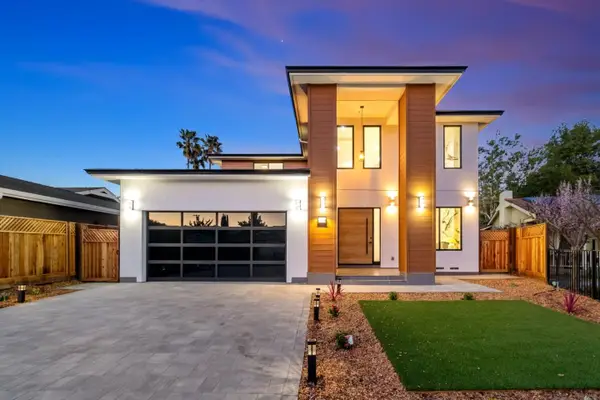 $5,680,000Pending6 beds 6 baths4,229 sq. ft.
1040 W Riverside Way, San Jose, CA 95129
MLS# ML82037565Listed by: BAYVIEW REALTY & FINANCIAL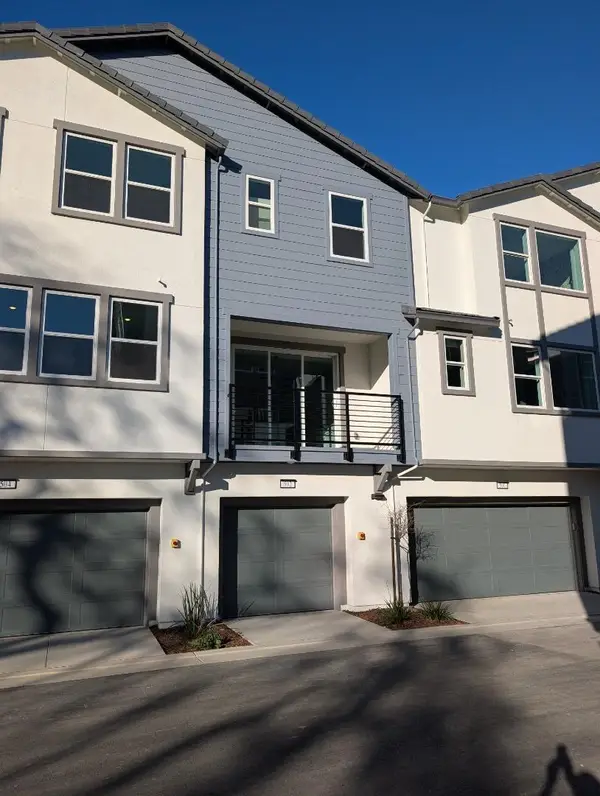 $1,421,990Pending2 beds 3 baths1,678 sq. ft.
289 Wagon Way #27-02 - Plan 2, Campbell, CA 95008
MLS# ML82036412Listed by: MICHELLE TANCREDI, BROKER $2,608,000Pending3 beds 3 baths1,751 sq. ft.
108 Koa Court, Palo Alto, CA 94306
MLS# ML82036170Listed by: MARTIN FRANKEL, BROKER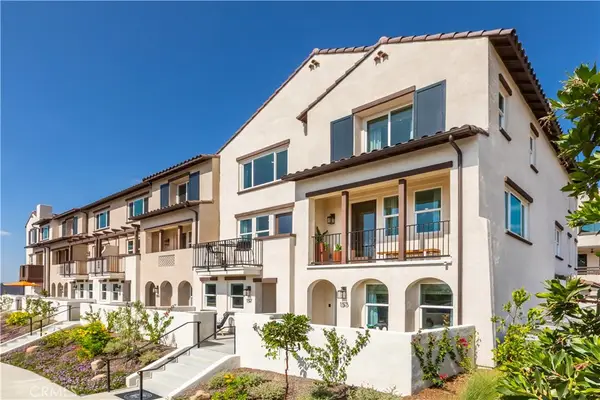 $579,990Pending2 beds 3 baths1,379 sq. ft.
216 Stillwater Lane, Claremont, CA 91711
MLS# OC26022605Listed by: IN TOWN LIVING, INC. $5,500,000Pending5 beds 6 baths4,865 sq. ft.
18271 Corte Agustin, Morgan Hill, CA 95037
MLS# 41116945Listed by: TOLL BROTHERS REAL ESTATE,INC $1,199,000Active2 beds 3 baths1,271 sq. ft.
1823 Passage Street, Milpitas, CA 95035
MLS# 41127518Listed by: TOLL BROTHERS REAL ESTATE,INC $5,080,000Pending6 beds 8 baths4,164 sq. ft.
6757 Devonshire Drive, San Jose, CA 95129
MLS# ML82021510Listed by: BAYVIEW REALTY & FINANCIAL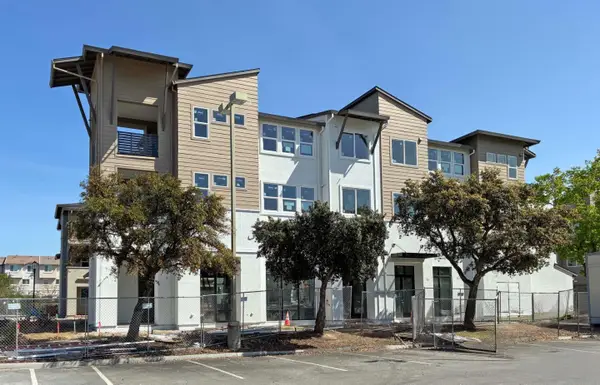 $604,976Active1 beds 1 baths575 sq. ft.
17050 Depot Street #300, Morgan Hill, CA 95037
MLS# ML82015535Listed by: VAN DAELE DEVELOPMENT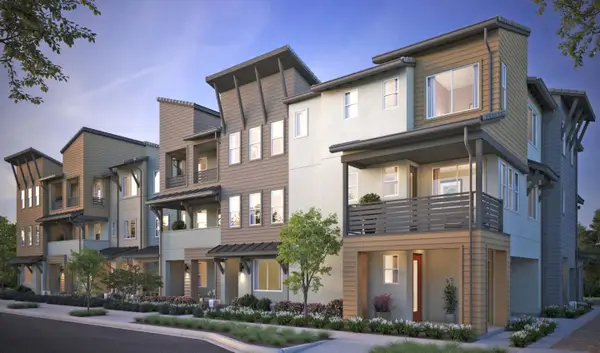 $721,877Pending2 beds 2 baths853 sq. ft.
17050 Depot Street, Morgan Hill, CA 95037
MLS# ML81998064Listed by: VAN DAELE DEVELOPMENT $4,598,000Active5 beds 6 baths3,760 sq. ft.
12668 Sun Valley Court, Saratoga, CA 95070
MLS# ML81955032Listed by: KW SANTA CLARA VALLEY INC $3,333,114Active5 beds 6 baths5,333 sq. ft.
1910 Via Santa Elena, Morgan Hill, CA 95037
MLS# 41040877Listed by: TOLL BROTHERS REAL ESTATE,INC $2,188,000Active4 beds 4 baths1,850 sq. ft.
851 Sierra Vista Avenue, Mountain View, CA 94043
MLS# ML81943821Listed by: MBI REALTY GROUP $15,888,000Active7 beds 9 baths9,208 sq. ft.
25538 Hidden Springs Court, Los Altos Hills, CA 94022
MLS# ML81916508Listed by: COLDWELL BANKER REALTY $5,480,000Active5 beds 6 baths3,669 sq. ft.
3886 Ross Road, Palo Alto, CA 94303
MLS# ML81935406Listed by: COMPASS
Local realty services provided by:CENTURY 21 Epic, CENTURY 21 Village Realty, CENTURY 21 Wildwood Properties, Inc.
Bay East 2026. CCAR 2026 bridgeMLS 2026. Information Deemed Reliable But Not Guaranteed. This information is being provided by the Bay East MLS, or CCAR MLS, or bridgeMLS. The listings presented here may or may not be listed by the Broker/Agent operating this website. This information is intended for the personal use of consumers and may not be used for any purpose other than to identify prospective properties consumers may be interested in purchasing. Data last updated at May 7, 2026
The information being provided by California Regional MLS (Southern California) is for the consumer's personal, non-commercial use and may not be used for any purpose other than to identify prospective properties consumer may be interested in purchasing. Any information relating to real estate for sale referenced on this web site comes from the Internet Data Exchange (IDX) program of the California Regional MLS (Southern California). CENTURY 21 Village Realty is not a Multiple Listing Service (MLS), nor does it offer MLS access. This website is a service of CENTURY 21 Village Realty, a broker participant of California Regional MLS (Southern California). This web site may reference real estate listing(s) held by a brokerage firm other than the broker and/or agent who owns this web site.
The accuracy of all information, regardless of source, including but not limited to open house information, square footages and lot sizes, is deemed reliable but not guaranteed and should be personally verified through personal inspection by and/or with the appropriate professionals. The data contained herein is copyrighted by California Regional MLS (Southern California) and is protected by all applicable copyright laws. Any unauthorized dissemination of this information is in violation of copyright laws and is strictly prohibited.
Copyright 2021 California Regional MLS (Southern California). All rights reserved.
Popular searches near Santa Clara County, CA
Popular neighborhoods near Santa Clara County, CA
- Almaden Springs, San Jose homes for sale
- Almaden Valley, San Jose homes for sale
- Avenida Espana, San Jose homes for sale
- AvenueOne, San Jose homes for sale
- Basking Ridge, San Jose homes for sale
- California Maison, San Jose homes for sale
- Chantilley, San Jose homes for sale
- Cottle to Lean, San Jose homes for sale
- Coyote, Morgan Hill homes for sale
- Downtown Morgan Hill, Morgan Hill homes for sale
- El Toro, Morgan Hill homes for sale
- Glider, San Jose homes for sale
- Heritage Greens, Morgan Hill homes for sale
- La Colina, San Jose homes for sale
- Los Paseos, San Jose homes for sale
- Makati, San Jose homes for sale
- Paradise Valley, Morgan Hill homes for sale
- Rancho Santa Teresa, San Jose homes for sale
- Santa Teresa, San Jose homes for sale
- UrbanOak, San Jose homes for sale
Zip codes near Santa Clara County, CA
- 95032 homes for sale
- 95037 homes for sale
- 95046 homes for sale
- 95111 homes for sale
- 95113 homes for sale
- 95116 homes for sale
- 95118 homes for sale
- 95119 homes for sale
- 95120 homes for sale
- 95121 homes for sale
- 95122 homes for sale
- 95123 homes for sale
- 95124 homes for sale
- 95125 homes for sale
- 95127 homes for sale
- 95135 homes for sale
- 95136 homes for sale
- 95138 homes for sale
- 95139 homes for sale
- 95148 homes for sale
Protect your home and budget from life's surprises with an Assurant Home Warranty, backed by a partner that supports you through every step of homeownership. Explore Plans.
©2026 Century 21 Real Estate LLC. All rights reserved. CENTURY 21®, the CENTURY 21 Logo and C21® are service marks owned by Century 21 Real Estate LLC. Century 21 Real Estate LLC fully supports the principles of the Fair Housing Act and the Equal Opportunity Act. Each office is independently owned and operated. Listing information is deemed reliable but not guaranteed accurate.