- Clarcona, Orlando homes for sale
- Country Creek, Altamonte Springs homes for sale
- Forest City, Apopka homes for sale
- Lake Fairview, Orlando homes for sale
- Lake Shore Village, Orlando homes for sale
- Lockhart, Orlando homes for sale
- Mercy Drive, Orlando homes for sale
- Piedmont Lakes, Apopka homes for sale
- Pine Hills, Orlando homes for sale
- Princeton/Silver Star, Orlando homes for sale
- Roesmont North, Orlando homes for sale
- Rosemont, Orlando homes for sale
- Signal Hill, Orlando homes for sale
- South Apopka, Apopka homes for sale
- Spring Oaks, Altamonte Springs homes for sale
- Spring Valley, Altamonte Springs homes for sale
- The Willows, Orlando homes for sale
- Weathersfield, Altamonte Springs homes for sale
- Wekiwa Springs, Longwood homes for sale
- Zellwood, Zellwood homes for sale
South Apopka, FL - homes for sale
53 of 53 results displayed
- New
 $419,900Active3 beds 2 baths1,792 sq. ft.
962 Grand Hilltop Drive, APOPKA, FL 32703
MLS# O6414169Listed by: WRA BUSINESS & REAL ESTATE - New
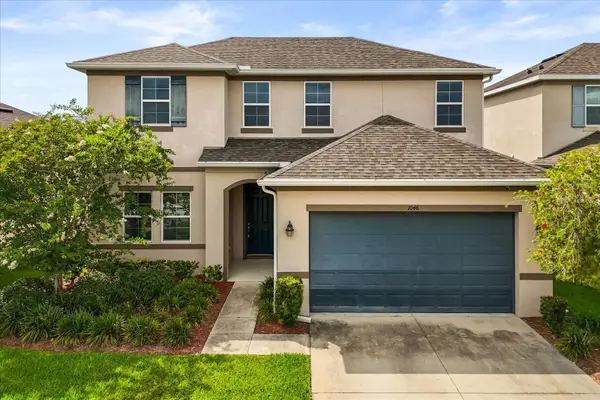 $520,000Active5 beds 3 baths2,691 sq. ft.
1046 Grand Hilltop Drive, APOPKA, FL 32703
MLS# O6412492Listed by: PROPERTIES IN TOWN - New
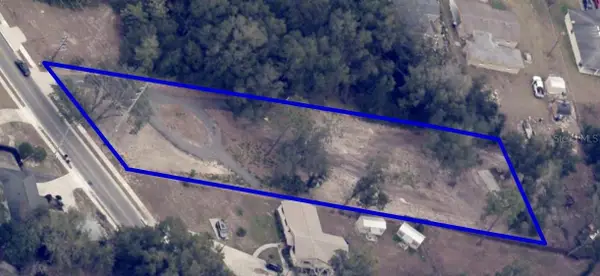 $169,900Active1.12 Acres
1621 Clarcona Road, APOPKA, FL 32703
MLS# O6412795Listed by: URBANISTA BROKERS - New
 $330,000Active3 beds 2 baths1,325 sq. ft.
1691 Lucy Terry Avenue, APOPKA, FL 32703
MLS# V4949061Listed by: LPT REALTY LLC - New
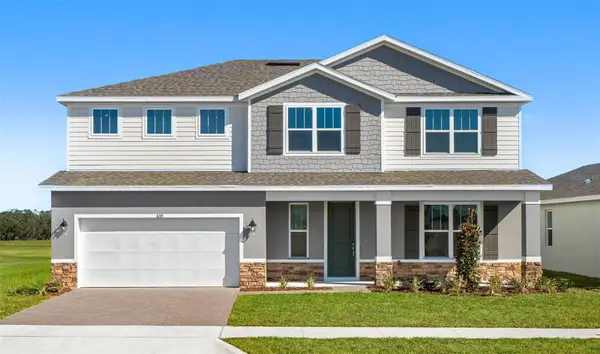
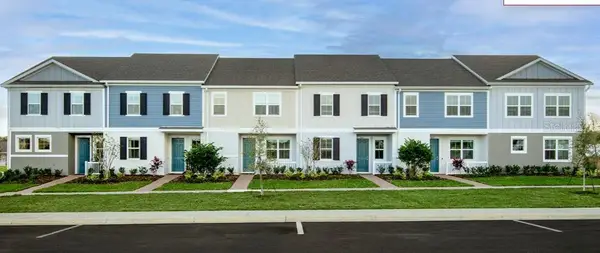 $367,720Active3 beds 3 baths1,662 sq. ft.
1521 Prestige Drive, APOPKA, FL 32703
MLS# O6412057Listed by: PARK SQUARE REALTY  $353,240Active4 beds 3 baths1,766 sq. ft.
660 Emerald Grove Drive, APOPKA, FL 32703
MLS# W7886144Listed by: MALTBIE REALTY GROUP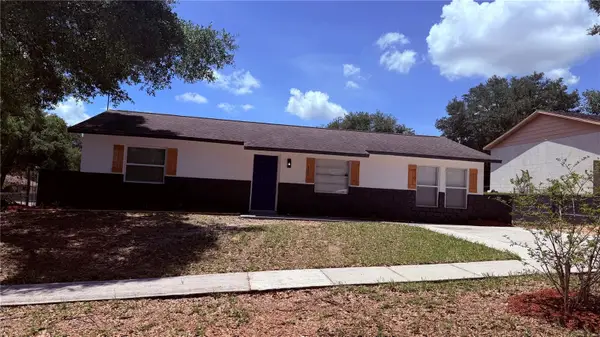 $289,000Pending3 beds 2 baths1,200 sq. ft.
436 Lake Opal Court, APOPKA, FL 32703
MLS# O6410688Listed by: LA ROSA RTY WINTER GARDEN LLC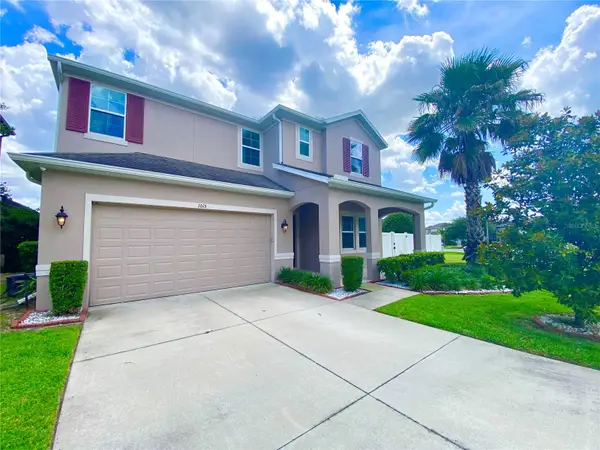 $570,000Active5 beds 5 baths3,839 sq. ft.
1015 Grand Hilltop Drive, APOPKA, FL 32703
MLS# O6408622Listed by: LPT REALTY, LLC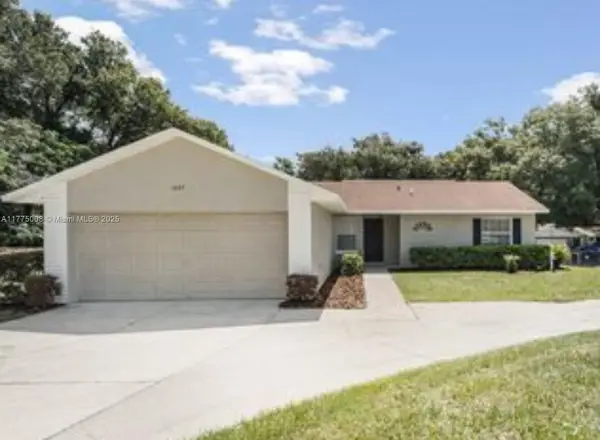 $289,000Active3 beds 2 baths1,139 sq. ft.
1649 Clarcona, Other, FL 32703
MLS# A11775008Listed by: REAL ESTATE OF FLORIDA BROWARD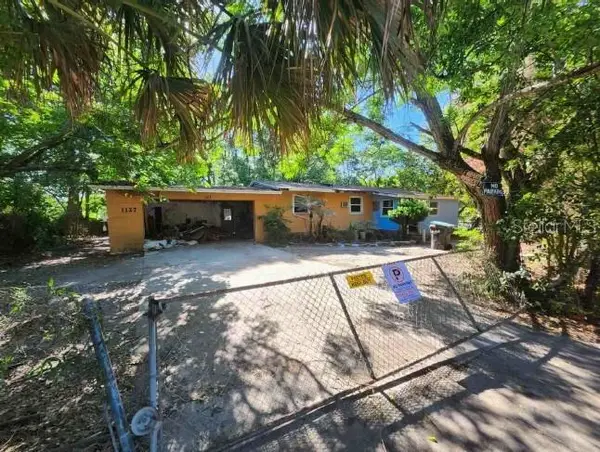 $100,000Pending3 beds 2 baths1,084 sq. ft.
1127 Robinson Avenue, APOPKA, FL 32703
MLS# O6407793Listed by: KARA MONEY LLC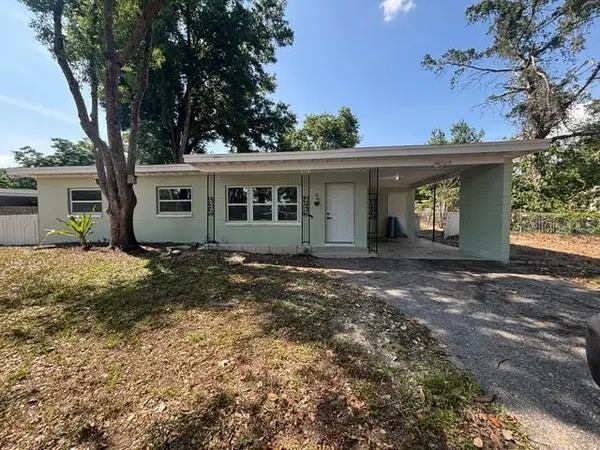 $315,000Active3 beds 1 baths1,189 sq. ft.
1435 Eden Drive, APOPKA, FL 32703
MLS# S5149798Listed by: LA ROSA REALTY KISSIMMEE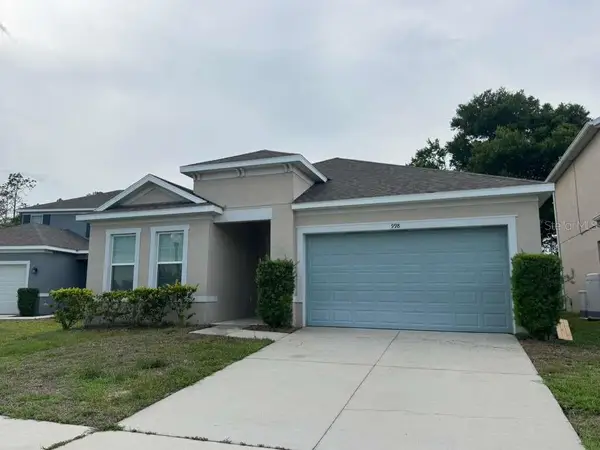 $394,900Active3 beds 2 baths1,792 sq. ft.
998 Grand Hilltop, APOPKA, FL 32703
MLS# O6406648Listed by: WOODSTONE INVESTMENTS LLC $430,000Active2 beds 2 baths950 sq. ft.
1741 S Hawthorne Avenue, APOPKA, FL 32703
MLS# S5147995Listed by: LA ROSA REALTY KISSIMMEE $375,730Pending3 beds 3 baths2,024 sq. ft.
1495 Sublime Lane, APOPKA, FL 32703
MLS# O6405998Listed by: PARK SQUARE REALTY $359,999Active4 beds 3 baths1,766 sq. ft.
648 Emerald Grove Drive, APOPKA, FL 32703
MLS# W7885545Listed by: MALTBIE REALTY GROUP $349,999Active4 beds 3 baths1,766 sq. ft.
644 Emerald Grove Drive, APOPKA, FL 32703
MLS# W7885548Listed by: MALTBIE REALTY GROUP $384,999Active4 beds 3 baths1,774 sq. ft.
632 Emerald Grove Drive, APOPKA, FL 32703
MLS# W7885494Listed by: MALTBIE REALTY GROUP $374,999Active4 beds 3 baths1,782 sq. ft.
652 Emerald Grove Drive, APOPKA, FL 32703
MLS# W7885477Listed by: MALTBIE REALTY GROUP $267,000Active3 beds 1 baths1,125 sq. ft.
1002 Tilden Avenue, APOPKA, FL 32703
MLS# R4911181Listed by: LAWHUN ENTERPRISES IV, LLC DBA: FLORIDA REALTY INVESTMENTS IV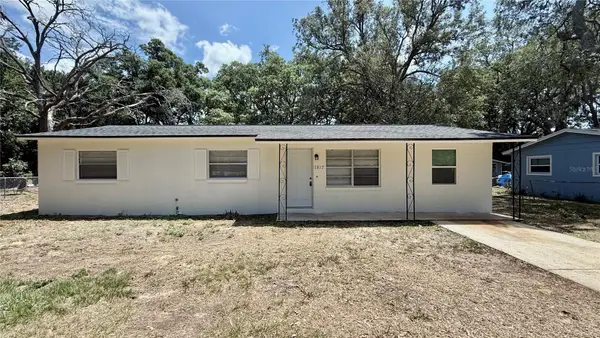 $279,900Pending4 beds 2 baths1,244 sq. ft.
1617 Long Lane, APOPKA, FL 32703
MLS# O6402474Listed by: COMPASS FLORIDA LLC $354,999Active4 beds 3 baths1,766 sq. ft.
636 Emerald Grove Drive, APOPKA, FL 32703
MLS# W7885398Listed by: MALTBIE REALTY GROUP $357,504Pending3 beds 3 baths1,766 sq. ft.
640 Emerald Grove Drive, APOPKA, FL 32703
MLS# W7885266Listed by: MALTBIE REALTY GROUP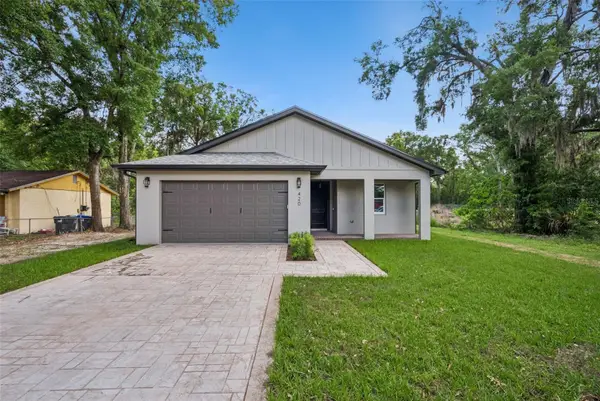 $411,900Active3 beds 2 baths1,940 sq. ft.
420 E 10th Street, APOPKA, FL 32703
MLS# O6401303Listed by: BROKER HUB REALTY GROUP LLC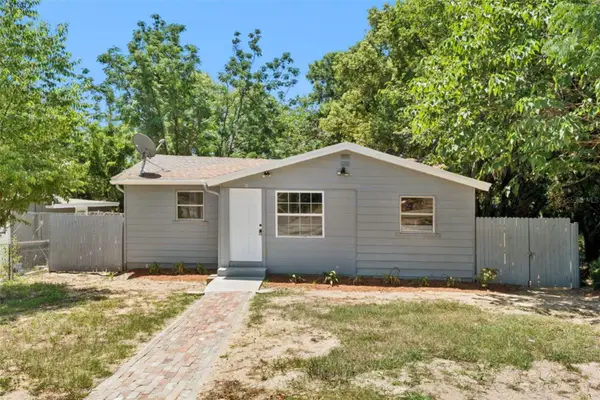 $239,900Active3 beds 1 baths933 sq. ft.
8 W Ella J Gilmore Street, APOPKA, FL 32703
MLS# O6401762Listed by: NETWORTH REALTY OF ORLANDO, LLC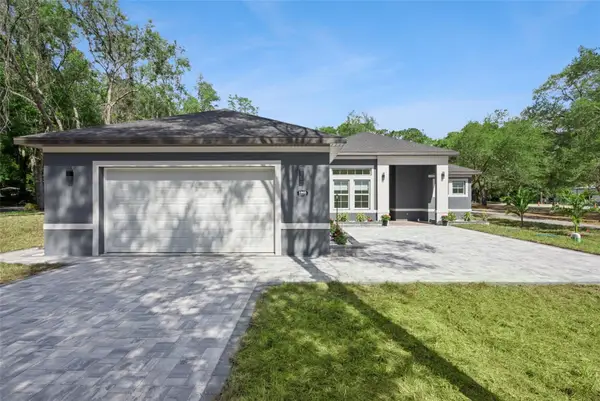 $597,000Active5 beds 3 baths2,198 sq. ft.
1965 Sheeler Avenue, APOPKA, FL 32703
MLS# O6398476Listed by: STIRLING INTERNATIONAL REAL ES $575,000Active5 beds 5 baths3,641 sq. ft.
947 Maypole Drive, APOPKA, FL 32703
MLS# O6401246Listed by: KELLER WILLIAMS CLASSIC $312,000Pending3 beds 3 baths1,703 sq. ft.
978 E 10th Street, APOPKA, FL 32703
MLS# V4948623Listed by: MAINSTREET REALTY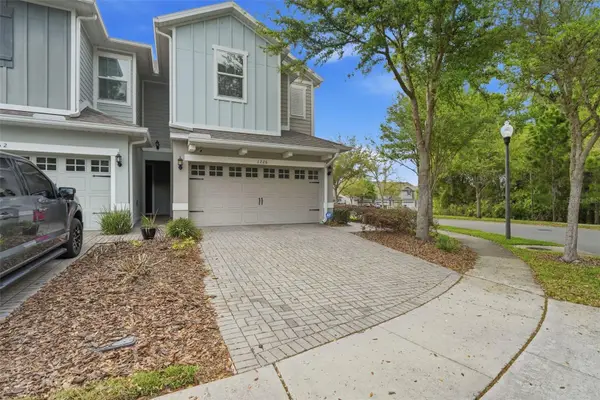 $315,000Pending3 beds 3 baths1,552 sq. ft.
1226 E 10th Street, APOPKA, FL 32703
MLS# O6398605Listed by: PREFERRED REAL ESTATE BROKERS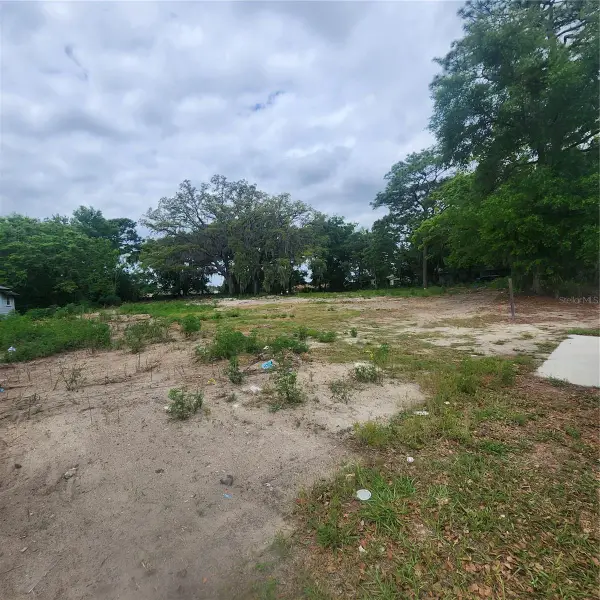 $310,000Active0.79 Acres
1648 Clarcona Road, APOPKA, FL 32703
MLS# G5110786Listed by: LA ROSA REALTY ORLANDO LLC- Open Sat, 12 to 4pm
 $549,999Active4 beds 4 baths2,694 sq. ft.
810 Emerald Grove Drive, APOPKA, FL 32703
MLS# W7884512Listed by: MALTBIE REALTY GROUP 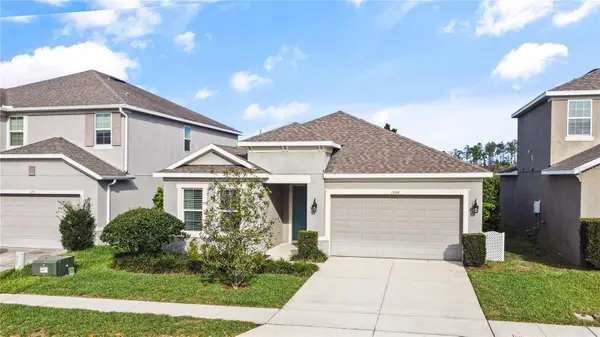 $414,900Pending3 beds 2 baths1,792 sq. ft.
1064 Grand Hilltop Drive, APOPKA, FL 32703
MLS# O6394226Listed by: ROSA CORTES LLC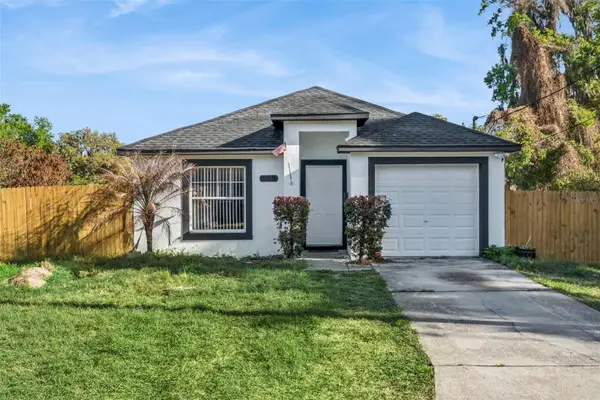 $285,000Active3 beds 3 baths1,186 sq. ft.
219 E 15th Street, APOPKA, FL 32703
MLS# O6394148Listed by: CHARLES RUTENBERG REALTY ORLANDO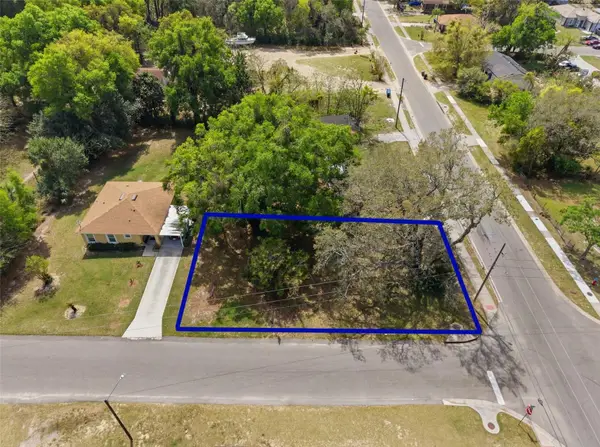 $58,900Active0.08 Acres
1301 S Central Avenue, APOPKA, FL 32703
MLS# O6392018Listed by: REALTY ONE GROUP MVP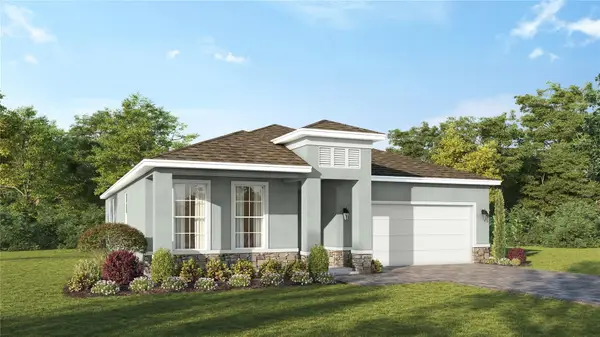 $509,999Active4 beds 2 baths1,839 sq. ft.
826 Emerald Grove Drive, APOPKA, FL 32703
MLS# W7884077Listed by: MALTBIE REALTY GROUP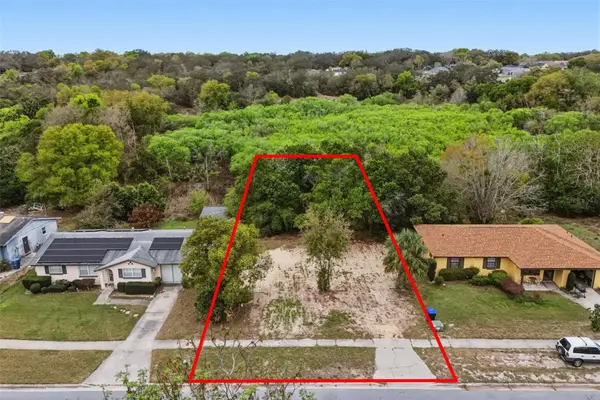 $150,000Active0.47 Acres
1670 S Central Avenue, APOPKA, FL 32703
MLS# O6391945Listed by: FIVE STAR REALTY ELITE $86,900Pending0.2 Acres
114 E Cleveland Street, APOPKA, FL 32703
MLS# O6388637Listed by: CHARLES RUTENBERG REALTY ORLANDO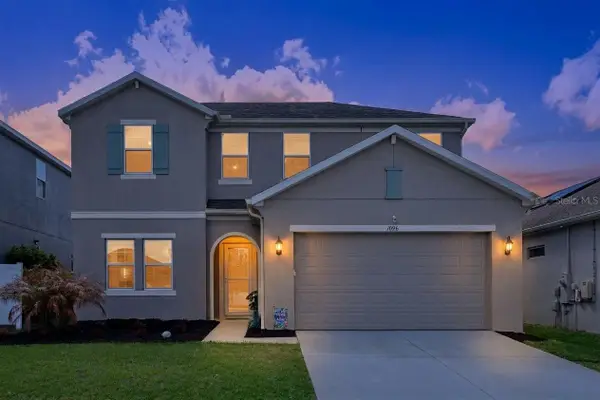 $459,900Pending4 beds 3 baths2,700 sq. ft.
1096 Alder Tree Drive, APOPKA, FL 32703
MLS# O6384261Listed by: LPT REALTY, LLC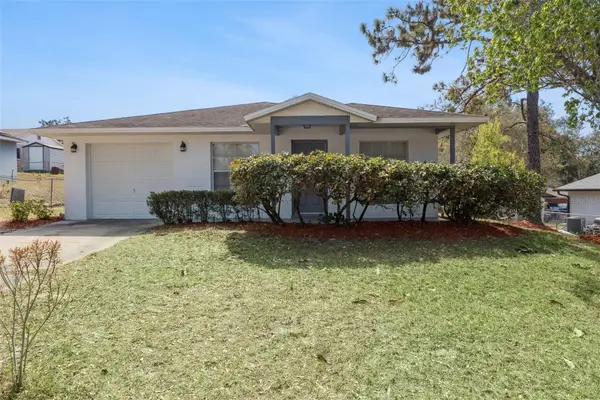 $289,000Pending3 beds 2 baths1,072 sq. ft.
433 Apopka Hills Circle, APOPKA, FL 32703
MLS# O6386196Listed by: NETWORTH REALTY OF ORLANDO, LLC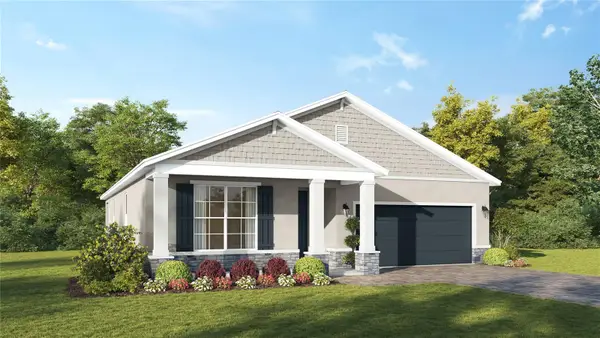 $488,470Pending4 beds 2 baths1,839 sq. ft.
778 Emerald Grove Drive, APOPKA, FL 32703
MLS# W7883032Listed by: MALTBIE REALTY GROUP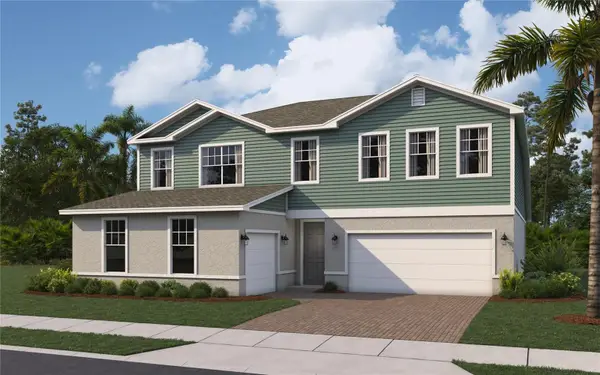 $659,999Active5 beds 4 baths2,982 sq. ft.
687 Emerald Grove Drive, APOPKA, FL 32703
MLS# W7883033Listed by: MALTBIE REALTY GROUP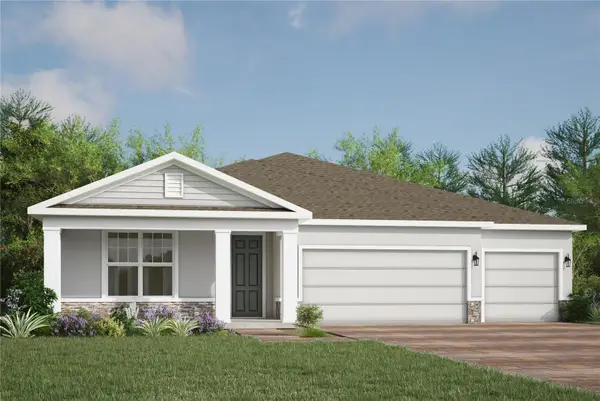 $567,289Pending4 beds 4 baths2,776 sq. ft.
647 Emerald Grove Drive, APOPKA, FL 32703
MLS# W7883029Listed by: MALTBIE REALTY GROUP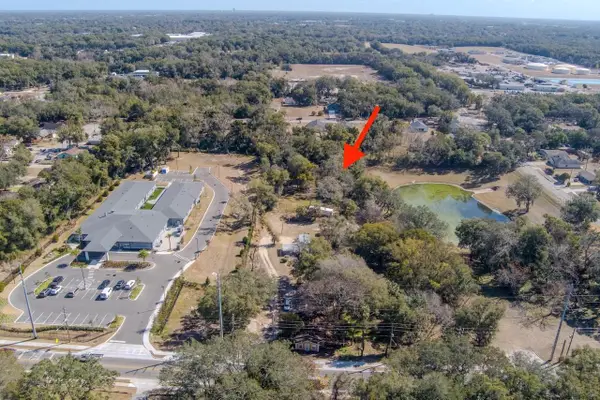 $65,000Active0.4 Acres
152 Saunders Street, APOPKA, FL 32703
MLS# O6382367Listed by: DIBS REALTY, LLC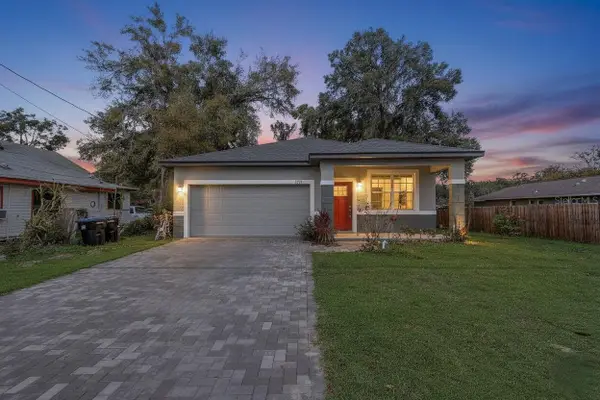 $349,995Active3 beds 2 baths1,503 sq. ft.
309 E 13th Street, APOPKA, FL 32703
MLS# O6372979Listed by: CENTRIC REALTY SERVICES LLC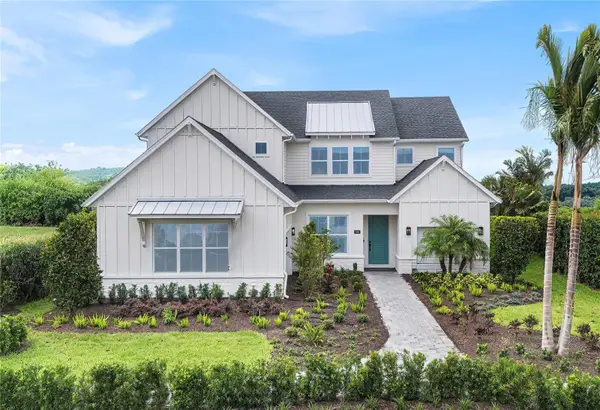 $943,006Pending5 beds 4 baths3,987 sq. ft.
1772 Stonecliff Drive, APOPKA, FL 32703
MLS# O6366820Listed by: ORLANDO TBI REALTY LLC $259,000Pending4 beds 2 baths1,158 sq. ft.
30 W Hammon Drive, APOPKA, FL 32703
MLS# O6351553Listed by: KELLER WILLIAMS CLASSIC $279,900Pending3 beds 2 baths1,060 sq. ft.
11 E Ella J Gilmore Street, APOPKA, FL 32703
MLS# O6348026Listed by: REALTY HUB $289,000Active3 beds 2 baths1,344 sq. ft.
721 E 13th Street, APOPKA, FL 32703
MLS# O6338033Listed by: FLORIDA REALTY INVESTMENTS $280,000Active3 beds 2 baths888 sq. ft.
1608 Long Lane, APOPKA, FL 32703
MLS# S5132596Listed by: SUNQUEST INVESTMENT REALTY LLC $679,000Active4 beds 3 baths2,510 sq. ft.
1484 Stonecliff Drive, APOPKA, FL 32703
MLS# O6335377Listed by: ORLANDO TBI REALTY LLC $250,000Active3 beds 2 baths1,253 sq. ft.
94 E 18th Street, APOPKA, FL 32703
MLS# O6324526Listed by: EXP REALTY LLC $499,900Active4 beds 2 baths1,736 sq. ft.
1120 Sheeler Avenue, APOPKA, FL 32703
MLS# O6292079Listed by: STIRLING INTERNATIONAL REAL ES $359,000Active2 Acres
608 E 13th Street, APOPKA, FL 32703
MLS# O6249845Listed by: STIRLING INTERNATIONAL REAL ES $1,400,000Pending5.23 Acres
E Keene Road, APOPKA, FL 32703
MLS# O5925143Listed by: ONE OAK REALTY CORP
Local realty services provided by:CENTURY 21 SUNBELT REALTY, CENTURY 21 Circle
The information being provided by Stellar Mls is for the consumer's personal, non-commercial use and may not be used for any purpose other than to identify prospective properties consumer may be interested in purchasing. Any information relating to real estate for sale referenced on this web site comes from the Internet Data Exchange (IDX) program of the Stellar Mls. CENTURY 21 SUNBELT REALTY is not a Multiple Listing Service (MLS), nor does it offer MLS access. This website is a service of CENTURY 21 SUNBELT REALTY, a broker participant of Stellar Mls. This web site may reference real estate listing(s) held by a brokerage firm other than the broker and/or agent who owns this web site.
The accuracy of all information, regardless of source, including but not limited to open house information, square footages and lot sizes, is deemed reliable but not guaranteed and should be personally verified through personal inspection by and/or with the appropriate professionals. The data contained herein is copyrighted by Stellar Mls and is protected by all applicable copyright laws. Any unauthorized dissemination of this information is in violation of copyright laws and is strictly prohibited.
Properties in listings may have been sold or may no longer be available.
Copyright 2026 Stellar Mls. All rights reserved. MFRMLS Member Broker: Jim Fischer
Information deemed reliable but not guaranteed. Information is provided, in part, by Greater Miami MLS. This information being provided is for consumer's personal, non-commercial use and may not be used for any other purpose other than to identify prospective properties consumers may be interested in purchasing. SEFMLS Member Broker: David Cates
Neighborhoods near South Apopka, FL
Zip codes near South Apopka, FL
- 32701 homes for sale
- 32703 homes for sale
- 32712 homes for sale
- 32714 homes for sale
- 32730 homes for sale
- 32750 homes for sale
- 32751 homes for sale
- 32757 homes for sale
- 32776 homes for sale
- 32779 homes for sale
- 32789 homes for sale
- 32798 homes for sale
- 32804 homes for sale
- 32808 homes for sale
- 32810 homes for sale
- 32818 homes for sale
- 32835 homes for sale
- 34734 homes for sale
- 34760 homes for sale
- 34761 homes for sale
Popular searches near South Apopka, FL
- Altamonte Springs homes for sale
- Apopka homes for sale
- Casselberry-Altamonte Springs homes for sale
- Clarcona homes for sale
- Eatonville homes for sale
- Fairview Shores homes for sale
- Fern Park homes for sale
- Forest City homes for sale
- Gotha homes for sale
- Lockhart homes for sale
- Longwood homes for sale
- Maitland homes for sale
- Ocoee homes for sale
- Orlovista homes for sale
- Paradise Heights homes for sale
- Pine Hills homes for sale
- Wekiwa Springs homes for sale
- Winter Garden homes for sale
- Winter Garden-Ocoee homes for sale
- Zellwood homes for sale
Protect your home and budget from life's surprises with an Assurant Home Warranty, backed by a partner that supports you through every step of homeownership. Explore Plans.
©2026 Century 21 Real Estate LLC. All rights reserved. CENTURY 21®, the CENTURY 21 Logo and C21® are service marks owned by Century 21 Real Estate LLC. Century 21 Real Estate LLC fully supports the principles of the Fair Housing Act and the Equal Opportunity Act. Each office is independently owned and operated. Listing information is deemed reliable but not guaranteed accurate.