- Arcadia Hills, Greenville homes for sale
- Beaumont Mill Village, Spartanburg homes for sale
- Blue Ridge Plantation, Taylors homes for sale
- Carolina Country Club, Spartanburg homes for sale
- Dillworth Park, Greer homes for sale
- Greenline, Greenville homes for sale
- Hartness, Greenville homes for sale
- Holly Tree, Simpsonville homes for sale
- Lake Lanier, Landrum homes for sale
- Neely Farm, Simpsonville homes for sale
- Nicholtown, Greenville homes for sale
- Orchard Farms, Simpsonville homes for sale
- Remington, Simpsonville homes for sale
- Rock Springs, Spartanburg homes for sale
- Rolling Green Village, Greenville homes for sale
- The Cliffs at Glassy, Landrum homes for sale
- The Creeks at Woodfin Ridge, Inman homes for sale
- Thornblade, Greer homes for sale
- Timm Creek Community, Roebuck homes for sale
- Woodland Heights, Spartanburg homes for sale
Spartanburg, SC - homes for sale
300 of 644 results displayed
- New
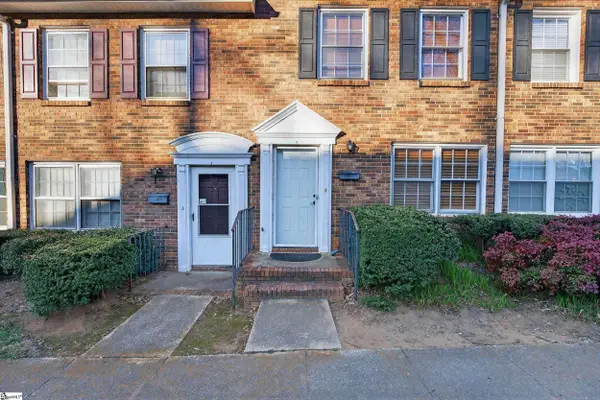 $125,000Active2 beds 2 baths
1436 Dover Road, Spartanburg, SC 29601
MLS# 1594043Listed by: LPT REALTY, LLC. - New
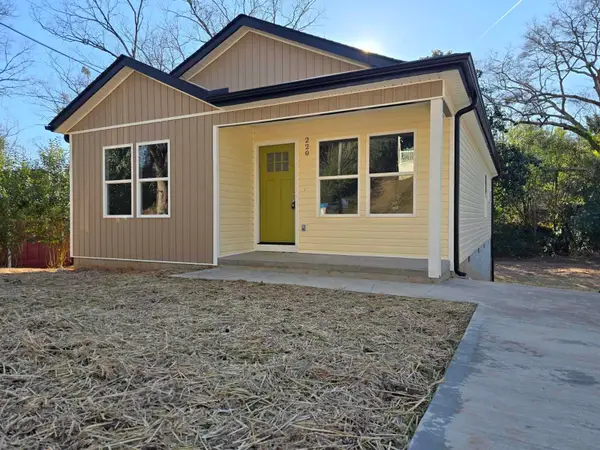 $179,990Active3 beds 2 baths1,237 sq. ft.
220 Caulder Circle, Spartanburg, SC 29306
MLS# 338030Listed by: KELLER WILLIAMS REALTY - New
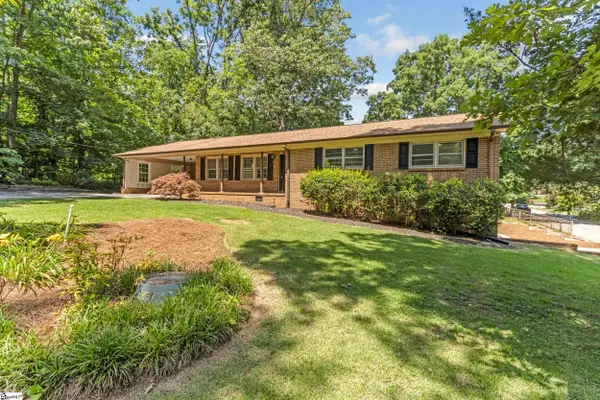 $284,900Active3 beds 2 baths
402 Woodley Road, Spartanburg, SC 29306
MLS# 1593999Listed by: BHHS C DAN JOYNER - MIDTOWN - New
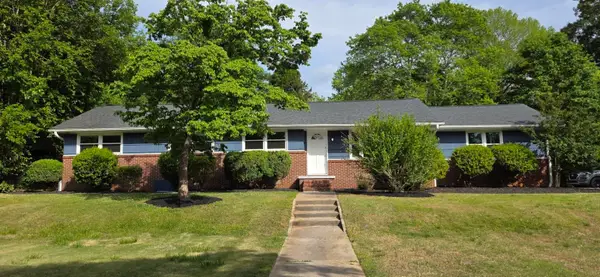 $279,900Active3 beds 2 baths1,700 sq. ft.
191 Pershing, Spartanburg, SC 29302
MLS# 338012Listed by: LEGACY REAL ESTATE, INC. - New
 $224,900Active3 beds 2 baths1,556 sq. ft.
201 Tucker Rd, Spartanburg, SC 29306
MLS# 338013Listed by: TRELORA REALTY, INC - New
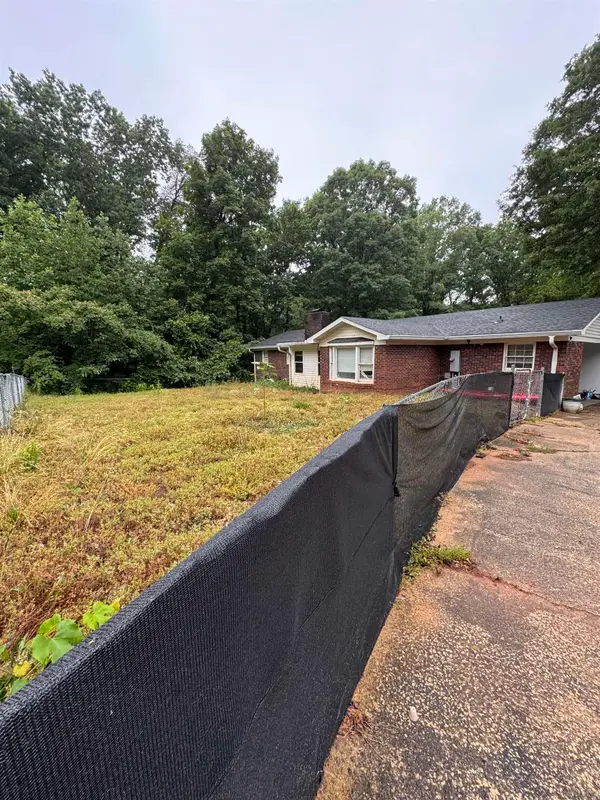
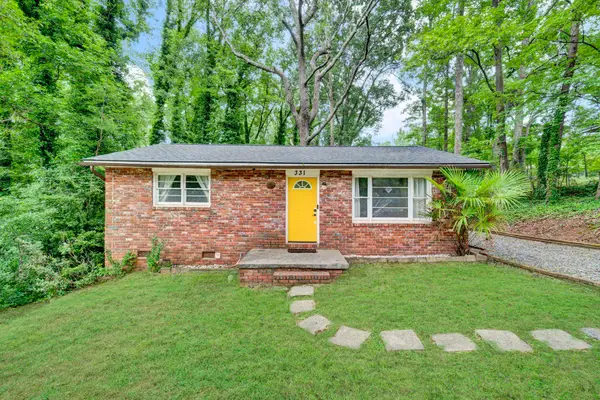 $199,900Active2 beds 1 baths876 sq. ft.
331 Amherst Drive, Spartanburg, SC 29306-4262
MLS# 338019Listed by: BHHS C DAN JOYNER - MIDTOWN - New
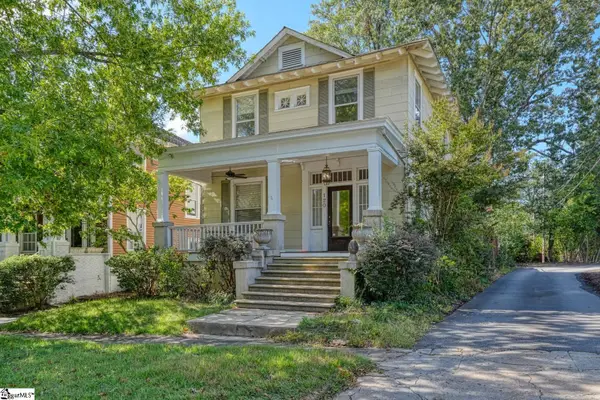 $375,000Active3 beds 3 baths
120 Connecticut Avenue, Spartanburg, SC 29306
MLS# 1593979Listed by: EXP REALTY LLC - New
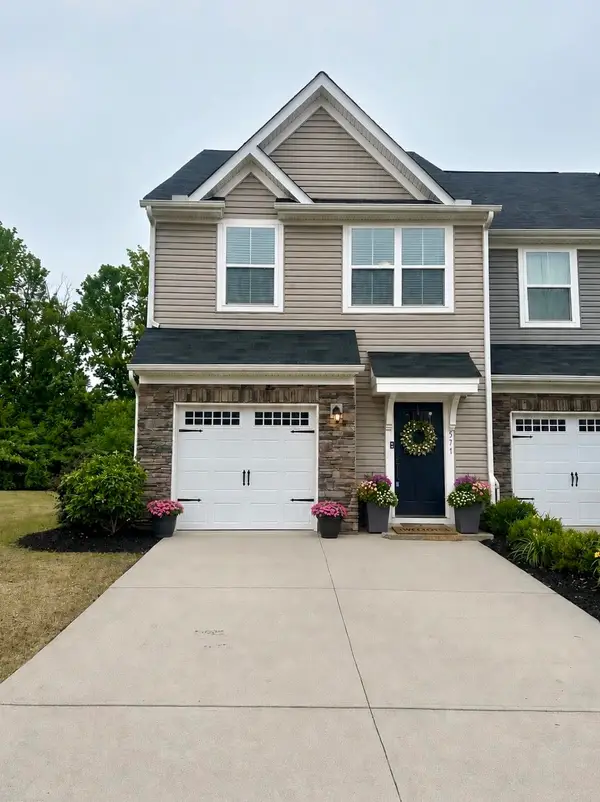
 $198,500Active3 beds 3 baths
571 Preakness Run, Spartanburg, SC 29306
MLS# 1593957Listed by: CENTURY 21 BLACKWELL & COMPANY - New
 $198,500Active3 beds 3 baths1,544 sq. ft.
571 Preakness Run, Spartanburg, SC 29301
MLS# 338008Listed by: C 21 BLACKWELL & CO - New
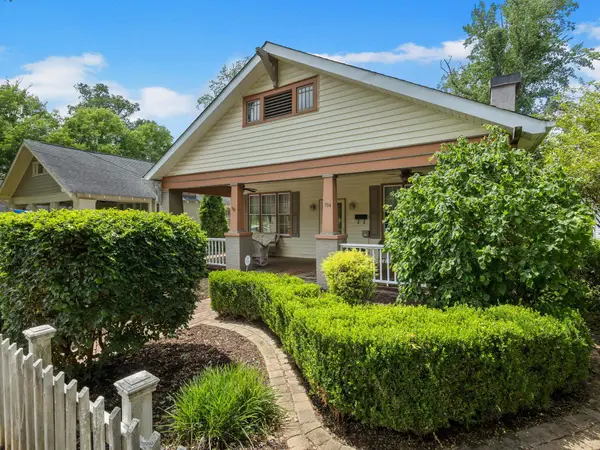 $350,000Active3 beds 2 baths1,587 sq. ft.
754 Rutledge Street, Spartanburg, SC 29302
MLS# 337979Listed by: COLDWELL BANKER CAINE REAL EST - New
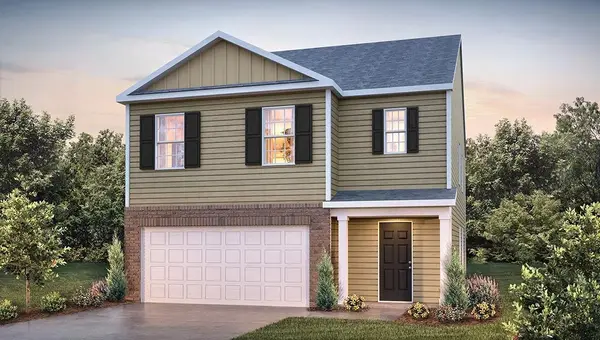 $294,900Active5 beds 3 baths2,361 sq. ft.
618 Starbeam Court, Spartanburg, SC 29303
MLS# 337985Listed by: D.R. HORTON - New
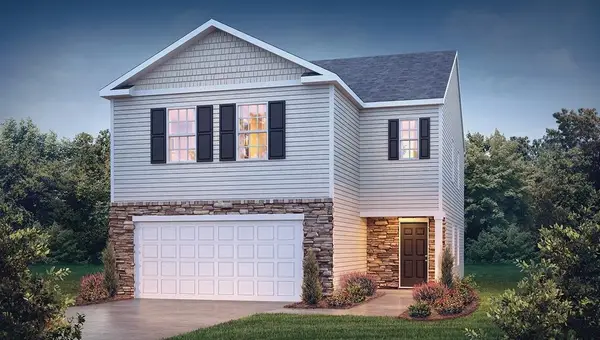 $296,900Active4 beds 3 baths2,174 sq. ft.
622 Starbeam Court, Spartanburg, SC 29303
MLS# 337986Listed by: D.R. HORTON - New
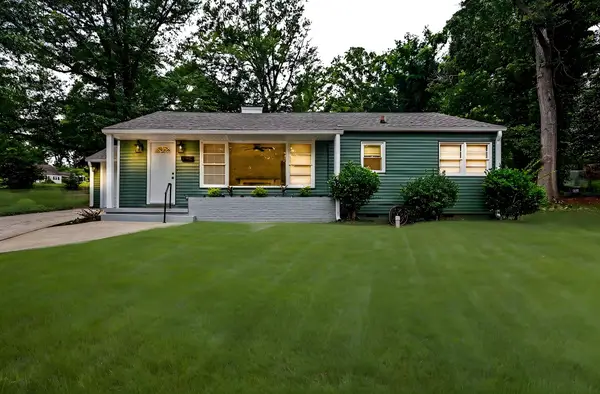 $205,000Active2 beds 1 baths937 sq. ft.
931 Windy Court, Spartanburg, SC 29301
MLS# 338001Listed by: BHHS C DAN JOYNER - SPTBG - New
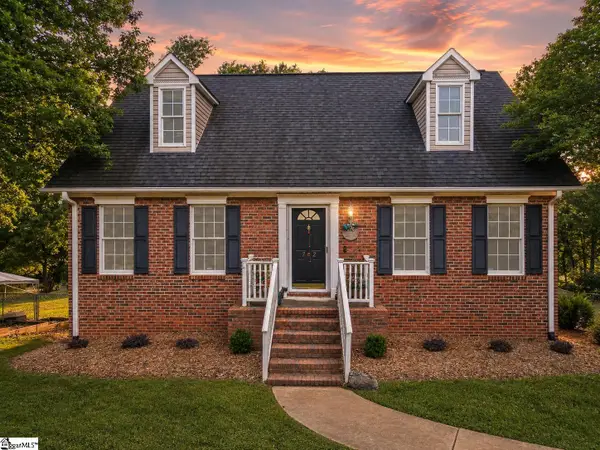 $350,000Active3 beds 2 baths
702 Keltner Avenue, Spartanburg, SC 29302
MLS# 1593866Listed by: REAL HOME INTERNATIONAL - New
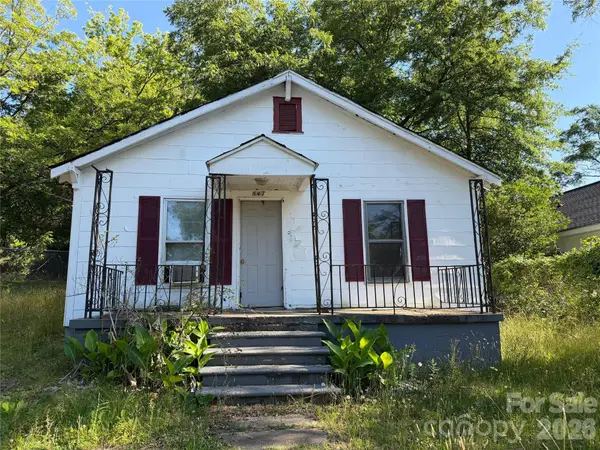 $39,900Active1 beds 1 baths975 sq. ft.
547 S Center Street, Spartanburg, SC 29301
MLS# 4389696Listed by: RINEHART REALTY CORPORATION - New
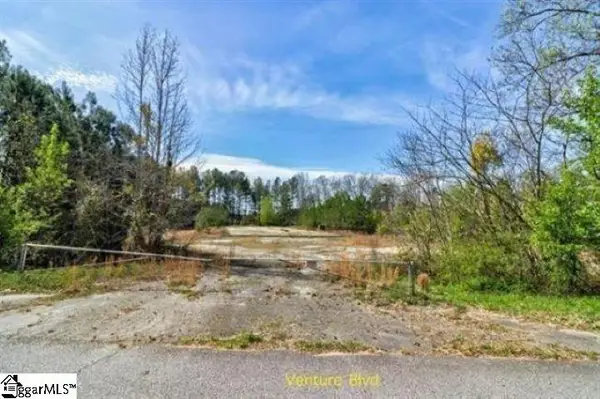 $300,000Active0 Acres
120 Venture Boulevard, Spartanburg, SC 29306
MLS# 1593862Listed by: SUCCESS PROPERTIES, LLC - New
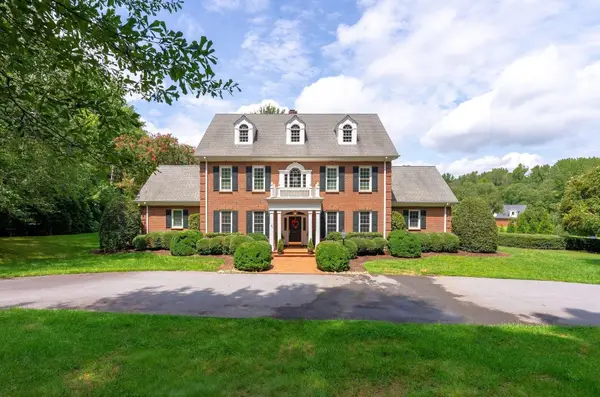
 $429,000Active4 beds 3 baths3,010 sq. ft.
1113 Denington Drive, Spartanburg, SC 29307
MLS# 337941Listed by: COLDWELL BANKER CAINE REAL EST - New
 $1,389,000Active4 beds 5 baths4,586 sq. ft.
291 Montgomery Dr, Spartanburg, SC 29302
MLS# 337923Listed by: PACK AND COMPANY REAL ESTATE - New
 $40,000Active0 Acres
570 Draymont Drive, Spartanburg, SC 29301
MLS# 1593683Listed by: THE SEARS GROUP, LLC - New
 $429,000Active3 beds 3 baths2,537 sq. ft.
494 Savanna Plains Drive, Spartanburg, SC 29307
MLS# 337909Listed by: COLDWELL BANKER CAINE REAL EST - New
 $89,000Active3 beds 2 baths1,100 sq. ft.
318 Garner Road, Spartanburg, SC 29303
MLS# 337910Listed by: AFFINITY GROUP REALTY - New
 $259,000Active3 beds 2 baths1,251 sq. ft.
771 Maple Street, Spartanburg, SC 29302
MLS# 337918Listed by: COLDWELL BANKER CAINE REAL EST - New
 $105,000Active2 beds 1 baths
451 Longview Drive, Spartanburg, SC 29303
MLS# 1593657Listed by: CHUCKTOWN HOMES TEAM BY LPT - New
 $215,000Active3 beds 2 baths
150 Evvalane Drive, Spartanburg, SC 29302
MLS# 1593658Listed by: AFFINITY GROUP REALTY - New
 $189,900Active3 beds 2 baths1,248 sq. ft.
1888 Tamara Way, Spartanburg, SC 29301
MLS# 337899Listed by: TRELORA REALTY, INC - New
 $315,000Active3 beds 2 baths2,600 sq. ft.
349 Weblin St, Spartanburg, SC 29306
MLS# 337884Listed by: KELLER WILLIAMS REALTY - New
 $135,000Active3 beds 1 baths
109 Neely Avenue, Spartanburg, SC 29302
MLS# 1593596Listed by: THE PROPERTY LOUNGE - New
 $209,000Active3 beds 2 baths
353 St Andrews Street, Spartanburg, SC 29306
MLS# 1593584Listed by: KELLER WILLIAMS REALTY - New
 $929,000Active4 beds 3 baths
141 Shoreham Road, Spartanburg, SC 29307
MLS# 1593591Listed by: BLUEFIELD REALTY GROUP  $104,000Pending2 beds 1 baths
739 Baltimore Street, Spartanburg, SC 29303
MLS# 1593586Listed by: REAL GVL/REAL BROKER, LLC- New
 $160,000Active3 beds 1 baths
104 Carolyn Drive, Spartanburg, SC 29306
MLS# 1593572Listed by: KELLER WILLIAMS GRV UPST - New
 $169,900Active2 beds 1 baths
650 S Converse Street, Spartanburg, SC 29306
MLS# 1593573Listed by: BLUEFIELD REALTY GROUP - New
 $165,000Active2 beds 1 baths816 sq. ft.
102 Helen Street, Spartanburg, SC 29301
MLS# 337866Listed by: BETTER HOMES & GARDENS YOUNG & - New
 $1,150,000Active5 beds 5 baths4,028 sq. ft.
1049 Otis Boulevard, Spartanburg, SC 29302
MLS# 337860Listed by: COLDWELL BANKER CAINE REAL EST - New
 $250,000Active3 beds 2 baths1,751 sq. ft.
400 Tucker Road, Spartanburg, SC 29306
MLS# 337862Listed by: COLDWELL BANKER CAINE REAL EST - New
 $259,900Active4 beds 3 baths1,850 sq. ft.
186 Stribling Circle, Spartanburg, SC 29301
MLS# 337843Listed by: THE ROSALES GROUP@KW - New
 $349,900Active3 beds 3 baths2,553 sq. ft.
52 Woodwind Drive Drive, Spartanburg, SC 29302
MLS# 337801Listed by: THE W LEWIS WHITE CO INC - New
 $295,000Active2 beds 2 baths1,244 sq. ft.
160 Ivy Street, Spartanburg, SC 29302
MLS# 337813Listed by: COLDWELL BANKER CAINE REAL EST - New
 $534,900Active3 beds 3 baths2,522 sq. ft.
103 N Bennington Drive, Spartanburg, SC 29307
MLS# 337818Listed by: RE/MAX EXECUTIVE SPARTANBURG - New
 $486,000Active3 beds 2 baths2,248 sq. ft.
549 Poplar Street, Spartanburg, SC 29302
MLS# 337798Listed by: COLDWELL BANKER CAINE REAL EST - New
 $214,900Active3 beds 3 baths1,220 sq. ft.
5 Bethel Street, spartanburg, SC 29306
MLS# 337768Listed by: BELLE REALTY AND ASSOCIATES - New
 $243,000Active3 beds 2 baths1,148 sq. ft.
2116 Mayberry Drive, Spartanburg, SC 29301
MLS# 337773Listed by: MUNGO HOMES PROPERTIES LLC GREENVILLE - New
 $145,000Active2 beds 2 baths800 sq. ft.
515 Beverly Road, Spartanburg, SC 29307
MLS# 337778Listed by: EXP REALTY LLC - New
 $209,000Active3 beds 2 baths1,698 sq. ft.
479 Peronneau Street, Spartanburg, SC 29301
MLS# 337780Listed by: CEF AND CO - New
 $243,000Active3 beds 2 baths
2116 Mayberry Drive #Lot 19, Spartanburg, SC 29301
MLS# 1593388Listed by: MUNGO HOMES PROPERTIES, LLC - New
 $369,000Active4 beds 3 baths2,500 sq. ft.
206 Collingwood Lane, Spartanburg, SC 29301
MLS# 337749Listed by: KELLER WILLIAMS REALTY - New
 $499,000Active4 beds 3 baths3,755 sq. ft.
300 Lake Forest Dr, Spartanburg, SC 29302
MLS# 337751Listed by: PACK AND COMPANY REAL ESTATE  $165,000Pending3 beds 2 baths
102 Pyle Court, Spartanburg, SC 29306
MLS# 1593302Listed by: SERHANT- New
 $1,199,000Active4 beds 3 baths
772 Glendalyn Avenue, Spartanburg, SC 29302
MLS# 1593298Listed by: BLACKSTREAM INTERNATIONAL RE - New
 $108,000Active3 beds 2 baths1,400 sq. ft.
329 Amherst Dr, spartanburg, SC 29306
MLS# 337731Listed by: AFFINITY GROUP REALTY - New
 $829,999Active5 beds 5 baths4,323 sq. ft.
1292 Deerfield Drive, Spartanburg, SC 29302
MLS# 337735Listed by: AFFINITY GROUP REALTY - New
 $189,900Active3 beds 2 baths1,248 sq. ft.
607 Basil Court, Spartanburg, SC 29301
MLS# 337727Listed by: TRELORA REALTY, INC - New
 $194,900Active3 beds 2 baths1,248 sq. ft.
1872 Tamara Way, Spartanburg, SC 29301
MLS# 337729Listed by: TRELORA REALTY, INC - New
 $229,900Active3 beds 2 baths1,554 sq. ft.
106 Hancock Avenue, Spartanburg, SC 29302
MLS# 337726Listed by: COLDWELL BANKER CAINE REAL EST - New
 $184,900Active2 beds 2 baths1,248 sq. ft.
184 Buckstone Lane, Spartanburg, SC 29307
MLS# 337711Listed by: COLDWELL BANKER CAINE REAL EST - New
 $259,900Active3 beds 2 baths
549 Barnwell Road, Spartanburg, SC 29303
MLS# 1593154Listed by: EXP REALTY LLC  $104,900Pending2 beds 1 baths1,008 sq. ft.
522 Wildwood Drive, spartanburg, SC 29306
MLS# 337633Listed by: BELLE REALTY AND ASSOCIATES- New
 $165,000Active2 beds 2 baths908 sq. ft.
685 Southern Street, Spartanburg, SC 29303
MLS# 337637Listed by: PONCE REALTY GROUP  $184,900Active3 beds 2 baths1,248 sq. ft.
1880 Tamara Way, Spartanburg, SC 29301
MLS# 337604Listed by: TRELORA REALTY, INC $164,900Active3 beds 2 baths1,411 sq. ft.
150 Princeton Street, Spartanburg, SC 29306
MLS# 337570Listed by: TRELORA REALTY, INC $189,900Active3 beds 2 baths1,248 sq. ft.
1840 Tamara Way, Spartanburg, SC 29301
MLS# 337571Listed by: TRELORA REALTY, INC $189,900Active3 beds 2 baths1,248 sq. ft.
1876 Tamara Way, Spartanburg, SC 29301
MLS# 337572Listed by: TRELORA REALTY, INC $225,000Pending-- beds -- baths1,336 sq. ft.
723 Connecticut Avenue, Spartanburg, SC 29302
MLS# 337577Listed by: THE W LEWIS WHITE CO INC $214,990Pending3 beds 3 baths1,732 sq. ft.
202 Keaton Court, Spartanburg, SC 29301
MLS# 337582Listed by: KELLER WILLIAMS REALTY $179,999Active3 beds 3 baths1,423 sq. ft.
840 Mahaffey Court, Spartanburg, SC 29301
MLS# 337591Listed by: LENNAR CAROLINAS, LLC $310,000Active3 beds 2 baths1,576 sq. ft.
715 Sweet Sage Lane, Spartanburg, SC 29302-4688
MLS# 337567Listed by: PONCE REALTY GROUP $180,000Active3 beds 2 baths1,740 sq. ft.
108 Barclay Downs Drive, Spartanburg, SC 29301
MLS# 337564Listed by: REAL BROKER, LLC $304,999Active5 beds 3 baths
1619 Chestnut Grove Way, Spartanburg, SC 29303
MLS# 1592894Listed by: LENNAR CAROLINAS LLC $345,900Active4 beds 3 baths2,279 sq. ft.
512 Brian Drive, Spartanburg, SC 29307
MLS# 337551Listed by: COLDWELL BANKER CAINE REAL EST $265,000Active3 beds 2 baths1,800 sq. ft.
1326 Hwy 56 Highway, Spartanburg, SC 29302
MLS# 337553Listed by: NEW HORIZON REALTY OSHIELDS RE $273,999Active5 beds 3 baths
241 Woven Wheel Drive, Clinton, SC 29325
MLS# 1592835Listed by: LENNAR CAROLINAS LLC $293,140Active3 beds 3 baths2,225 sq. ft.
1433 Harper Mae Drive, Spartanburg, SC 29303
MLS# 337534Listed by: SM SOUTH CAROLINA BROKERAGE, L $399,900Active3 beds 2 baths2,050 sq. ft.
225 Patch Drive, Spartanburg, SC 29302
MLS# 337536Listed by: LPT REALTY, LLC. $189,900Active3 beds 3 baths
639 Blossom Run Drive, Spartanburg, SC 29307
MLS# 1592817Listed by: EXP REALTY, LLC $275,000Active3 beds 2 baths2,487 sq. ft.
3855 Maid Marion Lane, Spartanburg, SC 29302
MLS# 337522Listed by: C 21 BLACKWELL & CO $220,000Pending3 beds 2 baths
189 Converse Circle, Spartanburg, SC 29302
MLS# 1592776Listed by: BHHS C DAN JOYNER - MIDTOWN $259,900Active4 beds 3 baths2,146 sq. ft.
3055 Huntington Drive, Spartanburg, SC 29302
MLS# 337520Listed by: KELLER WILLIAMS REALTY $407,000Active4 beds 3 baths
1026 Whitefox Drive #Lot 45, Spartanburg, SC 29307
MLS# 1592768Listed by: PULTE HOME COMPANY $371,810Active4 beds 4 baths
1345 Willow Ridge Way #Lot 41, Spartanburg, SC 29307
MLS# 1592769Listed by: PULTE HOME COMPANY $195,000Active3 beds 3 baths
565 Preakness Run, Spartanburg, SC 29301
MLS# 1592765Listed by: XSELL UPSTATE $189,900Active3 beds 2 baths1,248 sq. ft.
2004 Shalann Drive, Spartanburg, SC 29301
MLS# 337501Listed by: TRELORA REALTY, INC $184,900Active3 beds 2 baths1,248 sq. ft.
1875 Tamara Way, Spartanburg, SC 29301
MLS# 337503Listed by: TRELORA REALTY, INC $189,000Active2 beds 1 baths968 sq. ft.
173 S Cleveland Park Drive, Spartanburg, SC 29303
MLS# 337499Listed by: LPT REALTY, LLC. $315,000Pending2 beds 2 baths1,649 sq. ft.
144 W Hampton Avenue, Spartanburg, SC 29306
MLS# 337492Listed by: COLDWELL BANKER CAINE REAL EST $255,000Active3 beds 4 baths
136 W Corley Lane, Spartanburg, SC 29303-2647
MLS# 1592624Listed by: BAUER & HART $209,900Active3 beds 2 baths
207 South Carolina Avenue, Spartanburg, SC 29306
MLS# 1592652Listed by: KELLER WILLIAMS REALTY $304,990Active4 beds 3 baths2,376 sq. ft.
539 Tomlin Trail, Spartanburg, SC 29301
MLS# 337463Listed by: WJH LLC $99,900Active3 beds 1 baths840 sq. ft.
780 Wofford Street, Spartanburg, SC 29301
MLS# 337465Listed by: TRELORA REALTY, INC $159,900Active4 beds 1 baths1,212 sq. ft.
151 Princeton Street, Spartanburg, SC 29306
MLS# 337466Listed by: TRELORA REALTY, INC $185,000Active3 beds 1 baths945 sq. ft.
9 Jordan Street, Spartanburg, SC 29301
MLS# 337455Listed by: CENTURY 21 BLACKWELL & CO $249,900Active3 beds 2 baths1,736 sq. ft.
117 Woodbine Terrace, Spartanburg, SC 29301
MLS# 337460Listed by: BETTER HOMES & GARDENS YOUNG & $174,000Active3 beds 2 baths1,325 sq. ft.
106 Whitener Avenue, Spartanburg, SC 29306
MLS# 337462Listed by: TRELORA REALTY, INC $187,900Active2 beds 2 baths
366 W Pointe Drive, Spartanburg, SC 29301
MLS# 1592582Listed by: DELTA REAL ESTATE, LLC $159,999Active2 beds 1 baths900 sq. ft.
423 Spruce Street, Spartanburg, SC 29303
MLS# 337442Listed by: CENTURY 21 BLACKWELL & CO $219,777Active3 beds 2 baths1,252 sq. ft.
333 Old Petrie Road, Spartanburg, SC 29302
MLS# 337437Listed by: PONCE REALTY GROUP $293,999Active5 beds 3 baths
1611 Chestnut Grove Way, Spartanburg, SC 29303
MLS# 1592462Listed by: LENNAR CAROLINAS LLC $250,000Active4 beds 2 baths
235 S Blackstock Road, Spartanburg, SC 29301
MLS# 1592415Listed by: BHHS C DAN JOYNER - WOODRUFF RD $237,000Active3 beds 2 baths1,137 sq. ft.
127 Loblolly Drive, Spartanburg, SC 29303
MLS# 337373Listed by: CENTURY 21 BLACKWELL & CO $75,000Active0.34 Acres
213 S Carleila Lake Way, Spartanburg, SC 29307
MLS# 337370Listed by: COLDWELL BANKER CAINE REAL EST $429,000Active3 beds 3 baths2,632 sq. ft.
248 Greengate Lane, Spartanburg, SC 29307
MLS# 337366Listed by: ELLISON REAL ESTATE CO. LLC $90,000Active3 beds 1 baths2,272 sq. ft.
136 Oxford Road, SPARTANBURG, SC 29301
MLS# 337354Listed by: VALENTINE REALTY GROUP $84,900Pending3 beds 2 baths744 sq. ft.
241 Sunset Street, Spartanburg, SC 29307
MLS# 337356Listed by: KELLER WILLIAMS ON MAIN $189,900Active3 beds 2 baths1,248 sq. ft.
1852 Tamara Way, Spartanburg, SC 29301
MLS# 337360Listed by: TRELORA REALTY, INC $289,900Pending4 beds 3 baths2,345 sq. ft.
101 Milo Road, Spartanburg, SC 29306
MLS# 337359Listed by: MTH SC REALTY, LLC $220,000Active3 beds 3 baths1,121 sq. ft.
435 Promised Land Drive, Spartanburg, SC 29306
MLS# 337336Listed by: REAL BROKER, LLC $215,990Pending3 beds 3 baths
613 E Norvell Court, Spartanburg, SC 29307
MLS# 1592262Listed by: DRB GROUP SOUTH CAROLINA, LLC $149,000Active2 beds 2 baths
1462 Dover Road, Spartanburg, SC 29301
MLS# 1592277Listed by: KELLER WILLIAMS REALTY $260,000Active2 beds 2 baths
2333 Country Club Road, Spartanburg, SC 29302
MLS# 1592283Listed by: KELLER WILLIAMS GRV UPST $599,900Active4 beds 4 baths3,101 sq. ft.
14 Mockingbird Ct, Spartanburg, SC 29307
MLS# 337330Listed by: PACK AND COMPANY REAL ESTATE $270,000Active4 beds 2 baths1,572 sq. ft.
255 Hazelwood Avenue, Spartanburg, SC 29302
MLS# 337292Listed by: COLDWELL BANKER CAINE REAL EST $115,000Active3.05 Acres
00 Woodwind Drive, Spartanburg, SC 29302
MLS# 337298Listed by: OPEN HOUSE REALTY, LLC $179,900Active3 beds 2 baths1,368 sq. ft.
220 Woodview Ave, Spartanburg, SC 29306
MLS# 337282Listed by: TRELORA REALTY, INC $294,900Pending4 beds 3 baths
415 Upland Water Court, Spartanburg, SC 29301
MLS# 1592130Listed by: MTH SC REALTY, LLC $169,900Active3 beds 2 baths
281 Old Petrie Road, Spartanburg, SC 29302-6322
MLS# 1592133Listed by: CAROLINAS FULL SERVICE REALTY $310,000Active3 beds 2 baths1,648 sq. ft.
7003 Glass Court, Spartanburg, SC 29307-3870
MLS# 337235Listed by: BLUEFIELD REALTY GROUP $199,900Active3 beds 1 baths1,157 sq. ft.
218 Donavan Drive, Spartanburg, SC 29302
MLS# 337209Listed by: BRAND NAME REAL ESTATE UPSTATE $399,000Active4 beds 2 baths2,947 sq. ft.
255 Heathwood Drive, Spartanburg, SC 29307
MLS# 337204Listed by: CHOSEN REALTY LLC $474,900Active3 beds 3 baths
499 Lucas Court, Spartanburg, SC 29302
MLS# 1592020Listed by: NORTH GROUP REAL ESTATE $170,900Active3 beds 3 baths
101 Fernridge Drive, Spartanburg, SC 29307
MLS# 1591984Listed by: EXPERT REAL ESTATE TEAM $169,900Pending2 beds 2 baths
227 Emerald Way, Spartanburg, SC 29302
MLS# 1591963Listed by: KELLER WILLIAMS GREENVILLE CENTRAL $245,000Active2 beds 2 baths
4 Front Street, Spartanburg, SC 29301
MLS# 1591965Listed by: LESLIE HORNE AND ASSOCIATES $229,900Active4 beds 3 baths1,924 sq. ft.
110 Brandywine Ln Lane, Spartanburg, SC 29301
MLS# 337180Listed by: TRELORA REALTY, INC $199,900Active3 beds 2 baths1,723 sq. ft.
308 Willow Oaks Dr Drive, Spartanburg, SC 29301
MLS# 337184Listed by: TRELORA REALTY, INC $169,000Pending3 beds 2 baths1,617 sq. ft.
1 Forest Oaks Way, Spartanburg, SC 29307
MLS# 337155Listed by: PACK AND COMPANY REAL ESTATE $325,000Active4 beds 3 baths2,966 sq. ft.
263 Fairlane Drive, Spartanburg, SC 29307
MLS# 337168Listed by: EXPERT REAL ESTATE TEAM $95,000Active3 beds 1 baths1,305 sq. ft.
203 Brenton Avenue, Spartanburg, SC 29307
MLS# 337144Listed by: CENTURY 21 BLACKWELL & CO $239,000Active3 beds 2 baths1,350 sq. ft.
305 Appian Drive, Spartanburg, SC 29306
MLS# 337148Listed by: KELLER WILLIAMS GREENVILLE CENTRAL $240,000Active4 beds 3 baths
159 Woodhaven Drive, Spartanburg, SC 29307-1230
MLS# 1591785Listed by: KELLER WILLIAMS DRIVE $199,000Active-- beds -- baths1,930 sq. ft.
164 N Cleveland Park Dr Drive, Spartanburg, SC 29303
MLS# 337131Listed by: BELLE REALTY AND ASSOCIATES- Open Tue, 12 to 1pm
 $215,000Active3 beds 2 baths
438 N Forest Street, Spartanburg, SC 29303
MLS# 1591763Listed by: JPAR MAGNOLIA GROUP GREENVILLE  $198,000Active2 beds 2 baths1,656 sq. ft.
423 Carolina Dr, Spartanburg, SC 29306
MLS# 337114Listed by: THE COLEMAN COMPANY $225,000Pending3 beds 2 baths1,323 sq. ft.
317 Cole Street, Spartanburg, SC 29301
MLS# 337075Listed by: KELLER WILLIAMS REALTY $165,000Active2 beds 1 baths954 sq. ft.
750 Maywood Street, Spartanburg, SC 29303
MLS# 337076Listed by: KELLER WILLIAMS REALTY $219,900Pending3 beds 2 baths
836 Melton Avenue, Spartanburg, SC 29303
MLS# 1591472Listed by: CAROLINA MOVES, LLC $160,000Active3 beds 1 baths1,284 sq. ft.
127 Norris Court, Spartanburg, SC 29306
MLS# 337054Listed by: NORTHGROUP REAL ESTATE $340,000Pending4 beds 3 baths2,468 sq. ft.
711 Fernwood Dr Drive, Spartanburg, SC 29302
MLS# 337057Listed by: C 21 BLACKWELL & CO $199,900Active3 beds 3 baths
591 Preakness Run, Spartanburg, SC 29301
MLS# 1591440Listed by: XSELL UPSTATE $135,000Active2 beds 1 baths832 sq. ft.
945 S Irwin Avenue, Spartanburg, SC 29306
MLS# 337048Listed by: THE PROPERTY LOUNGE $395,000Active3 beds 3 baths
130 Roberts Meadow Loop, Spartanburg, SC 29307-3166
MLS# 1591378Listed by: NEXTHOME EXPERIENCE REALTY $219,000Pending3 beds 2 baths1,188 sq. ft.
301 E Myles Lane, Spartanburg, SC 29303-2369
MLS# 337007Listed by: PONCE REALTY GROUP $284,900Pending4 beds 3 baths1,934 sq. ft.
407 Upland Water Court, Spartanburg, SC 29301
MLS# 337019Listed by: MTH SC REALTY, LLC $274,500Active3 beds 2 baths1,972 sq. ft.
460 Ransdell Drive, Spartanburg, SC 29307
MLS# 336994Listed by: XSELL UPSTATE $89,000Active0 Acres
1321 Carolina Country Club Road, Spartanburg, SC 29302
MLS# 1591315Listed by: JACK PROPERTIES, LLC $239,900Active3 beds 2 baths1,584 sq. ft.
368 Fairlane Drive, Spartanburg, SC 29307
MLS# 336980Listed by: COLDWELL BANKER CAINE REAL EST $304,999Pending5 beds 3 baths
719 Coromandel Drive, Spartanburg, SC 29301
MLS# 1591238Listed by: LENNAR CAROLINAS LLC $185,900Active3 beds 2 baths1,100 sq. ft.
755 Kenmore Drive, Spartanburg, SC 29303
MLS# 336946Listed by: VALENCIA REAL ESTATE $179,000Pending3 beds 2 baths1,372 sq. ft.
2819 Cedar Springs Drive, Spartanburg, SC 29307
MLS# 336945Listed by: PONCE REALTY GROUP $106,000Active2 beds 2 baths
1462 Dover Road #Unit A, Spartanburg, SC 29301
MLS# 1591193Listed by: RE/MAX RESULTS SIMPSONVILLE $75,000Active0.14 Acres
266 Hydrick Street, Spartanburg, SC 29306
MLS# 336932Listed by: PONCE REALTY GROUP $255,000Active4 beds 3 baths
225 Cart Drive, Spartanburg, SC 29307
MLS# 1591149Listed by: REAL BROKER, LLC $390,000Pending3 beds 2 baths1,590 sq. ft.
712 Rutledge Street, Spartanburg, SC 29302
MLS# 336919Listed by: COLDWELL BANKER CAINE REAL EST $269,900Pending3 beds 2 baths
112 Whitener Avenue, Spartanburg, SC 29306
MLS# 1591034Listed by: BLUEFIELD REALTY GROUP $205,000Active2 beds 2 baths913 sq. ft.
151 Cloverfield Lane, Spartanburg, SC 29303
MLS# 336891Listed by: MUNGO HOMES PROPERTIES LLC GREENVILLE $550,000Active2 beds 3 baths
337 Caulder Avenue, Spartanburg, SC 29306
MLS# 1591030Listed by: KELLER WILLIAMS GRV UPST $204,500Active2 beds 2 baths913 sq. ft.
167 Cloverfield Lane, Spartanburg, SC 29303
MLS# 336885Listed by: MUNGO HOMES PROPERTIES LLC GREENVILLE $279,900Pending3 beds 2 baths1,468 sq. ft.
124 Terrace Road, Spartanburg, SC 29301
MLS# 336887Listed by: AFFINITY GROUP REALTY $135,000Pending2 beds 1 baths1,023 sq. ft.
556 Gadsden Court, Spartanburg, SC 29302
MLS# 336867Listed by: COLDWELL BANKER CAINE REAL EST $249,900Active3 beds 2 baths1,728 sq. ft.
343 Weblin Street, Spartanburg, SC 29306
MLS# 336872Listed by: COLDWELL BANKER CAINE REAL EST $215,000Active3 beds 2 baths1,288 sq. ft.
150 Evvalane Drive, Spartanburg, SC 29302
MLS# 336877Listed by: AFFINITY GROUP REALTY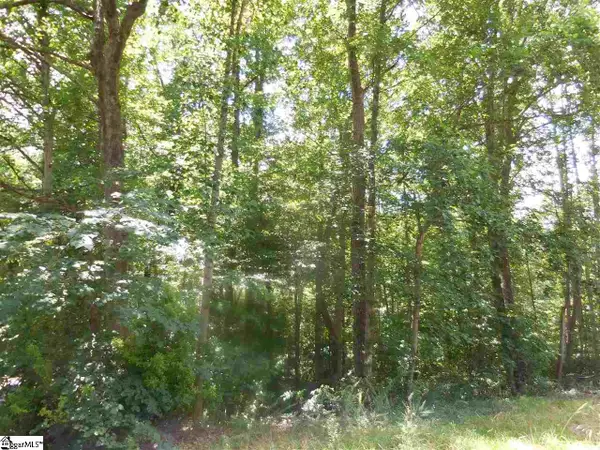 $67,200Active0 Acres
0 Heathwood Drive, Spartanburg, SC 29307
MLS# 1590954Listed by: TUDI HOLMES REALTY $14,000Pending0.9 Acres
0 Hammett Grove Road, Spartanburg, SC 29307
MLS# 336851Listed by: C 21 BLACKWELL & CO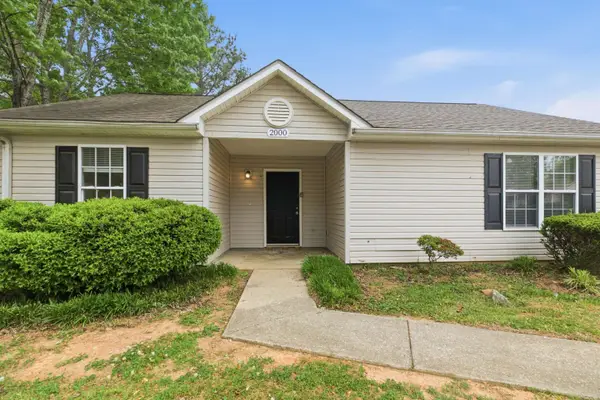 $184,900Active3 beds 2 baths1,248 sq. ft.
2000 Shalann Drive, Spartanburg, SC 29301
MLS# 336827Listed by: TRELORA REALTY, INC $169,900Active3 beds 2 baths1,269 sq. ft.
482 Carolyn Dr, Spartanburg, SC 29306
MLS# 336835Listed by: TRELORA REALTY, INC $222,290Active3 beds 3 baths
725 Camperdown Way, Spartanburg, SC 29301
MLS# 1590865Listed by: MCGUINN HOMES $220,000Active3 beds 3 baths
231 Keaton Court, Spartanburg, SC 29301
MLS# 1590839Listed by: REAL BROKER, LLC $150,000Active4 beds 2 baths1,152 sq. ft.
109 W Branyon Heights Avenue, Spartanburg, SC 29306
MLS# 336789Listed by: KELLER WILLIAMS REALTY $330,000Pending4 beds 3 baths2,240 sq. ft.
479 Ransdell Drive, Spartanburg, SC 29307-2431
MLS# 336772Listed by: EXP REALTY LLC $289,995Active3 beds 3 baths1,980 sq. ft.
102 N Lanford Road, Spartanburg, SC 29301
MLS# 336774Listed by: LINK BROKERAGES, SOUTH CAROLINA, LLC $114,900Active2 beds 2 baths1,068 sq. ft.
26 Hidden Springs Road, Spartanburg, SC 29302
MLS# 336746Listed by: EXP REALTY, LLC $209,487Active3 beds 3 baths
1328 Roadstead Lane #Lot 36, Spartanburg, SC 29306
MLS# 1583621Listed by: DFH REALTY GEORGIA, LLC $204,990Active3 beds 3 baths
1539 Dockage Way #Lot 103, Spartanburg, SC 29306
MLS# 1584796Listed by: DFH REALTY GEORGIA, LLC $196,290Active3 beds 3 baths
1111 Wharf Trail #Lot 2, Spartanburg, SC 29306
MLS# 1584797Listed by: DFH REALTY GEORGIA, LLC $199,537Active3 beds 3 baths
1542 Dockage Way #Lot 93, Spartanburg, SC 29306
MLS# 1584801Listed by: DFH REALTY GEORGIA, LLC $198,317Active3 beds 3 baths
1544 Dockage Way #Lot 94, Spartanburg, SC 29306
MLS# 1584802Listed by: DFH REALTY GEORGIA, LLC $198,992Active3 beds 3 baths
1548 Dockage Way #Lot 96, Spartanburg, SC 29306
MLS# 1584805Listed by: DFH REALTY GEORGIA, LLC $201,290Active3 beds 3 baths
1545 Dockage Way #Lot 100, Spartanburg, SC 29306
MLS# 1587820Listed by: DFH REALTY GEORGIA, LLC $209,000Active3 beds 2 baths1,237 sq. ft.
353 St Andrews Street, Spartanburg, SC 29306
MLS# 336724Listed by: KELLER WILLIAMS REALTY $249,999Pending3 beds 2 baths
934 Blue Willow Court, Spartanburg, SC 29302
MLS# 1590652Listed by: CAROLINA FOOTHILLS REAL ESTATE $305,000Active3 beds 2 baths1,633 sq. ft.
537 Barnwell Road, Spartanburg, SC 29303
MLS# 336698Listed by: KELLER WILLIAMS REALTY $167,000Pending3 beds 1 baths
388 Vanderbilt Road, Spartanburg, SC 29301
MLS# 1590570Listed by: FLYNN REALTY $1,295,000Active5 beds 6 baths4,249 sq. ft.
128 Edgecombe Road, Spartanburg, SC 29307
MLS# 336683Listed by: KELLER WILLIAMS REALTY $190,000Pending2 beds 2 baths1,152 sq. ft.
502 W Calhoun Crossing Court, Spartanburg, SC 29307
MLS# 336688Listed by: COLDWELL BANKER CAINE REAL EST $120,000Active3 beds 2 baths1,168 sq. ft.
242 Woodlawn Avenue, Spartanburg, SC 29306
MLS# 336691Listed by: KELLER WILLIAMS REALTY $209,900Pending3 beds 1 baths1,092 sq. ft.
137 Hamilton Avenue, Spartanburg, SC 29302
MLS# 336693Listed by: COLDWELL BANKER CAINE REAL EST $179,900Active3 beds 3 baths
641 Blossom Run Drive, Spartanburg, SC 29307-2
MLS# 1590523Listed by: EXP REALTY, LLC $259,900Active3 beds 2 baths1,800 sq. ft.
7110 Cotton Owens Drive, Spartanburg, SC 29303
MLS# 336675Listed by: KELLER WILLIAMS ON MAIN $212,990Active3 beds 3 baths1,600 sq. ft.
502 W Norvell Court, Spartanburg, SC 29307
MLS# 336676Listed by: DRB GROUP SOUTH CAROLINA, LLC $212,990Active3 beds 3 baths1,587 sq. ft.
601 E Norvell Court, Spartanburg, SC 29307
MLS# 336678Listed by: DRB GROUP SOUTH CAROLINA, LLC $315,000Active4 beds 1 baths1,993 sq. ft.
364 Palmer Street, Spartanburg, SC 29302
MLS# 336680Listed by: COLDWELL BANKER CAINE REAL EST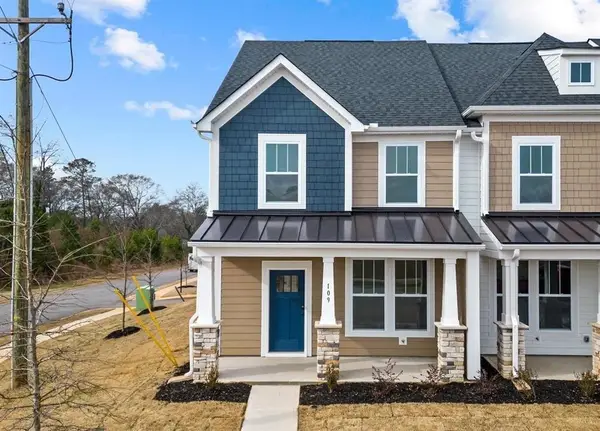 $209,900Active3 beds 3 baths1,483 sq. ft.
109 Dalmatian Drive, Spartanburg, SC 29307
MLS# 336665Listed by: BHHS C DAN JOYNER - SPTBG $1,275,000Active4 beds 4 baths3,700 sq. ft.
110 Rosewood Lane, Spartanburg, SC 29302
MLS# 336660Listed by: COLDWELL BANKER CAINE REAL EST $274,995Active4 beds 3 baths
1429 Harper Mae Drive, Spartanburg, SC 29303
MLS# 1590451Listed by: SM SOUTH CAROLINA BROKERAGE, L $549,900Pending3 beds 3 baths2,785 sq. ft.
492 Webber Road, Spartanburg, SC 29307
MLS# 336628Listed by: KELLER WILLIAMS REALTY $1,500,000Active5 beds 3 baths3,293 sq. ft.
130 S Blackstock Road, Spartanburg, SC 29301
MLS# 336609Listed by: COLDWELL BANKER CAINE REAL EST $239,000Pending3 beds 2 baths1,516 sq. ft.
103 Windy Rush Road, Spartanburg, SC 29301
MLS# 336599Listed by: REAL BROKER, LLC $475,000Active4 beds 3 baths2,835 sq. ft.
202 Coburn Drive, Spartanburg, SC 29302
MLS# 336588Listed by: COLDWELL BANKER CAINE REAL EST $239,900Active3 beds 2 baths1,992 sq. ft.
180 Gordon Drive, Spartanburg, SC 29301
MLS# 336589Listed by: COLDWELL BANKER CAINE REAL EST $319,900Pending4 beds 3 baths2,300 sq. ft.
1111 Edisto Drive, Spartanburg, SC 29302
MLS# 633038Listed by: TRELORA REALTY INC $184,900Active3 beds 2 baths1,248 sq. ft.
526 Lavendula Street, Spartanburg, SC 29301
MLS# 633043Listed by: TRELORA REALTY INC $229,000Active3 beds 2 baths
106 Meadowinds Drive, Spartanburg, SC 29306
MLS# 1590241Listed by: REAL BROKER, LLC $215,000Active3 beds 2 baths1,360 sq. ft.
137 Whittier Place, Spartanburg, SC 29303
MLS# 336577Listed by: EXP REALTY LLC $265,000Active3 beds 2 baths1,463 sq. ft.
165 Jewell Road, Spartanburg, SC 29302
MLS# 336554Listed by: REALTY ONE GROUP FREEDOM $240,000Active3 beds 2 baths1,446 sq. ft.
9 Forest Mill Street, Spartanburg, SC 29301
MLS# 336511Listed by: KELLER WILLIAMS GREENVILLE CENTRAL $219,900Active3 beds 3 baths1,689 sq. ft.
128 Granger Road, Spartanburg, SC 29306
MLS# 336543Listed by: COLDWELL BANKER CAINE REAL EST $129,900Pending2 beds 2 baths1,053 sq. ft.
118 Mistybrook Drive, Spartanburg, SC 29302
MLS# 336546Listed by: COLDWELL BANKER CAINE REAL EST $250,000Active4 beds 4 baths1,702 sq. ft.
124 Bonner Road, Spartanburg, SC 29303
MLS# 1590112Listed by: FATHOM REALTY - WOODRUFF RD. $394,999Pending9 beds 9 baths3,999 sq. ft.
255-257 Vanderbilt Road, Spartanburg, SC 29301
MLS# 1590096Listed by: SUCCESS PROPERTIES, LLC $684,900Active4 beds 3 baths3,146 sq. ft.
3044 Akins Street, Spartanburg, SC 29303
MLS# 336384Listed by: ACCESS REALTY $234,900Active3 beds 3 baths
476 Mill Park Way, Spartanburg, SC 29307
MLS# 1590015Listed by: QUARTERMASTER PROPERTIES LLC $245,000Active2 beds 2 baths1,750 sq. ft.
4 Front Street, Spartanburg, SC 29301
MLS# 336508Listed by: LESLIE HORNE AND ASSOCIATES $394,999Pending-- beds -- baths2,662 sq. ft.
259-261 Vanderbilt Road, Spartanburg, SC 29301
MLS# 336510Listed by: KELLER WILLIAMS GREENVILLE CENTRAL $400,000Active4 beds 3 baths2,128 sq. ft.
353 Round Ridge Road, Spartanburg, SC 29302
MLS# 336512Listed by: KELLER WILLIAMS REALTY $206,990Active3 beds 3 baths
517 W Norvell Court, Spartanburg, SC 29307
MLS# 1589965Listed by: DRB GROUP SOUTH CAROLINA, LLC $224,290Active3 beds 3 baths
729 Camperdown Way, Spartanburg, SC 29301
MLS# 1589922Listed by: MCGUINN HOMES $259,000Active3 beds 3 baths1,440 sq. ft.
306 Manning St, Spartanburg, SC 29303
MLS# 336498Listed by: EZELL PROPERTIES REALTY $199,000Active3 beds 2 baths1,800 sq. ft.
445 Arch Street, Spartanburg, SC 29301
MLS# 336479Listed by: COLDWELL BANKER CAINE REAL EST $260,000Active3 beds 2 baths1,263 sq. ft.
367 College Street, spartanburg, SC 29303
MLS# 336471Listed by: SUCCESS PROPERTIES, LLC $429,900Active4 beds 3 baths2,149 sq. ft.
176 Rudisal Street, Spartanburg, SC 29302
MLS# 336455Listed by: BLACKSTOCK REALTY, LLC $135,000Active2 beds 1 baths932 sq. ft.
778 Camp St, Spartanburg, SC 29303
MLS# 336456Listed by: KELLER WILLIAMS REALTY $1,100,000Active3 beds 3 baths2,850 sq. ft.
363 Connecticut Avenue, Spartanburg, SC 29302
MLS# 336438Listed by: COLDWELL BANKER CAINE REAL EST $280,000Active3 beds 2 baths2,059 sq. ft.
2221 Avondale Drive, Spartanburg, SC 29302-5064
MLS# 336415Listed by: PONCE REALTY GROUP $224,990Active3 beds 3 baths1,587 sq. ft.
507 E Parima Court, Spartanburg, SC 29301
MLS# 336416Listed by: DRB GROUP SOUTH CAROLINA, LLC $208,990Active3 beds 3 baths1,587 sq. ft.
505 E Parima Court, Spartanburg, SC 29301
MLS# 336417Listed by: DRB GROUP SOUTH CAROLINA, LLC $239,000Pending3 beds 2 baths1,700 sq. ft.
119 Shannon Street, Spartanburg, SC 29307
MLS# 336419Listed by: CENTURY 21 BLACKWELL & CO $232,000Active3 beds 2 baths1,312 sq. ft.
175 Aden St., Spartanburg, SC 29303
MLS# 336410Listed by: BETTER HOMES & GARDENS YOUNG & $20,000Active0 Acres
00 Ansel Street, Spartanburg, SC 29306
MLS# 1589696Listed by: WATERSHED GVL, LLC $239,000Active4 beds 3 baths
152 Evvalane Drive, Spartanburg, SC 29302
MLS# 1589648Listed by: CAROLINA MOVES, LLC $199,900Pending3 beds 1 baths1,373 sq. ft.
315 Briarwood Road, Spartanburg, SC 29301
MLS# 336372Listed by: ELLISON REAL ESTATE CO. LLC $464,500Active4 beds 3 baths3,446 sq. ft.
103 Pinetree Circle, Spartanburg, SC 29307
MLS# 336373Listed by: COLDWELL BANKER CAINE REAL EST $150,000Active4.07 Acres
0 Front Street, Spartanburg, SC 29301
MLS# 336378Listed by: COLDWELL BANKER CAINE REAL EST $199,900Pending3 beds 1 baths
315 Briarwood Road #lot B/5, Spartanburg, SC 29301
MLS# 1589617Listed by: ELLISON REAL ESTATE COMPANY, LLC $449,000Active4 beds 3 baths3,137 sq. ft.
204 Fernbrook Circle, Spartanburg, SC 29307
MLS# 336344Listed by: PACK AND COMPANY REAL ESTATE $224,900Active4 beds 3 baths1,493 sq. ft.
5 Williams Street, Spartanburg, SC 29301
MLS# 336346Listed by: THE ROSALES GROUP@KW $189,900Active3 beds 1 baths1,236 sq. ft.
112 Applewood Lane, Spartanburg, SC 29307
MLS# 632440Listed by: TRELORA REALTY INC $134,900Active2 beds 1 baths944 sq. ft.
762 N Liberty Lane, Spartanburg, SC 29303
MLS# 632418Listed by: TRELORA REALTY INC $179,800Active3 beds 1 baths960 sq. ft.
162 Lincoln Drive, Spartanburg, SC 29306
MLS# 336313Listed by: REEDY PROPERTY GROUP, LLC - RESIDENTIAL $199,000Active-- beds -- baths1,500 sq. ft.
211 California Avenue, Spartanburg, SC 29303
MLS# 336300Listed by: NORTHGROUP REAL ESTATE $249,900Active3 beds 2 baths
220 N Landford Street, Spartanburg, SC 29301
MLS# 1589206Listed by: KELLER WILLIAMS REALTY $299,000Active-- beds -- baths
117 Tanglewylde Drive, Spartanburg, SC 29301
MLS# 336272Listed by: KELLER WILLIAMS REALTY $99,900Pending3 beds 1 baths840 sq. ft.
788 Wofford Street, Spartanburg, SC 29301
MLS# 632347Listed by: TRELORA REALTY INC $94,900Active3 beds 1 baths840 sq. ft.
796 Wofford Street, Spartanburg, SC 29301
MLS# 632349Listed by: TRELORA REALTY INC $179,900Active3 beds 2 baths1,248 sq. ft.
1860 Tamara Way, Spartanburg, SC 29301
MLS# 632350Listed by: TRELORA REALTY INC $684,900Active4 beds 3 baths
3044 Akins Street #Lot 40, Spartanburg, SC 29303
MLS# 1589288Listed by: ACCESS REALTY, LLC $399,000Active2 beds 1 baths1,576 sq. ft.
413 Spruce Street, Spartanburg, SC 29303-3937
MLS# 336248Listed by: NEXTHOME EXPERIENCE REALTY $614,900Active4 beds 4 baths
1401 Fernwood Glendale Road, Spartanburg, SC 29307
MLS# 1589260Listed by: FLYNN REALTY $249,900Active3 beds 2 baths1,503 sq. ft.
220 N Lanford Street, Spartanburg, SC 29301
MLS# 336218Listed by: KELLER WILLIAMS REALTY $209,900Active2 beds 2 baths1,001 sq. ft.
119 Brixton Court, Spartanburg, SC 29301
MLS# 336234Listed by: KELLER WILLIAMS REALTY $255,000Active3 beds 2 baths
1095 Longstone Way, Spartanburg, SC 29306-7101
MLS# 1589191Listed by: LIVING DOWN SOUTH REALTY $169,900Active3 beds 1 baths1,040 sq. ft.
116 Fisher Avenue, Spartanburg, SC 29301
MLS# 336214Listed by: GILLIAM REALTY GROUP $218,000Active4 beds 3 baths1,560 sq. ft.
207 Dalmatian Drive, Spartanburg, SC 29307-1089
MLS# 336206Listed by: EPIQUE INC. $269,900Pending3 beds 2 baths1,375 sq. ft.
1646 Old Charlotte Road, Spartanburg, SC 29307
MLS# 336204Listed by: KELLER WILLIAMS ON MAIN $168,700Active3 beds 1 baths1,074 sq. ft.
107 Whitener Avenue, Spartanburg, SC 29306
MLS# 336168Listed by: THE GALLO COMPANY $206,990Pending3 beds 3 baths
537 W Norvell Court, Spartanburg, SC 29307
MLS# 1589068Listed by: DRB GROUP SOUTH CAROLINA, LLC $102,500Active2 beds 1 baths
584 Wildwood Drive, Spartanburg, SC 29306-4054
MLS# 1588993Listed by: REEDY PROPERTY GROUP, LLC - COMMERCIAL $175,000Pending3 beds 1 baths1,092 sq. ft.
802 S Liberty Street, Spartanburg, SC 29306
MLS# 336134Listed by: REAL BROKER, LLC $349,999Active3 beds 2 baths
193 W Wood Street, Spartanburg, SC 29303
MLS# 1588926Listed by: NORTH GROUP REAL ESTATE $400,000Active0.79 Acres
9081 Fairforest Road, Spartanburg, SC 29301
MLS# 336123Listed by: ORCHARD & RAIL REALTY, LLC $269,990Active4 beds 3 baths1,980 sq. ft.
357 Dermont, Spartanburg, SC 29303
MLS# 336121Listed by: NEXTHOME EXPERIENCE REALTY $253,999Active4 beds 3 baths1,955 sq. ft.
1620 Chestnut Grove Way, Spartanburg, SC 29303
MLS# 336100Listed by: LENNAR CAROLINAS, LLC $275,000Active4 beds 2 baths2,060 sq. ft.
125 Thunderbird Place, Spartanburg, SC 29307
MLS# 336106Listed by: COLDWELL BANKER CAINE REAL EST $304,900Active4 beds 3 baths2,674 sq. ft.
100 Martel Drive, Spartanburg, SC 29306
MLS# 336095Listed by: KELLER WILLIAMS ON MAIN $85,000Active0.56 Acres
172 Annie St, Spartanburg, SC 29302
MLS# 336096Listed by: PACK AND COMPANY REAL ESTATE $308,000Active3 beds 2 baths1,913 sq. ft.
137 Henson St, Spartanburg, SC 29307
MLS# 336097Listed by: PREMIER REAL ESTATE LLC $229,900Active3 beds 3 baths1,628 sq. ft.
224 Keaton Court, Spartanburg, SC 29301
MLS# 336092Listed by: KELLER WILLIAMS REALTY $174,500Active2 beds 1 baths980 sq. ft.
726 Maywood Street, Spartanburg, SC 29303
MLS# 336082Listed by: KELLER WILLIAMS REALTY $249,900Active3 beds 2 baths1,527 sq. ft.
134 N High Point Road, Spartanburg, SC 29301
MLS# 336080Listed by: QUARTERMASTER PROPERTIES LLC $180,000Active3 beds 2 baths
795 Howard Street, Spartanburg, SC 29303
MLS# 1588799Listed by: SIRIUS REALTY, LLC $184,900Pending3 beds 2 baths1,280 sq. ft.
284 S Converse, Spartanburg, SC 29306
MLS# 631916Listed by: TRELORA REALTY INC $184,900Pending3 beds 2 baths1,248 sq. ft.
1884 Tamara Way, Spartanburg, SC 29301
MLS# 631917Listed by: TRELORA REALTY INC $159,900Active3 beds 1 baths1,075 sq. ft.
127 Celestial Street, Spartanburg, SC 29306
MLS# 631892Listed by: TRELORA REALTY INC $204,900Pending3 beds 2 baths1,248 sq. ft.
506 Lavendula Street, Spartanburg, SC 29301
MLS# 631898Listed by: TRELORA REALTY INC $299,999Pending5 beds 3 baths2,307 sq. ft.
716 Coromandel Drive, Spartanburg, SC 29301
MLS# 336048Listed by: LENNAR CAROLINAS, LLC $385,000Active3 beds 3 baths2,227 sq. ft.
205 Wadsworth Road, Spartanburg, SC 29301
MLS# 336040Listed by: SHULIKOV REALTY & ASSOCIATES $199,900Active3 beds 2 baths1,659 sq. ft.
118 Kensington Drive, Spartanburg, SC 29306
MLS# 336019Listed by: BETTER HOMES & GARDENS YOUNG & $235,000Active1 beds 1 baths750 sq. ft.
155 E Broad Street, Spartanburg, SC 29306-3284
MLS# 336011Listed by: KELLER WILLIAMS REALTY $235,000Active1 beds 1 baths
155 E Broad Street #Apt 208, Spartanburg, SC 29306-3284
MLS# 1588598Listed by: KELLER WILLIAMS REALTY $389,000Pending3 beds 3 baths2,777 sq. ft.
508 Fernwood Drive, Spartanburg, SC 29307
MLS# 336003Listed by: NORTHGROUP REAL ESTATE $497,500Active4 beds 4 baths2,797 sq. ft.
212 Roberts Meadow Loop, Spartanburg, SC 29307
MLS# 335961Listed by: COLDWELL BANKER CAINE REAL EST $239,900Active3 beds 2 baths
234 Greencreek Drive, Spartanburg, SC 29301-2506
MLS# 1588406Listed by: REGION SOUTH REALTY, LLC $149,000Active2 beds 2 baths
85 Forest Oaks Way, Spartanburg, SC 29307
MLS# 1588287Listed by: KELLER WILLIAMS REALTY $175,000Active2 beds 1 baths905 sq. ft.
228 Grandview Drive, Spartanburg, SC 29303
MLS# 335907Listed by: REEDY PROPERTY GROUP, LLC - RESIDENTIAL $215,000Pending3 beds 2 baths
572 Wildwood Drive, Spartanburg, SC 29306
MLS# 1588176Listed by: EPIQUE REALTY INC $180,000Active3 beds 1 baths1,405 sq. ft.
117 Lincoln Drive, Spartanburg, SC 29306
MLS# 335885Listed by: BLUEFIELD REALTY GROUP $45,000Active0.36 Acres
111 W Victoria Road, Spartanburg, SC 29301-3030
MLS# 335878Listed by: SUMMEY & MCKILLOP REALTY, LLC $49,000Active0.15 Acres
330 Northview Street, Spartanburg, SC 29302-1173
MLS# 335870Listed by: SUMMEY & MCKILLOP REALTY, LLC $230,000Active3 beds 3 baths1,790 sq. ft.
200 Yorkshire Drive, Spartanburg, SC 29301-1316
MLS# 335855Listed by: REDFIN CORPORATION $282,900Pending4 beds 3 baths
616 Starbeam Court, Spartanburg, SC 29303
MLS# 1588050Listed by: D.R. HORTON $239,900Pending3 beds 2 baths1,801 sq. ft.
234 Greencreek Drive, Spartanburg, SC 29301-2506
MLS# 335846Listed by: REGION SOUTH REALTY, LLC- Open Mon, 11am to 5pm
 $284,745Active4 beds 3 baths2,015 sq. ft.
1122 Ogeechee Court, Spartanburg, SC 29303
MLS# 335829Listed by: VERANDA HOMES, LLC  $599,900Active4 beds 4 baths3,569 sq. ft.
640 Crystal Drive, Spartanburg, SC 29302
MLS# 335832Listed by: KELLER WILLIAMS ON MAIN $184,979Active3 beds 2 baths
306 Spruce Street, Spartanburg, SC 29303-3936
MLS# 1587956Listed by: SPARTAN REALTY INC. $387,660Active5 beds 3 baths
1320 Capefox Drive #Lot 182, Spartanburg, SC 29303
MLS# 1587932Listed by: PULTE HOME COMPANY $387,660Active5 beds 3 baths2,659 sq. ft.
1320 Capefox Drive, Spartanburg, SC 29303
MLS# 335800Listed by: PULTE HOME COMPANY, LLC $369,999Active3 beds 3 baths2,626 sq. ft.
2019 Sousa Court, Spartanburg, SC 29307
MLS# 335783Listed by: BETTER HOMES & GARDENS YOUNG & $324,926Active4 beds 3 baths
224 Merriweather Way, Spartanburg, SC 29302
MLS# 1587895Listed by: BLACKSTREAM INTERNATIONAL RE $199,000Pending2 beds 1 baths
137 S Cleveland Park Drive, Spartanburg, SC 29303
MLS# 1587856Listed by: REAL BROKER, LLC $216,000Pending3 beds 2 baths
266 West Avenue, Spartanburg, SC 29301
MLS# 1587833Listed by: NORTH GROUP REAL ESTATE $196,990Pending3 beds 3 baths1,417 sq. ft.
1030 Cargo Drive, Spartanburg, SC 29306
MLS# 335752Listed by: DFH REALTY GEORGIA, LLC $201,290Pending3 beds 3 baths1,417 sq. ft.
1541 Dockage Way, Spartanburg, SC 29306
MLS# 335753Listed by: DFH REALTY GEORGIA, LLC $212,500Pending3 beds 2 baths
640 Olivia Springs Drive, Spartanburg, SC 29302
MLS# 1587783Listed by: CENTURY 21 BLACKWELL & CO. REA
Local realty services provided by:CENTURY 21 Triangle Group, CENTURY 21 The Harrelson Group, CENTURY 21 Town & Country Realty, CENTURY 21 803
Listings courtesy of Canopy MLS as distributed by MLS GRID. Copyright 2021 Canopy MLS. All rights reserved. Canopy MLS, provides content displayed here (“provided content”) on an “as is” basis and makes no representations or warranties regarding the provided content, including, but not limited to those of non-infringement, timeliness, accuracy, or completeness. Individuals and companies using information presented are responsible for verification and validation of information they utilize and present to their customers and clients. Canopy MLS will not be liable for any damage or loss resulting from use of the provided content or the products available through Portals, IDX, VOW, and/or Syndication. Recipients of this information shall not resell, redistribute, reproduce, modify, or otherwise copy any portion thereof without the expressed written consent of Canopy MLS. CH Member Broker: Janice Peeler
Last Updated: June 6, 2026 The data relating to real estate on this Web site derive in part from the Carolina Multiple Listing Services, Inc. IDX program. Brokers make an effort to deliver accurate information, but buyers should independently verify any information on which they will rely in a transaction. All properties are subject to prior sale, change or withdrawal. Neither CENTURY 21 803nor any listing broker shall be responsible for any typographical errors, misinformation, or misprints, and they shall be held totally harmless from any damages arising from reliance upon this data. This data is provided exclusively for consumers' personal, non-commercial use and may not be used for any purpose other than to identify prospective properties they may be interested in purchasing. Copyright 2026 Carolina Multiple Listing Services, Inc.
Neighborhoods near Spartanburg, SC
Zip codes near Spartanburg, SC
- 29301 homes for sale
- 29302 homes for sale
- 29303 homes for sale
- 29306 homes for sale
- 29307 homes for sale
- 29316 homes for sale
- 29320 homes for sale
- 29323 homes for sale
- 29330 homes for sale
- 29333 homes for sale
- 29334 homes for sale
- 29349 homes for sale
- 29365 homes for sale
- 29369 homes for sale
- 29372 homes for sale
- 29374 homes for sale
- 29375 homes for sale
- 29376 homes for sale
- 29385 homes for sale
- 29388 homes for sale
Popular searches near Spartanburg, SC
- Arcadia homes for sale
- Arkwright homes for sale
- Ben Avon homes for sale
- Boiling Springs homes for sale
- Camp Croft homes for sale
- Clifton homes for sale
- Converse homes for sale
- Drayton homes for sale
- Fairforest homes for sale
- Fairmont Mills homes for sale
- Glendale homes for sale
- Hilltop homes for sale
- Moore homes for sale
- Pacolet homes for sale
- Pauline homes for sale
- Roebuck homes for sale
- Saxon homes for sale
- Southern Shops homes for sale
- Valley Falls homes for sale
- Whitney homes for sale
Protect your home and budget from life's surprises with an Assurant Home Warranty, backed by a partner that supports you through every step of homeownership. Explore Plans.
©2026 Century 21 Real Estate LLC. All rights reserved. CENTURY 21®, the CENTURY 21 Logo and C21® are service marks owned by Century 21 Real Estate LLC. Century 21 Real Estate LLC fully supports the principles of the Fair Housing Act and the Equal Opportunity Act. Each office is independently owned and operated. Listing information is deemed reliable but not guaranteed accurate.