- Abington, Abington homes for sale
- Ambler, Ambler homes for sale
- Blue Bell Country Club, Blue Bell homes for sale
- Brittany Farms, Chalfont homes for sale
- Colonial Manor, Hatboro homes for sale
- Flourtown, Flourtown homes for sale
- Glen View Park, Warminster homes for sale
- Glenside, Glenside homes for sale
- Hartsville Park, Warminster homes for sale
- Oreland, Oreland homes for sale
- Pinecrest Golf Club, Lansdale homes for sale
- Sawmill Valley, Horsham homes for sale
- Speedway, Warminster homes for sale
- The Villages at Gwynedd Pointe, North Wales homes for sale
- Towamencin Village, Harleysville homes for sale
- Upper Dublin, Dresher homes for sale
- Warminster Heights, Warminster homes for sale
- Warrington Hunt, Chalfont homes for sale
- Willow Grove, Willow Grove homes for sale
- Wyndmoor, Glenside homes for sale
Spring House, PA - homes for sale
22 of 22 results displayed
- Open Sun, 10am to 1pmNew
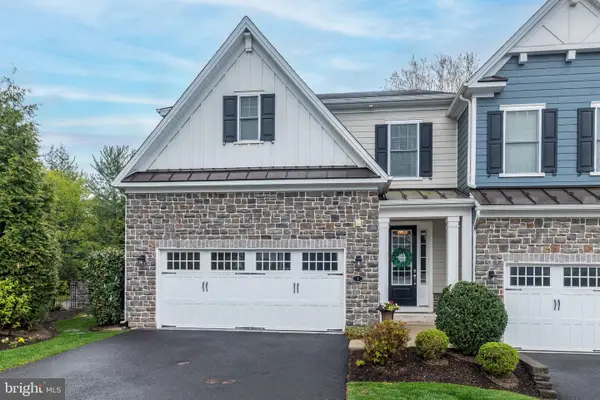
 $590,000Active3 beds 3 baths2,197 sq. ft.
284 Conway Cir, LOWER GWYNEDD, PA 19002
MLS# PAMC2182396Listed by: TESLA REALTY GROUP, LLC - New
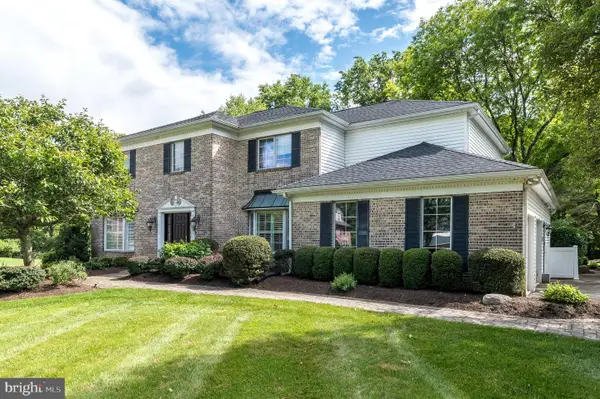
 $899,900Active4 beds 2 baths3,466 sq. ft.
713 Alene Rd, AMBLER, PA 19002
MLS# PAMC2182324Listed by: BHHS FOX & ROACH-BLUE BELL - Coming Soon
 $525,000Coming Soon2 beds 3 baths
227 Towyn Ct, AMBLER, PA 19002
MLS# PAMC2180996Listed by: COLDWELL BANKER REALTY - Coming SoonOpen Sun, 2 to 4pm
 $1,474,900Coming Soon4 beds 4 baths
1200 Severen Ct, AMBLER, PA 19002
MLS# PAMC2181098Listed by: BHHS FOX & ROACH THE HARPER AT RITTENHOUSE SQUARE - New
 $949,000Active3 beds 4 baths3,571 sq. ft.
1 White Field Ct, LOWER GWYNEDD, PA 19002
MLS# PAMC2181604Listed by: HOWARD HANNA REAL ESTATE SERVICES - Open Sun, 1 to 3pmNew
 $1,185,000Active4 beds 3 baths4,126 sq. ft.
34 Austin Cir, LOWER GWYNEDD, PA 19002
MLS# PAMC2181306Listed by: BHHS FOX & ROACH-BLUE BELL 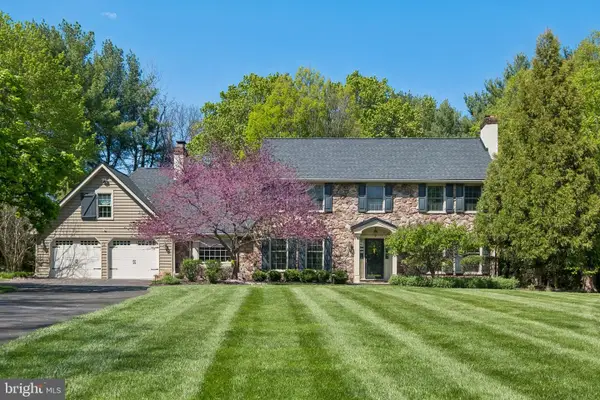 $1,190,000Pending4 beds 3 baths4,180 sq. ft.
2 Hedgerow Dr, SPRING HOUSE, PA 19477
MLS# PAMC2178362Listed by: BHHS FOX & ROACH-BLUE BELL- Open Sat, 2 to 4pm
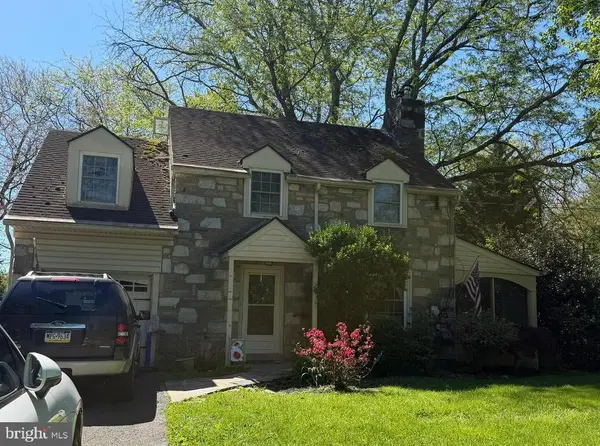 $400,000Active3 beds 1 baths1,413 sq. ft.
724 Johns Ln, AMBLER, PA 19002
MLS# PAMC2179444Listed by: KELLER WILLIAMS REAL ESTATE-BLUE BELL  $1,699,900Pending5 beds 5 baths5,499 sq. ft.
1234 Forest Hill Dr, AMBLER, PA 19002
MLS# PAMC2180388Listed by: BHHS FOX & ROACH-CHESTNUT HILL $3,750,000Active6 beds 6 baths8,506 sq. ft.
950 Pennbrooke Ln #, LOWER GWYNEDD, PA 19002
MLS# PAMC2180254Listed by: NORTHPOINT REAL ESTATE $899,900Pending4 beds 2 baths3,466 sq. ft.
713 Alene Rd, AMBLER, PA 19002
MLS# PAMC2178386Listed by: BHHS FOX & ROACH-BLUE BELL $1,299,000Pending4 beds 5 baths4,660 sq. ft.
1260 Fairland Dr, AMBLER, PA 19002
MLS# PAMC2179386Listed by: COLDWELL BANKER REALTY $765,000Pending3 beds 3 baths2,424 sq. ft.
1241 Carnigan Ct, AMBLER, PA 19002
MLS# PAMC2177468Listed by: HOFFMAN REALTY GROUP LLC $595,000Active3 beds 3 baths2,093 sq. ft.
61 Harlow Cir, LOWER GWYNEDD, PA 19002
MLS# PAMC2176710Listed by: COMPASS PENNSYLVANIA, LLC $1,650,000Pending5 beds 5 baths6,126 sq. ft.
820 Foxfield Rd, AMBLER, PA 19002
MLS# PAMC2170928Listed by: COLDWELL BANKER REALTY $899,900Pending4 beds 3 baths2,682 sq. ft.
908 Judie Ln, AMBLER, PA 19002
MLS# PAMC2167016Listed by: COLDWELL BANKER REALTY $629,000Pending3 beds 3 baths1,883 sq. ft.
721 Locust Ln, AMBLER, PA 19002
MLS# PAMC2171362Listed by: KW EMPOWER $1,600,000Active5 beds 7 baths7,440 sq. ft.
839 Foxfield Rd, AMBLER, PA 19002
MLS# PAMC2169962Listed by: KELLER WILLIAMS REAL ESTATE-BLUE BELL $1,750,000Active3 beds 4 baths3,840 sq. ft.
10 Richards Way, AMBLER, PA 19002
MLS# PAMC2169426Listed by: HOMESTARR REALTY $770,000Pending3 beds 4 baths3,185 sq. ft.
1635 Sloan Way, AMBLER, PA 19002
MLS# PAMC2168954Listed by: REDFIN CORPORATION $2,751,633Pending6 beds 6 baths6,655 sq. ft.
774 Johns Ln, AMBLER, PA 19002
MLS# PAMC2154618Listed by: ELITE REALTY GROUP UNL. INC. $2,224,800Pending5 beds 5 baths
Johns Ln #emerson Elite, LOWER GWYNEDD, PA 19002
MLS# PAMC2154654Listed by: ELITE REALTY GROUP UNL. INC.
Local realty services provided by:CENTURY 21 A Better Way
Neighborhoods near Spring House, PA
Zip codes near Spring House, PA
- 18914 homes for sale
- 18915 homes for sale
- 18976 homes for sale
- 19001 homes for sale
- 19002 homes for sale
- 19025 homes for sale
- 19031 homes for sale
- 19034 homes for sale
- 19038 homes for sale
- 19040 homes for sale
- 19044 homes for sale
- 19075 homes for sale
- 19090 homes for sale
- 19401 homes for sale
- 19422 homes for sale
- 19437 homes for sale
- 19446 homes for sale
- 19454 homes for sale
- 19462 homes for sale
- 19490 homes for sale
Popular searches near Spring House, PA
- Ambler homes for sale
- Blue Bell homes for sale
- Brittany Farms-The Highlands homes for sale
- Dresher homes for sale
- Flourtown homes for sale
- Fort Washington homes for sale
- Gwynedd Valley homes for sale
- Horsham Township homes for sale
- Horsham homes for sale
- Lansdale homes for sale
- Lower Gwynedd Township homes for sale
- Maple Glen homes for sale
- Montgomery homes for sale
- Montgomeryville homes for sale
- North Wales homes for sale
- Oreland homes for sale
- Upper Dublin homes for sale
- Upper Gwynedd homes for sale
- Warrington Township homes for sale
- Whitpain homes for sale
Protect your home and budget from life's surprises with an Assurant Home Warranty, backed by a partner that supports you through every step of homeownership. Explore Plans.
©2026 Century 21 Real Estate LLC. All rights reserved. CENTURY 21®, the CENTURY 21 Logo and C21® are service marks owned by Century 21 Real Estate LLC. Century 21 Real Estate LLC fully supports the principles of the Fair Housing Act and the Equal Opportunity Act. Each office is independently owned and operated. Listing information is deemed reliable but not guaranteed accurate.