- Airport homes for sale
- Bret Harte homes for sale
- Bystrom homes for sale
- Ceres homes for sale
- Del Rio homes for sale
- Delhi homes for sale
- Denair homes for sale
- East Oakdale homes for sale
- Empire homes for sale
- Hickman homes for sale
- Hughson homes for sale
- Keyes homes for sale
- Modesto homes for sale
- Oakdale homes for sale
- Riverbank homes for sale
- Salida homes for sale
- Turlock homes for sale
- Waterford homes for sale
- West Modesto homes for sale
- Westport homes for sale
Stanislaus County, CA - homes for sale
300 of 1,576 results displayed
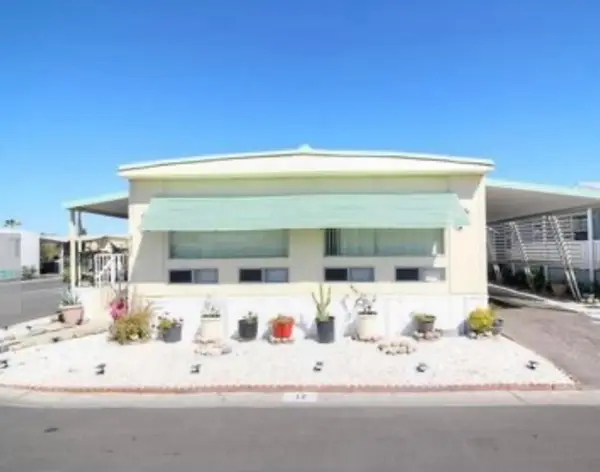
- New
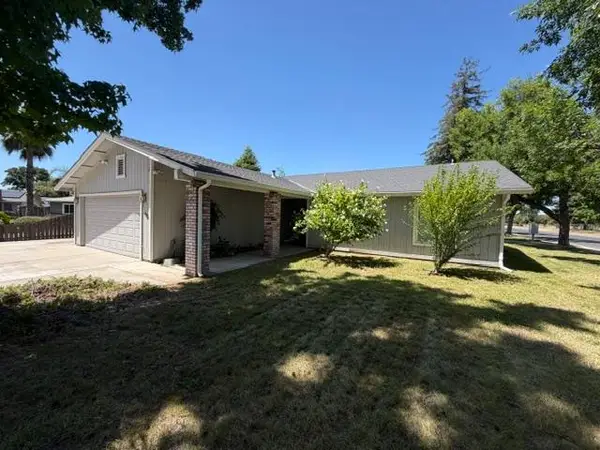
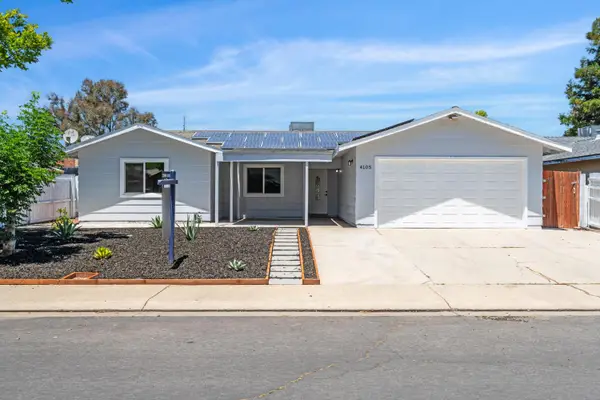
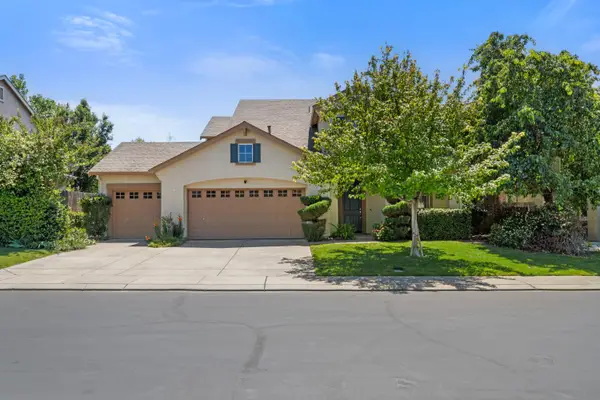
 $489,900Active3 beds 2 baths1,462 sq. ft.
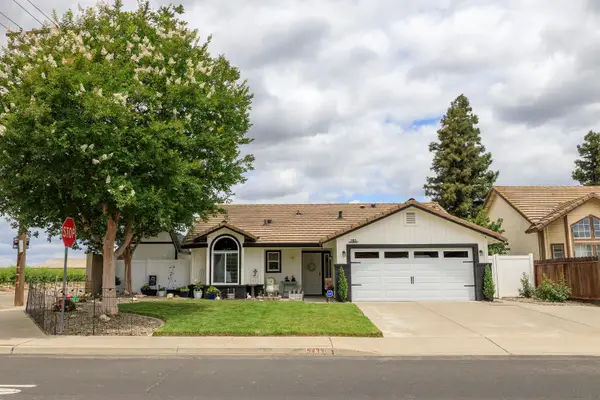
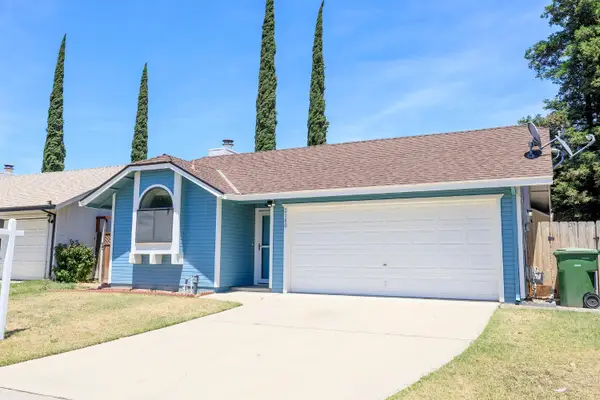
5912 Squire Wells Way, Riverbank, CA 95367
MLS# 41137767Listed by: REFERRAL CITY REALTY
- New
 $499,000Active3 beds 2 baths1,627 sq. ft.
1621 Groveton Way, Modesto, CA 95355
MLS# 226073565Listed by: LPT REALTY, INC. - New
 $119,000Active2 beds 2 baths1,440 sq. ft.
2845 E Hatch Road #12, Modesto, CA 95351
MLS# 226073679Listed by: REALTY ONE GROUP ZOOM - New
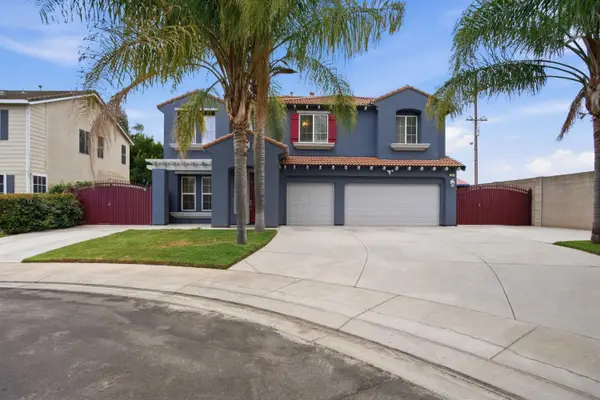 $719,900Active5 beds 4 baths3,468 sq. ft.
1501 Tristan Court, Hughson, CA 95326
MLS# 226073373Listed by: ADROIT REAL ESTATE - New
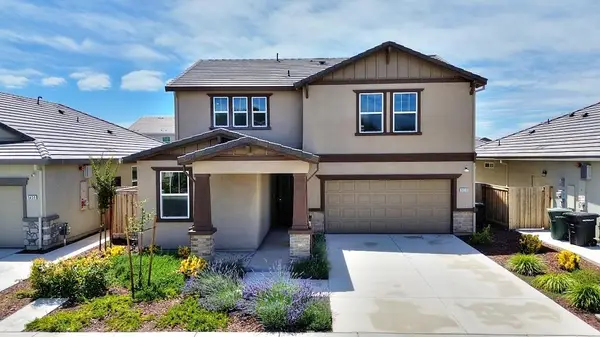
 $625,000Active4 beds 3 baths2,255 sq. ft.
422 Sycamore Avenue, Modesto, CA 95354
MLS# 226070447Listed by: CORE FOUR REALTY - Open Sat, 12 to 2pmNew
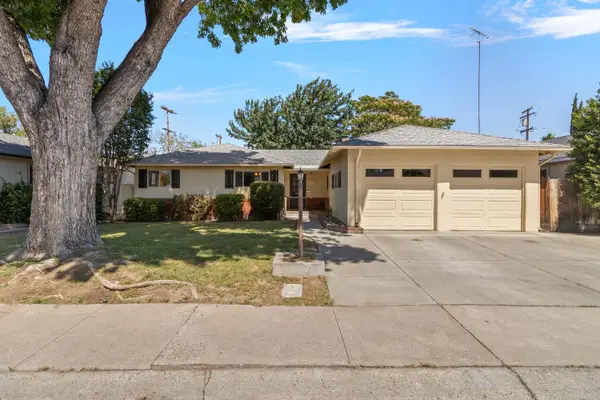 $445,000Active3 beds 2 baths1,248 sq. ft.
2122 Fremont Avenue, Modesto, CA 95350
MLS# 226068416Listed by: PMZ REAL ESTATE - Open Sat, 12:30 to 2:30pmNew
 $610,000Active4 beds 3 baths2,289 sq. ft.
5439 Drawbridge Way, Riverbank, CA 95367
MLS# 226073370Listed by: PMZ REAL ESTATE - New
 $525,000Active4 beds 3 baths1,880 sq. ft.
2147 Sorrel Drive, Turlock, CA 95380
MLS# 226073471Listed by: REAL BROKER - New
 $415,000Active2 beds 2 baths1,008 sq. ft.
2200 Lodgepole Circle #302, Silverthorne, CO 80498
MLS# S1069530Listed by: THE RESOURCE GROUP, LLC - New
 $489,900Active4 beds 2 baths1,449 sq. ft.
1316 Riverette Drive, Modesto, CA 95351
MLS# 226073096Listed by: PMZ REAL ESTATE - New
 $899,000Active5 beds 4 baths3,885 sq. ft.
2105 Steinbeck, Modesto, CA 95356
MLS# 226073097Listed by: GNN REAL ESTATE - New
 $425,000Active3 beds 2 baths1,197 sq. ft.
1421 Raquel Lane, Modesto, CA 95355
MLS# ML82050315Listed by: LPT REALTY - New
 $415,000Active3 beds 2 baths1,308 sq. ft.
1505 Hamilton Avenue, Modesto, CA 95350
MLS# 226073274Listed by: RE/MAX EXECUTIVE - New
 $519,000Active3 beds 2 baths2,168 sq. ft.
9016 Tee Box Court, Patterson, CA 95363
MLS# 226069645Listed by: KW CENTRAL VALLEY - New
 $352,000Active3 beds 1 baths996 sq. ft.
1917 Dartmouth Court, Modesto, CA 95350
MLS# 226072539Listed by: NEXTHOME PROGRESSIVE - New
 $1,395,000Active0.49 Acres
7409 River Nine Drive, Modesto, CA 95356
MLS# 226072983Listed by: PMZ REAL ESTATE - New
 $695,000Active3 beds 2 baths1,853 sq. ft.
718 6th Street, Modesto, CA 95354
MLS# 226073143Listed by: GNN REAL ESTATE - New
 $541,990Active4 beds 3 baths1,950 sq. ft.
3829 Popolari Way, Modesto, CA 95357
MLS# 226073201Listed by: KB HOME SALES-NORTHERN CALIFORNIA INC - New
 $603,990Active5 beds 3 baths2,572 sq. ft.
2637 Horned Lark Lane, Modesto, CA 95357
MLS# 226073202Listed by: KB HOME SALES-NORTHERN CALIFORNIA INC - New
 $473,990Active3 beds 2 baths1,592 sq. ft.
1545 Apiary Way, Hughson, CA 95326
MLS# 226073203Listed by: KB HOME SALES-NORTHERN CALIFORNIA INC - New
 $119,900Active2 beds 2 baths1,020 sq. ft.
2621 Prescott Road #229, Modesto, CA 95350
MLS# 226072892Listed by: PMZ REAL ESTATE - Open Sat, 1 to 4pmNew
 $329,000Active3 beds 2 baths1,225 sq. ft.
1351 S Orange St, Turlock, CA 95380
MLS# 41137625Listed by: EXP REALTY OF CALIFORNIA, INC - Open Sat, 10am to 1pmNew
 $634,900Active4 beds 3 baths2,694 sq. ft.
3304 Cardinal Flower Avenue, Modesto, CA 95355
MLS# 226072970Listed by: PMZ REAL ESTATE - New
 $175,000Active0.13 Acres
812 E H Street, Oakdale, CA 95351
MLS# 226072999Listed by: EXIT REALTY CONSULTANTS - New
 $429,999Active-- beds -- baths
821 Colorado Avenue, Modesto, CA 95351
MLS# 226073036Listed by: KW CENTRAL VALLEY - New
 $6,600,000Active98 Acres
5449 American Avenue, Modesto, CA 95358
MLS# 226061223Listed by: FIORINI REAL ESTATE SERVICES - New
 $98,000Active2 beds 2 baths1,440 sq. ft.
1400 Tully Road #116, Turlock, CA 95380
MLS# 226072946Listed by: KELLER WILLIAMS PROPERTY TEAM TURLOCK - New
 $902,000Active3 beds 3 baths3,002 sq. ft.
Address Withheld By Seller, Turlock, CA 95382
MLS# ML82050213Listed by: BELLAMIA REAL ESTATE SERVICES - Open Sat, 12 to 3pmNew
 $659,900Active4 beds 3 baths2,269 sq. ft.
1267 Casual Lane, Turlock, CA 95382
MLS# 226072737Listed by: POWERHOUSE REALTY - Open Sat, 11am to 1pmNew
 $415,000Active3 beds 2 baths1,511 sq. ft.
1804 Oak Leaf Drive, Modesto, CA 95354
MLS# 226070095Listed by: HOMESMART PV & ASSOCIATES - New
 $4,320,000Active155 Acres
8925 E Monte Vista, Denair, CA 95316
MLS# 226065787Listed by: CENTURY 21 SELECT REAL ESTATE - New
 $4,230,000Active4 beds 3 baths2,950 sq. ft.
8925 E Monte Vista, Denair, CA 95316
MLS# 226072703Listed by: CENTURY 21 SELECT REAL ESTATE - New
 $549,999Active5 beds 4 baths2,828 sq. ft.
13317 Harbor Drive, Waterford, CA 95386
MLS# 226072566Listed by: ATLANTIC REALTY - New
 $559,000Active5 beds 3 baths2,541 sq. ft.
13211 Rivercrest Drive, Waterford, CA 95386
MLS# 226072596Listed by: GRAND PROPERTIES - New
 $450,000Active3 beds 2 baths1,575 sq. ft.
2628 Turquoise Court, Modesto, CA 95355
MLS# 226072653Listed by: RE/MAX GOLD - MURPHYS - New
 $483,996Active3 beds 2 baths1,731 sq. ft.
2601 Temperate Court, Modesto, CA 95358
MLS# 226072611Listed by: CELENIA PRIETO, BROKER - New
 $349,888Active3 beds 2 baths756 sq. ft.
1505 Victoria Drive, Modesto, CA 95351
MLS# ML82042630Listed by: CHRISTIE'S INTERNATIONAL REAL ESTATE SERENO - New
 $520,000Active4 beds 3 baths1,769 sq. ft.
4608 Sun Stone Court, Salida, CA 95368
MLS# 226072437Listed by: HOMESMART PV & ASSOCIATES - New
 $998,000Active12.57 Acres
2700 North Avenue, Modesto, CA 9535
MLS# 226069606Listed by: PREMIER CALIFORNIA PROPERTIES - New
 $165,000Active3 beds 2 baths1,440 sq. ft.
5901 Newbrook Circle #117, Riverbank, CA 95367
MLS# 226072510Listed by: HOMESMART PV & ASSOCIATES - New
 $349,990Active2 beds 1 baths928 sq. ft.
1605 El Dorado Avenue, Modesto, CA 95358
MLS# 226072488Listed by: GIL'S REAL ESTATE - New
 $199,990Active-- beds -- baths522 sq. ft.
1601 El Dorado Avenue, Modesto, CA 95358
MLS# 226072469Listed by: GIL'S REAL ESTATE - New
 $544,990Active4 beds 3 baths1,718 sq. ft.
7003 Royal Links Drive, Riverbank, CA 95367
MLS# 226072260Listed by: PMZ REAL ESTATE  $440,000Pending4 beds 2 baths1,692 sq. ft.
2248 Clear Creek Court, Newman, CA 95360
MLS# 226072417Listed by: BARRIOS REALTY CONSULTANTS- New
 $599,000Active3 beds 4 baths1,801 sq. ft.
936 Oakbrooke Court, Modesto, CA 95351
MLS# 226072229Listed by: EXCEL REALTY - New
 $459,901Active3 beds 2 baths1,476 sq. ft.
1214 Pioneer Avenue, Turlock, CA 95380
MLS# 226072356Listed by: HOMESMART PV & ASSOCIATES - New
 $1,025,000Active3 beds 4 baths2,652 sq. ft.
10606 Pioneer Avenue, Oakdale, CA 95361
MLS# 226072052Listed by: HOMESMART PV & ASSOCIATES - New
 $1,425,000Active5 beds 4 baths4,939 sq. ft.
1300 N Berkeley Avenue, Turlock, CA 95380
MLS# 226071911Listed by: ASPIRE HOME REAL ESTATE, INC. - New
 $410,000Active3 beds 2 baths1,480 sq. ft.
1613 E Call Way, Modesto, CA 95355
MLS# 226072133Listed by: HOMESMART PV & ASSOCIATES - Open Wed, 4 to 6pmNew
 $429,900Active3 beds 2 baths1,552 sq. ft.
2800 Tassajara Drive, Modesto, CA 95358
MLS# 226071327Listed by: EXIT REALTY CONSULTANTS - New
 $375,000Active3 beds 2 baths1,061 sq. ft.
1717 Chapala Way, Modesto, CA 95355
MLS# 226071905Listed by: PMZ REAL ESTATE  $405,000Pending3 beds 3 baths1,818 sq. ft.
409 Phoenix Ave, Modesto, CA 95354
MLS# 226072072Listed by: PROFESSIONAL REALTY ASSOCIATES- New
 $711,570Active4 beds 3 baths2,286 sq. ft.
2957 Castleview Drive, Turlock, CA 95382
MLS# 226070890Listed by: HOMESMART PV & ASSOCIATES - New
 $925,870Active5 beds 4 baths3,017 sq. ft.
2080 Zane Way, Turlock, CA 95382
MLS# 226071363Listed by: HOMESMART PV & ASSOCIATES  $419,900Pending3 beds 2 baths1,750 sq. ft.
2912 Alder Creek Drive, Modesto, CA 95355
MLS# 226072050Listed by: ALLISON JAMES ESTATES & HOMES- New
 $435,000Active3 beds 2 baths1,519 sq. ft.
424 Goldrun Drive, Modesto, CA 95354
MLS# 226069984Listed by: REDFIN CORPORATION - Open Wed, 11am to 4pmNew
 $491,490Active3 beds 3 baths1,582 sq. ft.
4304 John George Drive, Modesto, CA 95355
MLS# 226071983Listed by: D R HORTON AMERICA'S BUILDER - Open Wed, 11am to 4pmNew
 $632,490Active5 beds 3 baths2,311 sq. ft.
1409 Artisan Lane, Modesto, CA 95356
MLS# 226072010Listed by: D R HORTON AMERICA'S BUILDER - New
 $155,000Active0.12 Acres
814 Floyd Avenue, Modesto, CA 95350
MLS# 226071787Listed by: PMZ REAL ESTATE - Open Wed, 11am to 4pmNew
 $635,490Active5 beds 3 baths2,537 sq. ft.
4108 Whitehead Way, Modesto, CA 95355
MLS# 226071925Listed by: D R HORTON AMERICA'S BUILDER - New
 $526,888Active3 beds 2 baths1,839 sq. ft.
705 W Rumble Rd, Modesto, CA 95350
MLS# 41135927Listed by: COMPASS - New
 $1,795,000Active-- beds -- baths
1 S Fogarty Road, Oakdale, CA 95361
MLS# 650014Listed by: AGRI BUSINESS FINANCIAL INCORPORATED  $695,000Pending2 beds 2 baths1,866 sq. ft.
1013 Copper Lake Court, Modesto, CA 95355
MLS# 226042690Listed by: PMZ REAL ESTATE- New
 $595,000Active4 beds 3 baths1,980 sq. ft.
257 Reardon Street, Oakdale, CA 95361
MLS# 226069181Listed by: RE/MAX EXECUTIVE - New
 $425,000Active2 beds 2 baths1,220 sq. ft.
3609 Thomas More Way, Modesto, CA 95356
MLS# 226071833Listed by: PMZ REAL ESTATE - New
 $695,000Active5 beds 4 baths3,154 sq. ft.
3909 Ruffed Grouse Lane, Modesto, CA 95355
MLS# 226071843Listed by: RE/MAX EXECUTIVE - New
 $2,990,000Active40 Acres
10037 Ca-33, Patterson, CA 95363
MLS# ML82049924Listed by: COMPASS - New
 $539,000Active4 beds 2 baths1,810 sq. ft.
3400 Sleepy Hollow Lane, Modesto, CA 95355
MLS# 226071777Listed by: PMZ REAL ESTATE - New
 $505,000Active3 beds -- baths1,667 sq. ft.
2021 Elwin Way, Modesto, CA 95350
MLS# 649717Listed by: REAL BROKERAGE TECHNOLOGIES - New
 $528,000Active3 beds 2 baths2,011 sq. ft.
335 North Avenue, Turlock, CA 95382
MLS# 226069936Listed by: HOMESMART PV & ASSOCIATES - New
 $339,000Active3 beds 2 baths1,010 sq. ft.
3020 Farris Avenue, Ceres, CA 95307
MLS# 226070267Listed by: LPT REALTY, INC  $520,000Pending3 beds 2 baths1,408 sq. ft.
3719 Blaker Road, Ceres, CA 95307
MLS# 226071708Listed by: BARRIOS REALTY CONSULTANTS- New
 $159,000Active3 beds 2 baths1,140 sq. ft.
2845 E Hatch Road #104, Modesto, CA 95351
MLS# 226071750Listed by: HOMESMART PV AND ASSOCIATES - New
 $474,950Active3 beds 2 baths1,719 sq. ft.
4604 Endicott Dr, Salida, CA 95368
MLS# ML82049909Listed by: COMPASS - New
 $399,999Active3 beds 2 baths1,316 sq. ft.
3320 Waynesboro Court, Ceres, CA 95307
MLS# 226071551Listed by: GNN REAL ESTATE - New
 $549,900Active3 beds 2 baths1,664 sq. ft.
1417 Remington Place, Modesto, CA 95358
MLS# 226070931Listed by: RE/MAX GOLD  $329,000Pending2 beds 1 baths979 sq. ft.
528 N 4th Street, Patterson, CA 95363
MLS# 226071572Listed by: ATLANTIC REALTY- New
 $420,000Active3 beds 1 baths960 sq. ft.
2309 Ustick Rd, Modesto, CA 95358
MLS# 226071576Listed by: RE/MAX EXECUTIVE - Open Wed, 11am to 4pmNew
 $499,490Active5 beds 3 baths2,311 sq. ft.
13014 Crescent Street, Waterford, CA 95386
MLS# 226071590Listed by: D R HORTON AMERICA'S BUILDER - Open Wed, 11am to 4pmNew
 $479,490Active4 beds 3 baths2,098 sq. ft.
13012 Crescent Street, Waterford, CA 95386
MLS# 226071601Listed by: D R HORTON AMERICA'S BUILDER - New
 $499,999Active3 beds 3 baths1,477 sq. ft.
4420 Dandelion Court, Salida, CA 95368
MLS# ML82049847Listed by: INTERO REAL ESTATE SERVICES - New
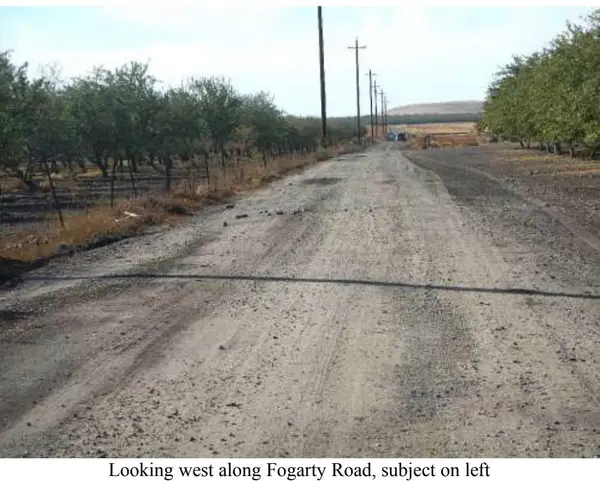 $1,795,000Active117.79 Acres
0 Fogarty Avenue, Oakdale, CA 95361
MLS# 226071366Listed by: AGRIBUSINESS FINANCIAL INC - New
 $529,000Active3 beds 2 baths1,710 sq. ft.
1138 Fordham Avenue, Modesto, CA 95350
MLS# 226071519Listed by: WEDGEWOOD HOMES REALTY - New
 $529,000Active4 beds 3 baths2,012 sq. ft.
505 Redfield Avenue, Modesto, CA 95357
MLS# 226071061Listed by: HOMESMART PV & ASSOCIATES - New
 $424,900Active3 beds 2 baths1,522 sq. ft.
1709 Barbara Way, Modesto, CA 95350
MLS# 226071485Listed by: WEDGEWOOD HOMES REALTY - New
 $280,000Active2 beds 1 baths736 sq. ft.
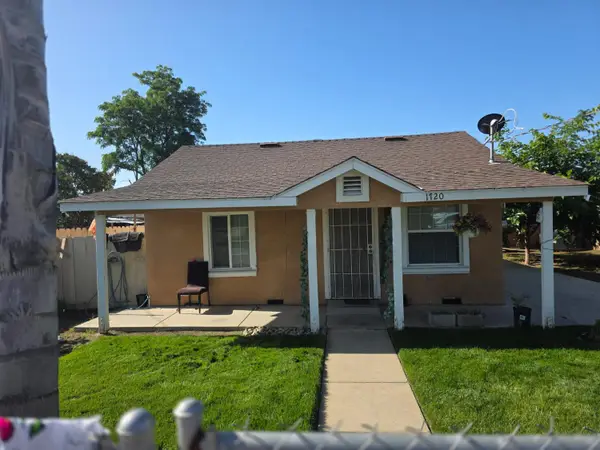
1720 Donald Street, Modesto, CA 95351
MLS# 226070802Listed by: EXIT REALTY CONSULTANTS - New
 $519,995Active4 beds 3 baths1,898 sq. ft.
209 Dogwood Ranch Way, Patterson, CA 95363
MLS# 226071101Listed by: PMZ REAL ESTATE - New
 $459,000Active3 beds 2 baths1,472 sq. ft.
8503 Smith Street, Patterson, CA 95363
MLS# 226071294Listed by: EXIT REALTY CONSULTANTS - New
 $925,000Active2 beds 2 baths1,765 sq. ft.
21907 Morris Road, Crows Landing, CA 95313
MLS# 226071399Listed by: PMZ REAL ESTATE - New
 $573,900Active4 beds 2 baths1,708 sq. ft.
4420 Sierra Street, Riverbank, CA 95367
MLS# 226071218Listed by: LGI REALTY - CALIFORNIA, INC. - New
 $534,900Active3 beds 2 baths1,335 sq. ft.
4313 Gallant Fox Court, Riverbank, CA 95367
MLS# 226071256Listed by: LGI REALTY - CALIFORNIA, INC. - New
 $485,000Active4 beds 2 baths1,555 sq. ft.
4105 Faith Lane, Modesto, CA 95355
MLS# 226071083Listed by: PMZ REAL ESTATE  $445,000Pending3 beds 2 baths1,523 sq. ft.
109 James Burke Ave, Patterson, CA 95363
MLS# 41136917Listed by: INTERO REAL ESTATE SERVICES $379,900Pending3 beds 2 baths1,152 sq. ft.
1532 Hialeah Drive, Modesto, CA 95350
MLS# 226056049Listed by: HOMESMART PV & ASSOCIATES- Open Sun, 11am to 2pmNew
 $445,000Active4 beds 3 baths1,610 sq. ft.
1808 Coventry Garden, Modesto, CA 95358
MLS# 226069167Listed by: HOME BUYERS REALTY - New
 $515,000Active4 beds 3 baths1,928 sq. ft.
2308 Grouse Crossing Way, Modesto, CA 95355
MLS# 226069851Listed by: PMZ REAL ESTATE  $1,400,000Pending4 beds 4 baths2,842 sq. ft.
10621 Gibbs Drive, Oakdale, CA 95361
MLS# 226070668Listed by: RE/MAX EXECUTIVE- New
 $685,000Active3 beds 3 baths3,181 sq. ft.
4104 Wheeler Peak Way, Modesto, CA 95356
MLS# 226070910Listed by: KELLER WILLIAMS CENTRAL VALLEY - New
 $799,900Active4 beds 2 baths2,324 sq. ft.
3460 Roselle Avenue, Modesto, CA 95355
MLS# 226070926Listed by: HOMESMART PV & ASSOCIATES - New
 $499,000Active3 beds 2 baths1,354 sq. ft.
5433 Nanette Drive, Salida, CA 95368
MLS# 226064659Listed by: HOMESMART PV & ASSOCIATES  $459,980Pending3 beds 2 baths1,330 sq. ft.
1320 Wylmawood Lane, Modesto, CA 95355
MLS# 226070047Listed by: CENTURY 21 SELECT REAL ESTATE- New
 $850,000Active4 beds 3 baths2,315 sq. ft.
2485 Tigers Drive, Turlock, CA 95382
MLS# 226070600Listed by: J.PETER REALTORS  $290,000Pending4 beds 2 baths1,502 sq. ft.
1299 Moonlight Drive, Ceres, CA 95307
MLS# 226070886Listed by: MERCED HOMES REALTY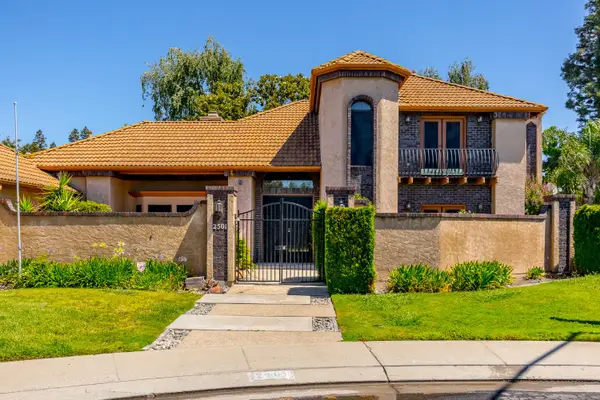 $724,900Pending4 beds 3 baths2,667 sq. ft.
2501 Hilversum Lane, Modesto, CA 95356
MLS# 226054474Listed by: PMZ REAL ESTATE- New
 $1,099,900Active3 beds 3 baths2,296 sq. ft.
2931 E Marshall Road, Crows Landing, CA 95313
MLS# 226069299Listed by: REALTY WORLD -RW PROPERTIES - New
 $495,999Active3 beds 2 baths1,560 sq. ft.
2720 Harvest Road, Modesto, CA 95355
MLS# 226070376Listed by: HOMESMART PV & ASSOCIATES - New
 $425,000Active3 beds 2 baths1,551 sq. ft.
237 Yosemite Meadows Drive, Modesto, CA 95357
MLS# 226070678Listed by: PMZ REAL ESTATE - New
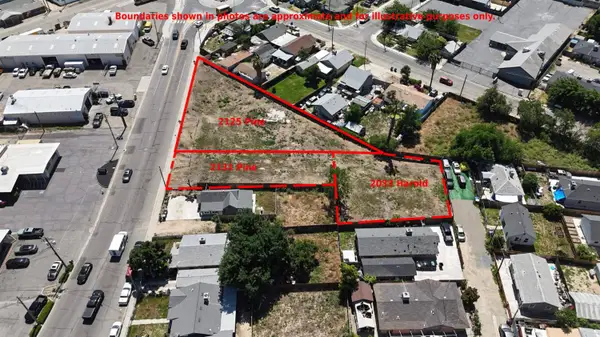 $425,000Active0.78 Acres
2125 Pine Street, Ceres, CA 95307
MLS# 226070680Listed by: PMZ REAL ESTATE - New
 $564,900Active4 beds 3 baths1,785 sq. ft.
2521 Jubilee Drive, Turlock, CA 95380
MLS# 226070258Listed by: EXIT REALTY CONSULTANTS - New
 $474,900Active3 beds 2 baths1,754 sq. ft.
1128 Multnomah Drive, Modesto, CA 95350
MLS# 226070621Listed by: PMZ REAL ESTATE - New
 $420,000Active3 beds 3 baths2,220 sq. ft.
1917 Edgebrook Drive #D, Modesto, CA 95354
MLS# 226070428Listed by: URBINA PROPERTIES - New
 $1,695,000Active4 beds 3 baths3,184 sq. ft.
5012 Ustick Road, Modesto, CA 95358
MLS# 226067667Listed by: PMZ COMMERCIAL REAL ESTATE - New
 $550,000Active4 beds 3 baths2,828 sq. ft.
13316 Rivercrest Drive, Waterford, CA 95386
MLS# 226069141Listed by: REALTYLAB - New
 $585,000Active3 beds 2 baths1,605 sq. ft.
2431 Cypress Point Drive, Turlock, CA 95380
MLS# 226069896Listed by: CENTURY 21 SELECT REAL ESTATE  $575,000Pending4 beds 2 baths2,070 sq. ft.
1704 Carpathian Way, Hughson, CA 95326
MLS# 226070103Listed by: RE/MAX EXECUTIVE- New
 $539,999Active5 beds 3 baths2,500 sq. ft.
294 New Court, Oakdale, CA 95361
MLS# 226070418Listed by: PMZ REAL ESTATE - New
 $425,900Active2 beds 1 baths1,015 sq. ft.
916 Elm Avenue, Modesto, CA 95354
MLS# 226054720Listed by: ALLISON JAMES ESTATES & HOMES - New
 $95,999Active2 beds 2 baths1,152 sq. ft.
1500 Held Drive #94, Modesto, CA 95355
MLS# 226069524Listed by: DEBRA DIAMOND REALTY - New
 $450,000Active4 beds 2 baths1,394 sq. ft.
1701 Pawtucket Avenue, Modesto, CA 95358
MLS# 226069771Listed by: WEST COAST MARKETING GROUP - New
 $409,500Active3 beds 2 baths1,056 sq. ft.
2180 Oxford Avenue, Turlock, CA 95382
MLS# 226069620Listed by: CENTURY 21 SELECT REAL ESTATE - New
 $549,000Active3 beds 1 baths1,406 sq. ft.
12224 Yosemite Boulevard, Waterford, CA 95386
MLS# 226070115Listed by: ADROIT REAL ESTATE  $589,000Pending4 beds 4 baths2,253 sq. ft.
1325 Sherwood Drive, Turlock, CA 95380
MLS# 226069275Listed by: KELLER WILLIAMS PROPERTY TEAM TURLOCK- New
 $429,999Active3 beds 3 baths1,666 sq. ft.
2405 Walnut Park Drive, Modesto, CA 95355
MLS# 226069607Listed by: EXIT REALTY CONSULTANTS - New
 $315,000Active2 beds 2 baths1,064 sq. ft.
1108 Cedar Creek Drive #4, Modesto, CA 95355
MLS# 226070225Listed by: CORE FOUR REALTY  $520,000Pending3 beds 2 baths1,501 sq. ft.
1817 San Gabriel Drive, Hughson, CA 95326
MLS# 226069885Listed by: ATLANTIC REALTY $739,900Pending4 beds 2 baths2,399 sq. ft.
2065 N Quincy Road, Turlock, CA 95382
MLS# 226069951Listed by: EXIT REALTY CONSULTANTS- New
 $499,000Active3 beds 2 baths1,542 sq. ft.
1909 Destiny Way, Modesto, CA 95356
MLS# 226069926Listed by: PMZ REAL ESTATE - New
 $429,999Active3 beds 3 baths1,310 sq. ft.
430 Peppercorn Drive, Turlock, CA 95380
MLS# 226069554Listed by: LIGHTHOUSE REAL ESTATE, INC. - New
 $1,750,000Active4 beds 3 baths2,282 sq. ft.
2837 Geer Road, Hughson, CA 95326
MLS# 226069655Listed by: J.PETER REALTORS - New
 $657,990Active3 beds 2 baths1,585 sq. ft.
1152 Shadow Ridge Way, Fillmore, CA 93015
MLS# V1-36738Listed by: WILLIAMS HOMES INC - New
 $599,999Active5 beds 2 baths2,163 sq. ft.
2201 Vivian Road, Modesto, CA 95358
MLS# 226067393Listed by: PMZ REAL ESTATE - New
 $850,000Active5 beds 3 baths3,035 sq. ft.
1912 Legend Drive, Modesto, CA 95357
MLS# 226069539Listed by: PMZ REAL ESTATE - New
 $297,888Active2 beds 1 baths816 sq. ft.
221 Alturas, Modesto, CA 95351
MLS# 226069712Listed by: LIFESTYLE REALTY - New
 $2,500,000Active5 beds 3 baths3,228 sq. ft.
11243 Merced Avenue, Turlock, CA 95380
MLS# 226069738Listed by: PMZ REAL ESTATE - New
 $510,000Active3 beds 2 baths1,650 sq. ft.
3101 La Costa Ln, Modesto, CA 95355
MLS# 41136808Listed by: KW ADVISORS EAST BAY  $498,000Pending3 beds 3 baths1,580 sq. ft.
5504 Sun Gold Drive, Salida, CA 95368
MLS# 226069592Listed by: PMZ REAL ESTATE- New
 $499,000Active3 beds 3 baths2,058 sq. ft.
604 W Union Avenue, Modesto, CA 95356
MLS# 226068128Listed by: BERKSHIRE HATHAWAY HOMESERVICES-DRYSDALE PROPERTIES - New
 $399,900Active3 beds 2 baths1,104 sq. ft.
2105 Norman Way, Modesto, CA 95350
MLS# 226068755Listed by: PMZ REAL ESTATE - New
 $487,000Active3 beds 2 baths1,378 sq. ft.
1104 Valencia, Modesto, CA 95350
MLS# 226069157Listed by: OTHERS REALTY - New
 $450,000Active3 beds 2 baths1,123 sq. ft.
867 I Street, Hickman, CA 95323
MLS# 226069376Listed by: EXIT REALTY CONSULTANTS  $299,900Pending2 beds 2 baths792 sq. ft.
12912 Welch Street, Waterford, CA 95386
MLS# 226069439Listed by: JARED ENGLISH, BROKER- Open Sat, 12 to 2pmNew
 $525,000Active3 beds 2 baths1,259 sq. ft.
1821 Bumgardner Court, Modesto, CA 95355
MLS# 41134296Listed by: TWIN OAKS REAL ESTATE INC. - New
 $579,900Active4 beds 2 baths1,729 sq. ft.
1672 Moonbeam Way, Turlock, CA 95382
MLS# 226069257Listed by: HOMESMART PV & ASSOCIATES - New
 $360,000Active3 beds 1 baths1,122 sq. ft.
825 Wheatley Avenue, Modesto, CA 95351
MLS# 226067489Listed by: HOMESMART PV & ASSOCIATES  $390,000Pending3 beds 1 baths1,066 sq. ft.
921 E E Street, Oakdale, CA 95361
MLS# 226069277Listed by: CENTURY 21 SELECT REAL ESTATE $68,500Pending3 beds 2 baths1,043 sq. ft.
2107 Patterson Road #31, Riverbank, CA 95367
MLS# 226069179Listed by: FATHOM REALTY GROUP, INC.- New
 $624,950Active3 beds 3 baths2,693 sq. ft.
4212 Gabriel Way, Modesto, CA 95356
MLS# 226069131Listed by: PMZ REAL ESTATE - New
 $639,000Active4 beds 3 baths2,850 sq. ft.
3705 Amestoy Court, Modesto, CA 95355
MLS# 226069092Listed by: EXIT REALTY CONSULTANTS - New
 $545,000Active4 beds 3 baths2,538 sq. ft.
1165 Walnut Creek Drive, Newman, CA 95360
MLS# 226069029Listed by: EXCELLENCE REAL ESTATE, INC. - New
 $565,000Active4 beds 3 baths2,089 sq. ft.
368 Nutcrest Court, Oakdale, CA 95361
MLS# 226069031Listed by: SB PROPERTIES  $524,950Pending4 beds 2 baths2,037 sq. ft.
3724 Glenview Court, Modesto, CA 95355
MLS# 226069032Listed by: PMZ REAL ESTATE $525,000Active3 beds 2 baths1,826 sq. ft.
5421 Indian Ridge Lane, Salida, CA 95368
MLS# 226063980Listed by: HERO REAL ESTATE $648,000Active-- beds -- baths3,128 sq. ft.
432 S Palm Street, Turlock, CA 95380
MLS# 226068911Listed by: BRIVIO REALTY $849,900Active4 beds 3 baths3,332 sq. ft.
3200 Brookstone Drive, Turlock, CA 95382
MLS# 226067505Listed by: UP STAR HOME INVESTMENT, INC.- Open Sat, 12 to 2pm
 $520,000Active4 beds 3 baths2,338 sq. ft.
2141 Denali Park Court, Newman, CA 95360
MLS# 226068737Listed by: PMZ REAL ESTATE  $459,000Active3 beds 2 baths1,418 sq. ft.
1042 R Street, Newman, CA 95360
MLS# 226068764Listed by: CENTURY 21 SELECT REAL ESTATE $720,000Active5 beds 3 baths3,512 sq. ft.
3779 Wild Oak Drive, Ceres, CA 95307
MLS# 226068874Listed by: GNN REAL ESTATE- Open Sat, 9:30am to 12:30pm
 $630,000Active3 beds 2 baths1,828 sq. ft.
3705 N Berkeley Avenue, Turlock, CA 95382
MLS# 226052288Listed by: LIFESTYLE REALTY  $889,900Pending4 beds 3 baths2,663 sq. ft.
2600 Raleigh Court, Turlock, CA 95382
MLS# 226064339Listed by: CENTURY 21 SELECT REAL ESTATE $569,900Active4 beds 2 baths1,708 sq. ft.
6412 Justify Lane, Riverbank, CA 95367
MLS# 226068816Listed by: LGI REALTY - CALIFORNIA, INC. $98,999Active2 beds 2 baths1,248 sq. ft.
4812 Esmar Road #29, Ceres, CA 95307
MLS# 226068785Listed by: STIGLER MORTGAGE $515,000Pending4 beds 2 baths1,751 sq. ft.
1795 Mulberry Way, Hughson, CA 95326
MLS# 226068363Listed by: HOMESMART PV & ASSOCIATES $399,500Active3 beds 1 baths1,025 sq. ft.
250 N 9th Avenue, Oakdale, CA 95361
MLS# 226068740Listed by: HOMESMART PV & ASSOCIATES $95,000Active3 beds 2 baths1,809 sq. ft.
2621 Prescott Road #159, Modesto, CA 95350
MLS# 226067520Listed by: COLDWELL BANKER KAPPEL GATEWAY REALTY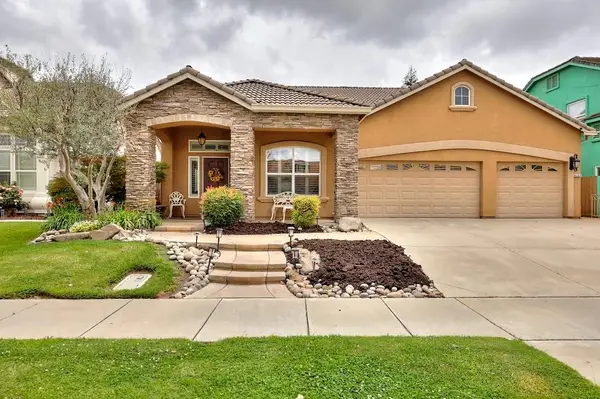 $599,000Pending4 beds 2 baths2,019 sq. ft.
4152 Post Oak Drive, Turlock, CA 95382
MLS# 226068615Listed by: PMZ REAL ESTATE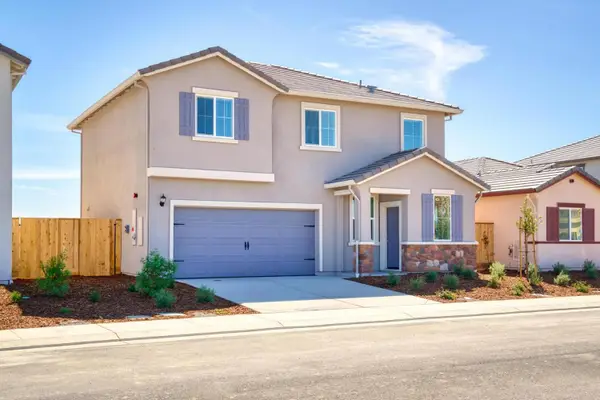 $476,900Active3 beds 3 baths1,621 sq. ft.
2281 Marlene Court, Newman, CA 95360
MLS# 226068576Listed by: LGI REALTY - CALIFORNIA, INC. $536,900Active4 beds 3 baths2,340 sq. ft.
2262 George Court, Newman, CA 95360
MLS# 226068598Listed by: LGI REALTY - CALIFORNIA, INC. $499,995Active2 beds 2 baths1,631 sq. ft.
1415 Myrtle Street, Turlock, CA 95380
MLS# 226068195Listed by: PMZ REAL ESTATE $673,000Active3 beds 2 baths1,780 sq. ft.
301 Robin Hood Drive, Modesto, CA 95350
MLS# 226068577Listed by: JRP REAL ESTATE SERVICES, INC. $474,900Active3 beds 3 baths1,621 sq. ft.
2282 Marlene Court, Newman, CA 95360
MLS# 226068522Listed by: LGI REALTY - CALIFORNIA, INC. $476,900Pending3 beds 3 baths1,621 sq. ft.
2293 Marlene Court, Newman, CA 95360
MLS# 226068535Listed by: LGI REALTY - CALIFORNIA, INC. $426,900Active3 beds 2 baths1,235 sq. ft.
2286 George Court, Newman, CA 95360
MLS# 226068474Listed by: LGI REALTY - CALIFORNIA, INC. $424,900Pending3 beds 2 baths1,235 sq. ft.
2273 George Court, Newman, CA 95360
MLS# 226068492Listed by: LGI REALTY - CALIFORNIA, INC. $425,000Pending3 beds 2 baths1,494 sq. ft.
1070 Georgetown Avenue, Turlock, CA 95382
MLS# 226067389Listed by: HOMESMART PV & ASSOCIATES- Open Wed, 11am to 4pm
 $524,490Active3 beds 3 baths1,582 sq. ft.
4328 Frontier Way, Modesto, CA 95356
MLS# 226068428Listed by: D R HORTON AMERICA'S BUILDER  $525,000Active3 beds 2 baths1,632 sq. ft.
2340 E Hawkeye Avenue, Turlock, CA 95380
MLS# 226068283Listed by: KW CENTRAL VALLEY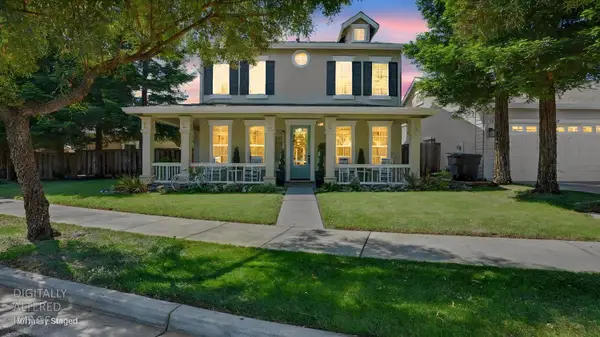 $585,000Active4 beds 3 baths2,088 sq. ft.
1751 Vintage Circle, Oakdale, CA 95361
MLS# 226067684Listed by: WEST COAST MARKETING GROUP $998,000Pending3 beds 2 baths2,100 sq. ft.
7167 Eleanor Road, Oakdale, CA 95361
MLS# 226068034Listed by: PMZ REAL ESTATE $477,000Active3 beds 2 baths1,532 sq. ft.
1608 Kruger Drive, Modesto, CA 95355
MLS# 226068272Listed by: MIRACLE REALTY $557,000Active4 beds 3 baths2,946 sq. ft.
632 Skimmer Dr, Patterson, CA 95363
MLS# 41136445Listed by: ASHBY & GRAFF $650,000Active5 beds 3 baths3,189 sq. ft.
1408 Wallin Way, Modesto, CA 95351
MLS# 226066605Listed by: PMZ REAL ESTATE $475,000Active3 beds 2 baths1,200 sq. ft.
4423 Capurso Drive, Turlock, CA 95382
MLS# 226066314Listed by: CENTURY 21 SELECT REAL ESTATE $510,000Active4 beds 3 baths2,216 sq. ft.
3709 Bing Lane, Ceres, CA 95307
MLS# 226067387Listed by: EXIT REALTY CONSULTANTS $574,999Active4 beds 2 baths1,804 sq. ft.
480 Cornell Drive, Turlock, CA 95382
MLS# 226067973Listed by: PMZ REAL ESTATE $44,900Active2 beds 1 baths720 sq. ft.
5538 Keith Court #12, Turlock, CA 95382
MLS# 226068061Listed by: EXIT REALTY CONSULTANTS $565,000Active4 beds 3 baths2,301 sq. ft.
3732 Mcintosh Ave, Ceres, CA 95307
MLS# 226068108Listed by: HOMESMART PV & ASSOCIATES $475,000Pending3 beds 2 baths1,519 sq. ft.
1524 Irene Avenue, Modesto, CA 95355
MLS# 226068111Listed by: PMZ REAL ESTATE $445,000Pending3 beds 2 baths1,637 sq. ft.
534 Rodeo Grounds Way, Newman, CA 95360
MLS# 226068147Listed by: PMZ REAL ESTATE $1,199,000Active-- beds 5 baths2,235 sq. ft.
720 N 2nd Street, Patterson, CA 95363
MLS# 226067952Listed by: CENTURY 21 SELECT REAL ESTATE $124,000Active2 beds 2 baths1,536 sq. ft.
4837 Faith Home Road #162, Ceres, CA 95307
MLS# 226066704Listed by: EXIT REALTY CONSULTANTS- Open Wed, 11am to 4pm
 $509,490Active4 beds 3 baths1,895 sq. ft.
6415 Honey Locust Way, Riverbank, CA 95367
MLS# 226067879Listed by: D R HORTON AMERICA'S BUILDER - Open Wed, 11am to 4pm
 $504,490Active3 beds 2 baths1,588 sq. ft.
2913 Woodhouse Lane, Oakdale, CA 95361
MLS# 226067895Listed by: D R HORTON AMERICA'S BUILDER - Open Wed, 11am to 4pm
 $500,490Active4 beds 3 baths2,098 sq. ft.
13003 Crescent Street, Waterford, CA 95386
MLS# 226067924Listed by: D R HORTON AMERICA'S BUILDER  $425,000Pending3 beds 2 baths1,401 sq. ft.
2416 San Domingo Way, Modesto, CA 95355
MLS# 226067674Listed by: PMZ REAL ESTATE- Open Wed, 11am to 4pm
 $537,490Active4 beds 3 baths1,895 sq. ft.
4309 E Merle Avenue, Modesto, CA 95355
MLS# 226067843Listed by: D R HORTON AMERICA'S BUILDER  $491,490Pending3 beds 3 baths1,582 sq. ft.
4317 E Merle Avenue, Modesto, CA 95355
MLS# 226067865Listed by: D R HORTON AMERICA'S BUILDER $419,999Pending3 beds 2 baths1,503 sq. ft.
625 Periwinkle Drive, Patterson, CA 95363
MLS# 226067221Listed by: LIFESTYLE REALTY $751,355Active4 beds 3 baths2,218 sq. ft.
1106 Shadow Ridge Way, Fillmore, CA 93015
MLS# V1-36648Listed by: WILLIAMS HOMES INC $699,000Active4 beds 3 baths2,432 sq. ft.
3617 Glencrest Drive, Modesto, CA 95355
MLS# 226067118Listed by: E. RAINER REAL ESTATE $530,000Active4 beds 2 baths1,969 sq. ft.
1720 Somersby Lane, Ceres, CA 95307
MLS# 226067151Listed by: HOMESMART PV & ASSOCIATES $775,000Active3 beds 2 baths2,385 sq. ft.
2035 Sconyers Court, Turlock, CA 95382
MLS# 226056516Listed by: PMZ REAL ESTATE- Open Sun, 12 to 2pm
 $600,000Active4 beds 3 baths2,246 sq. ft.
5209 Sire Court, Riverbank, CA 95367
MLS# 226065254Listed by: PMZ REAL ESTATE  $675,000Pending4 beds 3 baths2,861 sq. ft.
4581 Magnolia Drive, Turlock, CA 95382
MLS# 226065361Listed by: PMZ REAL ESTATE $575,000Pending4 beds 3 baths1,958 sq. ft.
437 Silver Ridge Court, Oakdale, CA 95361
MLS# 226066034Listed by: PREMIER CALIFORNIA PROPERTIES $459,000Pending3 beds 2 baths1,295 sq. ft.
1664 Wylma Way, Modesto, CA 95350
MLS# 226066917Listed by: PMZ REAL ESTATE $475,000Active3 beds 3 baths1,515 sq. ft.
2832 Belharbour Drive, Modesto, CA 95355
MLS# 226066951Listed by: PMZ REAL ESTATE $429,000Pending3 beds 2 baths1,380 sq. ft.
1124 Speer Drive, Modesto, CA 95358
MLS# 226067484Listed by: DIANCA REALTY, INC. $549,000Active3 beds 3 baths1,865 sq. ft.
1724 Vintage Circle, Oakdale, CA 95361
MLS# 226056389Listed by: PMZ REAL ESTATE $639,900Active4 beds 3 baths2,502 sq. ft.
1223 E Springer Drive, Turlock, CA 95382
MLS# 226067364Listed by: J.PETER REALTORS $430,000Pending4 beds 2 baths1,845 sq. ft.
2712 Floyd Avenue, Modesto, CA 95355
MLS# 226067440Listed by: REALTYLAB $1,010,000Active27.39 Acres
700 Wellsford Road, Modesto, CA 95357
MLS# 226068445Listed by: HOMESMART PV & ASSOCIATES- Open Sat, 2 to 5pm
 $629,000Active5 beds 3 baths2,806 sq. ft.
2376 Shire Way, Oakdale, CA 95361
MLS# 260012844SDListed by: SAND & SEA REALTY, INC.  $750,000Pending4 beds 2 baths1,660 sq. ft.
1206 S Verduga Road, Turlock, CA 95380
MLS# 226066786Listed by: THEIS REALTY GROUP INC. $145,000Active2 beds 2 baths1,440 sq. ft.
1604 Cabo Drive, Modesto, CA 95357
MLS# 226067254Listed by: VYLLA HOME INC. $495,000Pending3 beds 2 baths1,722 sq. ft.
601 N 4th Street, Patterson, CA 95363
MLS# 226067284Listed by: REALTY WORLD -RW PROPERTIES $535,490Active4 beds 3 baths1,898 sq. ft.
6037 Lassie Court, Riverbank, CA 95367
MLS# 226067303Listed by: D R HORTON AMERICA'S BUILDER $415,000Active3 beds 3 baths1,734 sq. ft.
1500 Scenic Drive #3, Modesto, CA 95355
MLS# 226067317Listed by: PMZ REAL ESTATE $145,000Active3 beds 2 baths960 sq. ft.
4024 Mchenry Avenue #63, Modesto, CA 96536
MLS# 226067329Listed by: CASTLE REAL ESTATE $559,999Active5 beds 3 baths2,188 sq. ft.
648 Cheshire Drive, Patterson, CA 95363
MLS# 226067331Listed by: HOMESMART PV & ASSOCIATES $350,000Pending3 beds 2 baths758 sq. ft.
1508 Picardy Drive, Modesto, CA 95351
MLS# ML82048764Listed by: REAL BROKERAGE TECHNOLOGIES $338,000Active3 beds 2 baths1,565 sq. ft.
9403 Vintner Circle, Patterson, CA 95363
MLS# ML82048746Listed by: COLDWELL BANKER INFINITI GROUP $400,000Pending2 beds 1 baths876 sq. ft.
253 N 1st Avenue, Oakdale, CA 95361
MLS# 226056565Listed by: PMZ REAL ESTATE $572,000Active4 beds 2 baths2,115 sq. ft.
5037 Countryvale Drive, Salida, CA 95368
MLS# 226067021Listed by: RE/MAX EXECUTIVE $849,000Active4 beds 3 baths2,721 sq. ft.
2500 Konynenburg Lane, Modesto, CA 95356
MLS# 226067159Listed by: CORE FOUR REALTY $585,000Active-- beds -- baths1,800 sq. ft.
Severin Avenue, Modesto, CA 95354
MLS# ML82047644Listed by: JULIE BLACK, BROKER $480,000Active3 beds 2 baths1,536 sq. ft.
1507 Sandy Creek Drive, Newman, CA 95360
MLS# 226067198Listed by: REALHOME SERVICES AND SOLUTIONS, INC. $449,000Active3 beds 2 baths1,451 sq. ft.
1209 Crater Avenue, Modesto, CA 95351
MLS# 226066928Listed by: TNT REAL ESTATE SERVICES $519,999Active3 beds 2 baths1,556 sq. ft.
1750 E G Street, Oakdale, CA 95361
MLS# 226066370Listed by: J.PETER REALTORS $115,000Active-- beds 2 baths1,344 sq. ft.
1500 E Held Drive #55, Modesto, CA 95355
MLS# 226066407Listed by: HOMESMART PV & ASSOCIATES $649,000Pending5 beds 3 baths2,503 sq. ft.
2220 Ellison Drive, Modesto, CA 95355
MLS# 226065255Listed by: HOMESMART PV & ASSOCIATES $499,000Pending3 beds 2 baths1,564 sq. ft.
6541 Graybark Lane, Hughson, CA 95326
MLS# 226066838Listed by: LPT REALTY, INC. $699,000Active3 beds 3 baths2,765 sq. ft.
3204 Humberton Place, Modesto, CA 95355
MLS# 226064662Listed by: PMZ REAL ESTATE $466,990Active3 beds 2 baths1,884 sq. ft.
913 Ryton Lane, Patterson, CA 95363
MLS# 226066778Listed by: KB HOME SALES-NORTHERN CALIFORNIA INC $475,000Pending3 beds 2 baths1,423 sq. ft.
1744 Darwin Court, Ceres, CA 95307
MLS# 226065401Listed by: J.PETER REALTORS $1,120,000Active32.89 Acres
0 Claribel Road, Oakdale, CA 95361
MLS# 226066597Listed by: GAME REALTY $569,900Active4 beds 2 baths1,831 sq. ft.
4504 Santa Fe Street, Riverbank, CA 95367
MLS# 226051170Listed by: LGI REALTY - CALIFORNIA, INC. $699,999Active-- beds -- baths1,435 sq. ft.
142 E Coolidge Avenue, Modesto, CA 95350
MLS# 226066640Listed by: LIFESTYLE REALTY $654,000Active6 beds 3 baths2,082 sq. ft.
3712 Bold Ruler Court, Modesto, CA 95355
MLS# ML82048587Listed by: COLDWELL BANKER REALTY $579,000Active9.7 Acres
0 Elm Avenue, Patterson, CA 95363
MLS# 226035914Listed by: GREG NUNES REALTY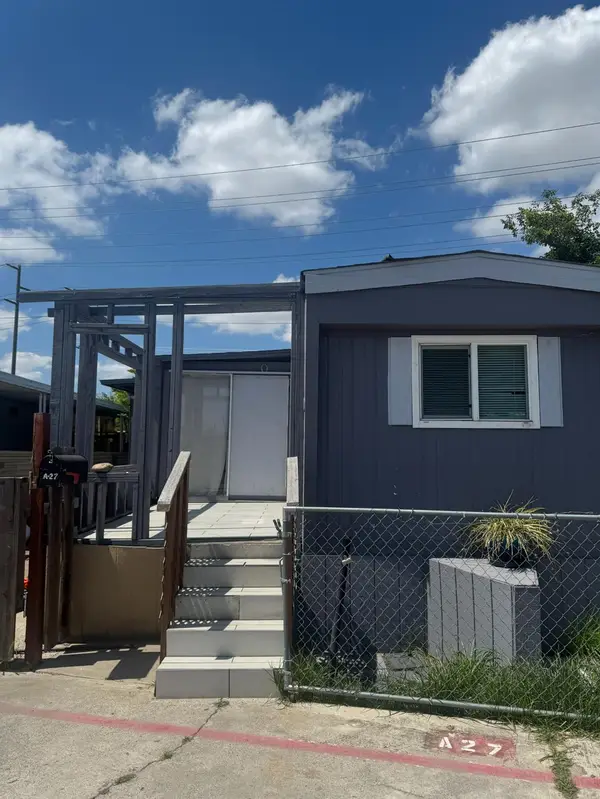 $55,000Active2 beds 1 baths550 sq. ft.
4143 Yosemite Blvd #A27, Modesto, CA 95357
MLS# 226066533Listed by: EXIT REALTY CONSULTANTS $89,900Active2 beds 2 baths1,248 sq. ft.
1200 S Carpenter Road #22, Modesto, CA 95351
MLS# 226066583Listed by: EXIT REALTY CONSULTANTS $535,000Active3 beds 2 baths1,657 sq. ft.
4100 Ahwahnee Court, Modesto, CA 95356
MLS# PW26113831Listed by: LPT REALTY, INC $599,900Active3 beds 2 baths1,616 sq. ft.
4701 Lone Tree Road, Oakdale, CA 95361
MLS# 41135988Listed by: PMZ $389,000Active3 beds 3 baths1,465 sq. ft.
570 Cutting Horse Drive #143, Oakdale, CA 95361
MLS# 226065958Listed by: EXIT REALTY CONSULTANTS $414,000Pending3 beds 1 baths1,160 sq. ft.
324 S Orange Street, Turlock, CA 95380
MLS# 226066311Listed by: KELLER WILLIAMS CENTRAL VALLEY $450,000Pending3 beds 3 baths1,725 sq. ft.
2836 Hawaiian Petrel Avenue, Modesto, CA 95355
MLS# 226066468Listed by: WEDGEWOOD HOMES REALTY $500,000Pending3 beds 2 baths1,595 sq. ft.
4141 Summerfield Drive, Turlock, CA 95382
MLS# 226066261Listed by: OPENDOOR BROKERAGE INC $185,000Active3 beds 2 baths1,782 sq. ft.
1459 Standiford #92, Modesto, CA 95350
MLS# 226065138Listed by: EXIT REALTY CONSULTANTS $325,000Active4 beds 3 baths1,546 sq. ft.
1900 Kenneth Street, Modesto, CA 95351
MLS# ML82048505Listed by: ALLIANCE BAY REALTY $327,750Active3 beds 3 baths1,904 sq. ft.
1426 Louise, Modesto, CA 95350
MLS# SR26113584Listed by: SKYHILL PROPERTIES $544,900Active4 beds 3 baths2,049 sq. ft.
3904 Zakessian Court, Modesto, CA 95356
MLS# 226056350Listed by: CENTURY 21 SELECT REAL ESTATE $617,990Active5 beds 3 baths2,541 sq. ft.
1600 Apiary Way, Hughson, CA 95326
MLS# 226066289Listed by: KB HOME SALES-NORTHERN CALIFORNIA INC $500,000Active3 beds 2 baths1,490 sq. ft.
2120 Annhurst Avenue, Turlock, CA 95382
MLS# 226063419Listed by: PMZ REAL ESTATE $529,990Pending5 beds 3 baths2,254 sq. ft.
3655 Fallview Ave, Ceres, CA 95307
MLS# 226065963Listed by: EWORLD REAL ESTATE $459,000Active3 beds 2 baths1,630 sq. ft.
3712 E Orangeburg Avenue, Modesto, CA 95355
MLS# 226066223Listed by: POWERHOUSE REALTY $394,900Active3 beds 2 baths1,120 sq. ft.
513 Algen Court, Modesto, CA 95358
MLS# 226066256Listed by: HOMESMART PV & ASSOCIATES $679,990Active3 beds 2 baths1,926 sq. ft.
2051 Shoreline Drive, Riverbank, CA 95367
MLS# 226066276Listed by: KB HOME SALES-NORTHERN CALIFORNIA INC $709,990Active4 beds 3 baths2,300 sq. ft.
2055 Shoreline Drive, Riverbank, CA 95367
MLS# 226066277Listed by: KB HOME SALES-NORTHERN CALIFORNIA INC $569,990Pending4 beds 3 baths2,069 sq. ft.
3817 Popolari Way, Modesto, CA 95357
MLS# 226066278Listed by: KB HOME SALES-NORTHERN CALIFORNIA INC $599,900Active3 beds 2 baths1,616 sq. ft.
4701 Lone Tree Road, Valley Home, CA 95361
MLS# 226066235Listed by: PMZ REAL ESTATE- Open Sun, 1 to 3pm
 $557,000Active3 beds 2 baths1,682 sq. ft.
1149 River Bluff, Oakdale, CA 95361
MLS# MC26113275Listed by: NEXTHOME D&G REALTY GROUP  $649,900Active4 beds 3 baths2,519 sq. ft.
3934 Sterling Oaks Drive, Turlock, CA 95382
MLS# 226066029Listed by: POWERHOUSE REALTY- Open Thu, 11am to 4pm
 $499,490Pending4 beds 3 baths1,898 sq. ft.
237 Teton Ranch Way, Patterson, CA 95363
MLS# 226066001Listed by: D R HORTON AMERICA'S BUILDER  $400,000Pending3 beds 2 baths1,257 sq. ft.
1900 Temescal Drive, Modesto, CA 95355
MLS# 226065916Listed by: PMZ REAL ESTATE $439,000Pending4 beds 2 baths1,716 sq. ft.
234 S Lee Avenue, Oakdale, CA 95361
MLS# 226065887Listed by: J.PETER REALTORS $264,000Pending2 beds 2 baths1,347 sq. ft.
2700 Macdougal Street #1, Modesto, CA 95350
MLS# 226063702Listed by: HOMESMART PV & ASSOCIATES $475,000Active3 beds 2 baths1,432 sq. ft.
3129 Otis, Modesto, CA 95350
MLS# 226065910Listed by: RE/MAX EXECUTIVE $495,000Active3 beds 2 baths1,553 sq. ft.
117 Hintze, Modesto, CA 95354
MLS# 226065883Listed by: HOMESMART PV & ASSOCIATES $499,900Pending3 beds 2 baths1,456 sq. ft.
550 Bell Street, Turlock, CA 95380
MLS# 226065914Listed by: HYPE REAL ESTATE $434,999Pending3 beds 2 baths1,186 sq. ft.
3832 Moorea Drive, Modesto, CA 95356
MLS# 226065780Listed by: REAL BROKER $459,900Active3 beds 2 baths1,333 sq. ft.
1204 Maple Drive, Oakdale, CA 95361
MLS# 226043461Listed by: CENTRAL CALIFORNIA REALTY $449,900Pending3 beds 2 baths1,595 sq. ft.
2420 Christiansen Court, Modesto, CA 95355
MLS# 226063480Listed by: VALLEY OAK REAL ESTATE $449,900Pending3 beds 2 baths1,156 sq. ft.
2832 Fowler Road, Ceres, CA 95307
MLS# 226065602Listed by: TAG REALTY INC $433,000Pending4 beds 2 baths1,308 sq. ft.
201 Barozzi Avenue, Modesto, CA 95351
MLS# 226062644Listed by: HOMESMART PV & ASSOCIATES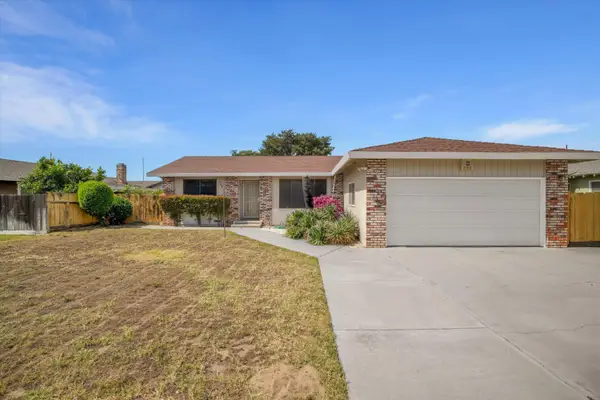 $415,000Pending3 beds 2 baths1,425 sq. ft.
631 W Minnesota Avenue, Turlock, CA 95382
MLS# 226065106Listed by: GREAT CENTRAL REALTY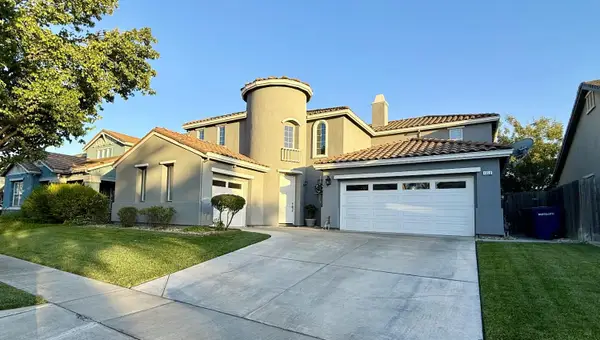 $560,000Active4 beds 3 baths2,943 sq. ft.
1350 Snake Creek Drive, Patterson, CA 95363
MLS# 226065245Listed by: SILVERTREE PROPERTIES $389,900Active2 beds 2 baths1,183 sq. ft.
1826 Monticello Avenue, Modesto, CA 95350
MLS# 226065463Listed by: HYPE REAL ESTATE $489,900Active4 beds 3 baths2,377 sq. ft.
1212 Shearwater Drive, Patterson, CA 95363
MLS# 226065564Listed by: PMZ REAL ESTATE $410,000Pending3 beds 2 baths1,165 sq. ft.
2675 Jeannie Court, Turlock, CA 95382
MLS# 226065604Listed by: PMZ REAL ESTATE $469,000Active4 beds 2 baths1,288 sq. ft.
4216 San Marino Drive, Salida, CA 95368
MLS# 226065625Listed by: HOMESMART PV & ASSOCIATES $50,000Active0.25 Acres
0 Morton Davis Drive, Patterson, CA 95363
MLS# 226065581Listed by: HOMESMART PV & ASSOCIATES $425,000Pending3 beds 2 baths1,626 sq. ft.
429 Chaffee Ln, Waterford, CA 95386
MLS# 41135756Listed by: EXP REALTY OF CALIFORNIA, INC $379,000Active3 beds 3 baths1,802 sq. ft.
9348 Vintner Circle, Patterson, CA 95363
MLS# 41135689Listed by: KELLER WILLIAMS REALTY $240,000Active2 beds 1 baths810 sq. ft.
2505 Prescott Road #1, Modesto, CA 95350
MLS# ML82048284Listed by: REAL BROKERAGE TECHNOLOGIES $430,000Pending3 beds 2 baths1,246 sq. ft.
2920 Laramie Drive, Modesto, CA 95355
MLS# 226063032Listed by: REDFIN CORPORATION $435,000Active3 beds 2 baths1,352 sq. ft.
1226 Chehalem Drive, Modesto, CA 95350
MLS# 226065387Listed by: GNN REAL ESTATE $25,000Active1 beds 1 baths500 sq. ft.
425 Twentieth Century #A-04, Turlock, CA 95380
MLS# 226013032Listed by: BELLA DANIEL, BROKER $439,000Active4 beds 2 baths1,278 sq. ft.
154 Brook Hallow Dr, Patterson, CA 95363
MLS# 226064895Listed by: MATEL REALTORS $525,000Pending3 beds 2 baths1,616 sq. ft.
3920 Michelle Lynn Court, Turlock, CA 95382
MLS# 226065327Listed by: CENTURY 21 SELECT REAL ESTATE $465,000Active3 beds 2 baths1,336 sq. ft.
2304 Coston Avenue, Modesto, CA 95350
MLS# 226065360Listed by: PRESTIGE REALTY $415,000Active3 beds 2 baths1,182 sq. ft.
4309 Songbird Court, Modesto, CA 95355
MLS# 226065364Listed by: INTERO REAL ESTATE SERVICES $659,000Active4 beds 3 baths3,776 sq. ft.
725 Oxalis Drive, Newman, CA 95360
MLS# ML82047542Listed by: EZYMAX REALTY INC $615,000Active4 beds 2 baths2,352 sq. ft.
3820 Chedworth Lane, Modesto, CA 95355
MLS# 226064747Listed by: HOMESMART PV & ASSOCIATES $174,999Active3 beds 2 baths1,621 sq. ft.
200 Santa Fe Drive #3, Empire, CA 95319
MLS# 226065076Listed by: REALTY EXECUTIVES OF NORTHERN CALIFORNIA $584,000Pending5 beds 3 baths2,752 sq. ft.
3704 Havenhurst Court, Modesto, CA 95355
MLS# 226065181Listed by: HOMESMART PV & ASSOCIATES $96,000Active2 beds 2 baths1,344 sq. ft.
24 Schooner Lane, Modesto, CA 95356
MLS# 226065348Listed by: EXIT REALTY CONSULTANTS $469,000Active3 beds 2 baths1,453 sq. ft.
301 Goldrun Drive, Modesto, CA 95354
MLS# 226063938Listed by: PMZ REAL ESTATE $611,000Active3 beds 2 baths1,757 sq. ft.
2413 Edgebrook Drive, Modesto, CA 95354
MLS# 226065041Listed by: RE/MAX GOLD COAST REALTY $1,249,000Active4 beds 5 baths3,706 sq. ft.
10401 Golf Link Road, Turlock, CA 95380
MLS# 226065132Listed by: ADROIT REAL ESTATE $1,399,900Active5 beds 4 baths4,960 sq. ft.
10717 Goldsborough Circle, Oakdale, CA 95361
MLS# 226065109Listed by: J.PETER REALTORS
Local realty services provided by:CENTURY 21 Masters, CENTURY 21 Select Real Estate, Inc., CENTURY 21 Top Dog Properties, CENTURY 21 Coastal Properties, CENTURY 21 Epic, CENTURY 21 Sierra Properties, CENTURY 21 Baldini Real Estate, Inc.
Bay East 2026. CCAR 2026 bridgeMLS 2026. Information Deemed Reliable But Not Guaranteed. This information is being provided by the Bay East MLS, or CCAR MLS, or bridgeMLS. The listings presented here may or may not be listed by the Broker/Agent operating this website. This information is intended for the personal use of consumers and may not be used for any purpose other than to identify prospective properties consumers may be interested in purchasing. Data last updated at June 10, 2026 CAMAXMLS Member Broker: Romeo Aurelio
MetroList MLS 2026. This information is being provided by MetroList MLS. All measurements and calculations of area are approximate. Information provided by Seller/Other sources, not verified by Broker. All interested persons should independently verify accuracy of information. Provided properties may or may not be listed by the office/agent presenting the information. Data Updated: June 9, 2026. Information being provided is for consumers' personal, non-commercial use and may not be used for any purpose other than to identify prospective properties consumers may be interested in purchasing. Information deemed reliable but not guaranteed. Any offer of compensation is made only to Participants of MLS where the subject listing is filed and in accordance with such MLS's regulations or rules. MFMLS Member Broker: Mike Southwick
The information being provided by California Regional MLS (Southern California) is for the consumer's personal, non-commercial use and may not be used for any purpose other than to identify prospective properties consumer may be interested in purchasing. Any information relating to real estate for sale referenced on this web site comes from the Internet Data Exchange (IDX) program of the California Regional MLS (Southern California). CENTURY 21 Coastal Properties is not a Multiple Listing Service (MLS), nor does it offer MLS access. This website is a service of CENTURY 21 Coastal Properties, a broker participant of California Regional MLS (Southern California). This web site may reference real estate listing(s) held by a brokerage firm other than the broker and/or agent who owns this web site.
The accuracy of all information, regardless of source, including but not limited to open house information, square footages and lot sizes, is deemed reliable but not guaranteed and should be personally verified through personal inspection by and/or with the appropriate professionals. The data contained herein is copyrighted by California Regional MLS (Southern California) and is protected by all applicable copyright laws. Any unauthorized dissemination of this information is in violation of copyright laws and is strictly prohibited.
Copyright 2021 California Regional MLS (Southern California). All rights reserved. CRMLS Member Broker: Jennette Toderick
The information being provided by Bay Area Real Estate Information Service is for the consumer's personal, non-commercial use and may not be used for any purpose other than to identify prospective properties consumer may be interested in purchasing. Any information relating to real estate for sale referenced on this web site comes from the Internet Data Exchange (IDX) program of the Bay Area Real Estate Information Service. CENTURY 21 Epic is not a Multiple Listing Service (MLS), nor does it offer MLS access. This website is a service of CENTURY 21 Epic, a broker participant of Bay Area Real Estate Information Service. This web site may reference real estate listing(s) held by a brokerage firm other than the broker and/or agent who owns this web site.
The accuracy of all information, regardless of source, including but not limited to open house information, square footages and lot sizes, is deemed reliable but not guaranteed and should be personally verified through personal inspection by and/or with the appropriate professionals. The data contained herein is copyrighted by Bay Area Real Estate Information Service and is protected by all applicable copyright laws. Any unauthorized dissemination of this information is in violation of copyright laws and is strictly prohibited.
Properties in listings may have been sold or may no longer be available.
Copyright 2026 Bay Area Real Estate Information Service. All rights reserved. CABAREIS Member Broker: Mike Southwick
The information being provided by San Francisco Association of REALTORS is for the consumer's personal, non-commercial use and may not be used for any purpose other than to identify prospective properties consumer may be interested in purchasing. Any information relating to real estate for sale referenced on this web site comes from the Internet Data Exchange (IDX) program of the San Francisco Association of REALTORS. This web site may reference real estate listing(s) held by a brokerage firm other than the broker and/or agent who owns this web site. The accuracy of all information, regardless of source, including but not limited to open house information, square footages and lot sizes, is deemed reliable but not guaranteed and should be personally verified through personal inspection by and/or with the appropriate professionals. The data contained herein is copyrighted by San Francisco Association of REALTORS and is protected by all applicable copyright laws. Any unauthorized dissemination of this information is in violation of copyright laws and is strictly prohibited.
Popular searches near Stanislaus County, CA
Popular neighborhoods near Stanislaus County, CA
- Airport, Stockton homes for sale
- Bellevue Ranch Village, Merced homes for sale
- Downtown, Modesto homes for sale
- Elissagaray Ranch, Tracy homes for sale
- Fair Oaks, Stockton homes for sale
- Garden Acres, Stockton homes for sale
- Glenbriar Estates, Tracy homes for sale
- Graceada Park, Modesto homes for sale
- Hearthstone, Tracy homes for sale
- Kennedy, Stockton homes for sale
- La Loma, Modesto homes for sale
- Lincoln Square, Modesto homes for sale
- McKinley Park, Stockton homes for sale
- Mossale Landing City of Lathrop, Lathrop homes for sale
- Park, Stockton homes for sale
- Patterson Gardens, Patterson homes for sale
- Sylvan Meadows East, Modesto homes for sale
- Union Ranch, Manteca homes for sale
- Vintage Modesto East McHenry, Modesto homes for sale
- Walker Ranch, Patterson homes for sale
Zip codes near Stanislaus County, CA
- 95307 homes for sale
- 95313 homes for sale
- 95315 homes for sale
- 95316 homes for sale
- 95319 homes for sale
- 95323 homes for sale
- 95324 homes for sale
- 95326 homes for sale
- 95328 homes for sale
- 95350 homes for sale
- 95351 homes for sale
- 95354 homes for sale
- 95355 homes for sale
- 95356 homes for sale
- 95357 homes for sale
- 95358 homes for sale
- 95367 homes for sale
- 95368 homes for sale
- 95380 homes for sale
- 95382 homes for sale
Protect your home and budget from life's surprises with an Assurant Home Warranty, backed by a partner that supports you through every step of homeownership. Explore Plans.
©2026 Century 21 Real Estate LLC. All rights reserved. CENTURY 21®, the CENTURY 21 Logo and C21® are service marks owned by Century 21 Real Estate LLC. Century 21 Real Estate LLC fully supports the principles of the Fair Housing Act and the Equal Opportunity Act. Each office is independently owned and operated. Listing information is deemed reliable but not guaranteed accurate.