- Big Sky, Lake In The Hills homes for sale
- Big Woods Marmion, Aurora homes for sale
- Cambridge Lakes, Pingree Grove homes for sale
- Century Oaks West, Elgin homes for sale
- Cobblers Crossing, Elgin homes for sale
- Dundee, Carpentersville homes for sale
- English Valley, Palatine homes for sale
- Greenfields, Cary homes for sale
- High Hill Farms, Algonquin homes for sale
- Ivy Hill, Arlington Heights homes for sale
- Lake Barrington Shores, Lake Barrington homes for sale
- Lake in the Hills Estates, Lake In The Hills homes for sale
- Oak Knoll Farms, Streamwood homes for sale
- Providence, Elgin homes for sale
- Streamwood Green, Streamwood homes for sale
- Weathersfield West, Schaumburg homes for sale
- Westgate, Arlington Heights homes for sale
- Winston Park Northwest, Palatine homes for sale
- Woodland Heights, Streamwood homes for sale
- Wynstone, North Barrington homes for sale
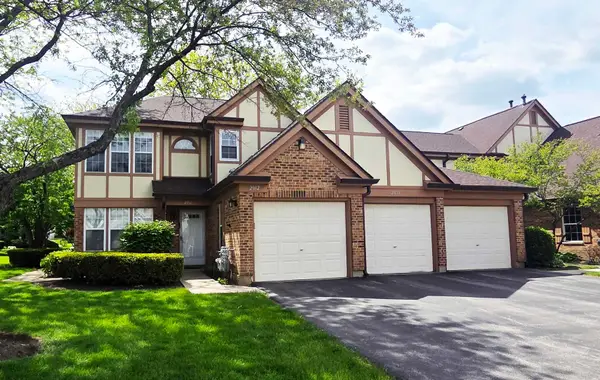
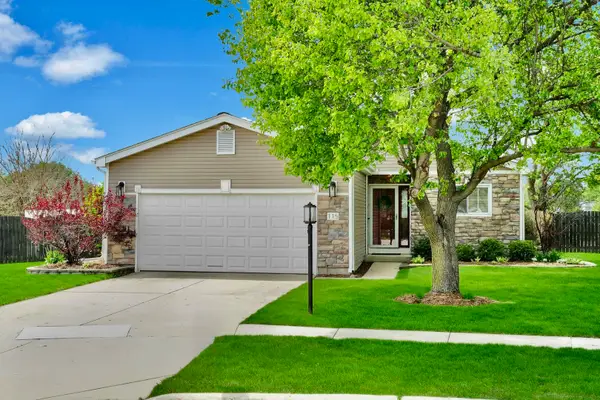
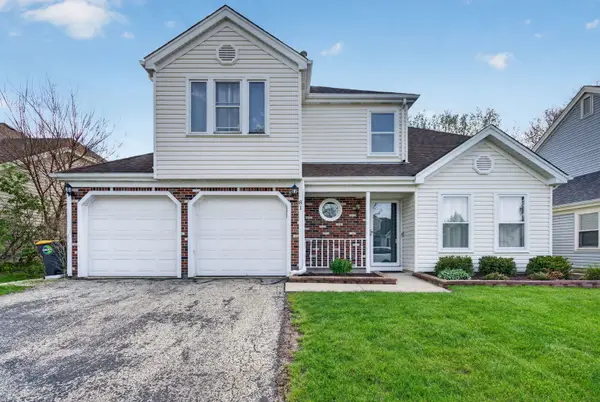
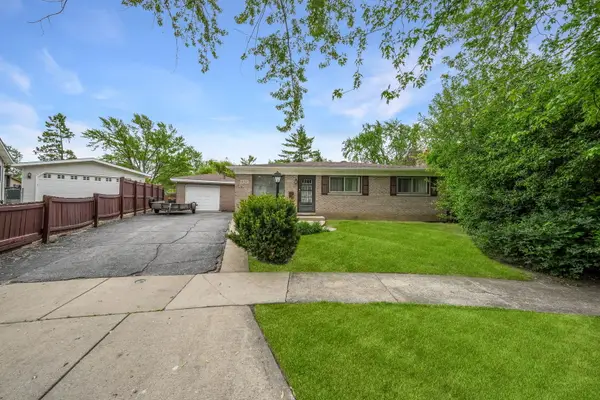
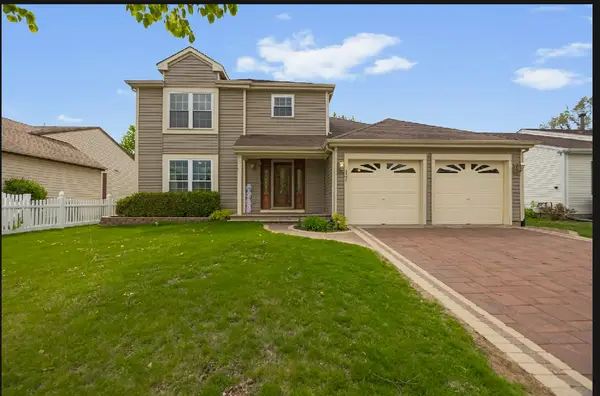
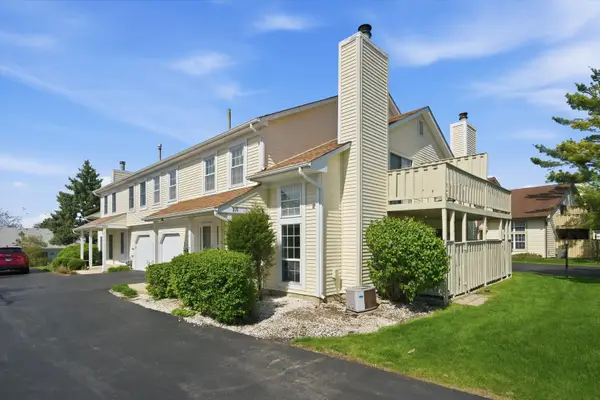
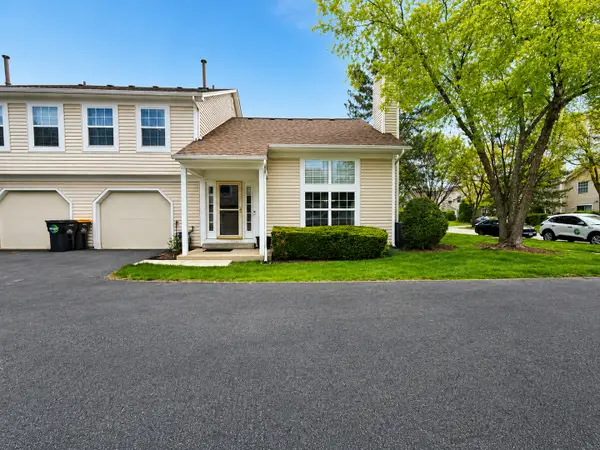
Streamwood, IL - homes for sale
99 of 99 results displayed
- Open Sat, 11am to 1pmNew
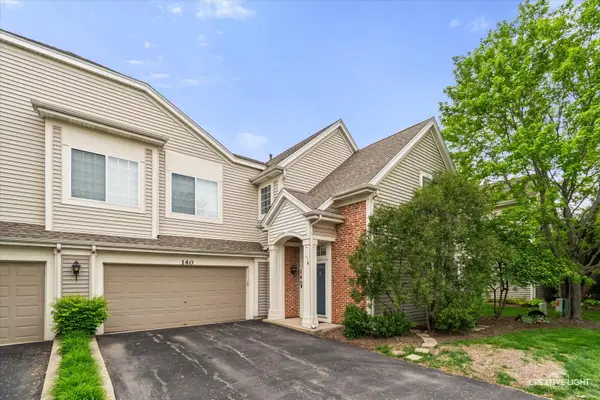 $295,000Active2 beds 2 baths1,300 sq. ft.
140 Heritage Lane, Streamwood, IL 60107
MLS# 12617832Listed by: INSPIRE REALTY GROUP LLC
- Open Sat, 12 to 2pmNew
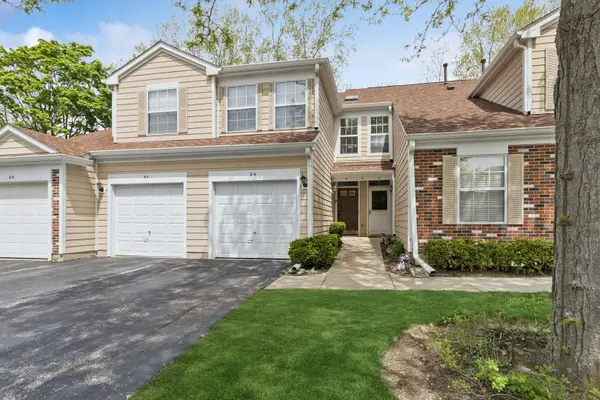 $279,999Active2 beds 2 baths1,312 sq. ft.
8 Tyler Court #B, Streamwood, IL 60107
MLS# 12636859Listed by: BAIRD & WARNER - New
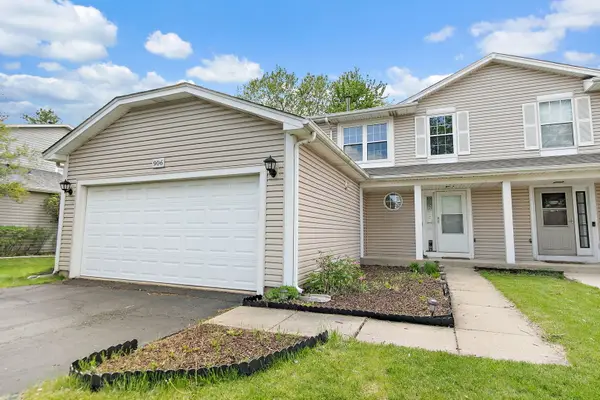 $375,000Active3 beds 2 baths1,662 sq. ft.
906 Oak Ridge Drive, Streamwood, IL 60107
MLS# 12639211Listed by: LEGACY PROPERTIES, A SARAH LEONARD COMPANY, LLC - Open Sat, 11am to 1pmNew
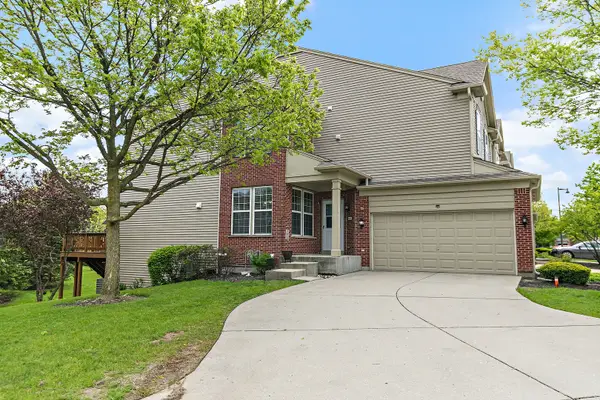 $389,900Active3 beds 3 baths2,171 sq. ft.
1566 Yellowstone Drive, Streamwood, IL 60107
MLS# 12623229Listed by: ROYAL FAMILY REAL ESTATE - New
 $299,999Active3 beds 2 baths1,550 sq. ft.
2012 Quaker Hollow Lane, Streamwood, IL 60107
MLS# 12641040Listed by: BARR AGENCY, INC - New
 $448,500Active3 beds 3 baths1,400 sq. ft.
115 Abbeywood Circle, Streamwood, IL 60107
MLS# 12614391Listed by: RE/MAX LIBERTY - New
 $384,900Active4 beds 2 baths1,524 sq. ft.
81 Washington Avenue, Streamwood, IL 60107
MLS# 12608474Listed by: CENTURY 21 INTEGRA - New
 $319,000Active3 beds 1 baths1,092 sq. ft.
6 Ironwood Court, Streamwood, IL 60107
MLS# 12639942Listed by: COMPASS - New
 $350,000Active3 beds 2 baths1,064 sq. ft.
602 Bluff Court, Streamwood, IL 60107
MLS# 12640425Listed by: REMAX LEGENDS - New
 $285,000Active2 beds 2 baths1,300 sq. ft.
139 Brittany Drive, Streamwood, IL 60107
MLS# 12625183Listed by: MISTERHOMES REAL ESTATE - New
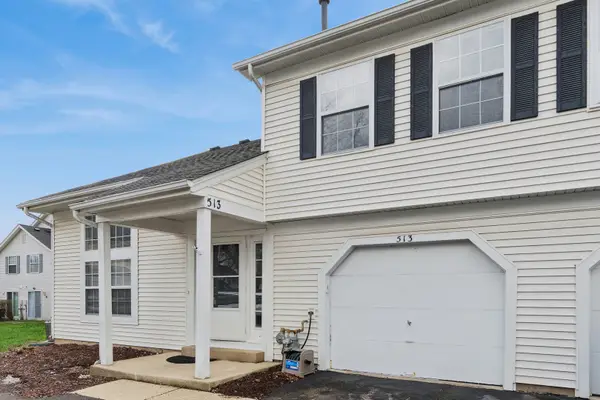 $275,000Active2 beds 2 baths1,133 sq. ft.
513 East Avenue #513, Streamwood, IL 60107
MLS# 12639769Listed by: BAIRD & WARNER - New
 $298,000Active2 beds 2 baths1,021 sq. ft.
232 Whitewood Drive, Streamwood, IL 60107
MLS# 12639574Listed by: BERKSHIRE HATHAWAY HOMESERVICES CHICAGO - New
 $269,900Active2 beds 2 baths1,100 sq. ft.
126 Winchester Drive #B, Streamwood, IL 60107
MLS# 12638469Listed by: HOMESMART CONNECT LLC - Open Sat, 11am to 1pmNew
 $437,999Active3 beds 3 baths1,898 sq. ft.
17 Buchanan Lane, Streamwood, IL 60107
MLS# 12634945Listed by: BERKSHIRE HATHAWAY HOMESERVICES STARCK REAL ESTATE - New
 $299,000Active3 beds 2 baths1,178 sq. ft.
216 Whitewood Drive, Streamwood, IL 60107
MLS# 12633301Listed by: KELLER WILLIAMS INFINITY 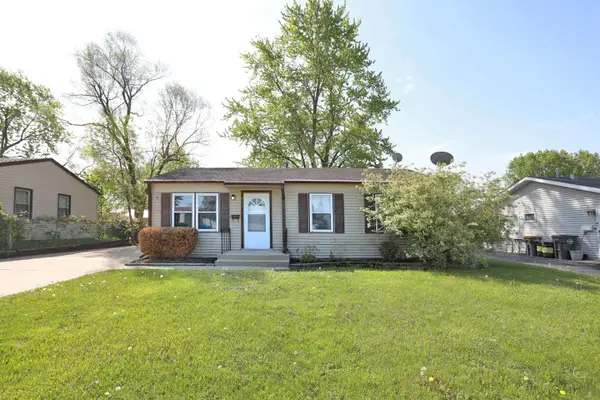 $260,000Pending3 beds 1 baths913 sq. ft.
111 Elm Lane, Streamwood, IL 60107
MLS# 12634635Listed by: RE/MAX SUBURBAN- Open Sun, 12 to 2pmNew
 $279,900Active2 beds 2 baths1,133 sq. ft.
250 Acorn Drive, Streamwood, IL 60107
MLS# 12635716Listed by: XR REALTY - New
 $374,900Active2 beds 3 baths2,202 sq. ft.
1327 Laurel Oaks Drive, Streamwood, IL 60107
MLS# 12631830Listed by: REDFIN CORPORATION - New
 $297,000Active3 beds 2 baths1,549 sq. ft.
63 Tyler Court #B, Streamwood, IL 60107
MLS# 12634121Listed by: COLDWELL BANKER REALTY - New
 $299,500Active3 beds 1 baths913 sq. ft.
108 Walnut Drive, Streamwood, IL 60107
MLS# 12635260Listed by: AMR REAL ESTATE  $400,000Pending3 beds 4 baths2,966 sq. ft.
1354 Laurel Oaks Drive, Streamwood, IL 60107
MLS# 12624963Listed by: @PROPERTIES CHRISTIE'S INTERNATIONAL REAL ESTATE $449,900Pending3 beds 3 baths1,898 sq. ft.
7 Arthur Court, Streamwood, IL 60107
MLS# 12632113Listed by: DUARTE REALTY COMPANY- New
 $419,999Active3 beds 2 baths1,645 sq. ft.
158 Jefferson Lane, Streamwood, IL 60107
MLS# 12633420Listed by: XHOMES REALTY INC  $375,000Pending3 beds 2 baths1,600 sq. ft.
26 Ascot Lane, Streamwood, IL 60107
MLS# 12623223Listed by: BAIRD & WARNER FOX VALLEY - GENEVA $269,500Pending2 beds 2 baths1,272 sq. ft.
565 Ascot Lane, Streamwood, IL 60107
MLS# 12629680Listed by: KELLER WILLIAMS THRIVE $269,000Pending3 beds 2 baths1,312 sq. ft.
117 Virginia Court, Streamwood, IL 60107
MLS# 12634624Listed by: REALTY OF AMERICA, LLC $389,900Pending2 beds 3 baths1,983 sq. ft.
908 Elizabeth Drive, Streamwood, IL 60107
MLS# 12630104Listed by: YOUR HOUSE REALTY $274,900Active2 beds 2 baths1,133 sq. ft.
511 East Avenue #511, Streamwood, IL 60107
MLS# 12629593Listed by: AMIS REAL ESTATE,, INC. $250,000Pending3 beds 2 baths1,043 sq. ft.
4096 Quincy Court, Streamwood, IL 60107
MLS# 12629468Listed by: RE/MAX HORIZON $389,900Active3 beds 3 baths1,632 sq. ft.
1413 Yellowstone Drive, Streamwood, IL 60107
MLS# 12611377Listed by: REMAX LEGENDS $750,000Pending5 beds 5 baths3,158 sq. ft.
5 Orchid Court, Streamwood, IL 60107
MLS# 12617957Listed by: REDFIN CORPORATION $378,900Pending3 beds 2 baths1,752 sq. ft.
216 Iris Drive, Streamwood, IL 60107
MLS# 12625555Listed by: ILLINOIS REAL ESTATE PARTNERS INC $267,500Pending2 beds 2 baths1,235 sq. ft.
74 Marion Lane, Streamwood, IL 60107
MLS# 12625676Listed by: RE/MAX SUBURBAN $300,000Pending3 beds 2 baths945 sq. ft.
111 S Bartlett Road, Streamwood, IL 60107
MLS# 12611881Listed by: EXP REALTY - GENEVA $460,000Pending4 beds 4 baths2,284 sq. ft.
18 Ascot Lane, Streamwood, IL 60107
MLS# 12626379Listed by: @PROPERTIES CHRISTIE'S INTERNATIONAL REAL ESTATE $299,000Active2 beds 2 baths1,082 sq. ft.
1310 Beverly Lane, Streamwood, IL 60107
MLS# 12620668Listed by: @PROPERTIES CHRISTIE'S INTERNATIONAL REAL ESTATE $299,900Pending3 beds 2 baths
220 Whitewood Drive, Streamwood, IL 60107
MLS# 12624015Listed by: VESTA PREFERRED LLC $300,000Pending2 beds 2 baths1,250 sq. ft.
1914 Quaker Hollow Lane, Streamwood, IL 60107
MLS# 12626399Listed by: YOUR REALTY LLC $350,000Pending4 beds 2 baths925 sq. ft.
604 Newberry Drive, Streamwood, IL 60107
MLS# 12615960Listed by: HOMESMART CONNECT LLC $325,000Pending3 beds 1 baths913 sq. ft.
910 Meadow Lane, Streamwood, IL 60107
MLS# 12625876Listed by: PRESTIGE REALTY GROUP $349,900Pending2 beds 1 baths1,129 sq. ft.
813 Parkside Court, Streamwood, IL 60107
MLS# 12618635Listed by: HOMESMART REALTY GROUP $345,000Pending3 beds 3 baths1,804 sq. ft.
81 King Drive, Streamwood, IL 60107
MLS# 12624898Listed by: REAL BROKER LLC $295,000Pending3 beds 3 baths1,650 sq. ft.
304 Monarch Drive, Streamwood, IL 60107
MLS# 12625762Listed by: REAL 1 REALTY $249,000Pending3 beds 2 baths1,200 sq. ft.
2022 Duxbury Court #2022, Streamwood, IL 60107
MLS# 12601679Listed by: PROPERTY ECONOMICS INC. $279,900Pending2 beds 2 baths1,211 sq. ft.
7 Adams Court, Streamwood, IL 60107
MLS# 12604884Listed by: KELLER WILLIAMS NORTH SHORE WEST $319,900Pending3 beds 2 baths986 sq. ft.
814 Oriole Drive, Streamwood, IL 60107
MLS# 12617744Listed by: RE/MAX LIBERTY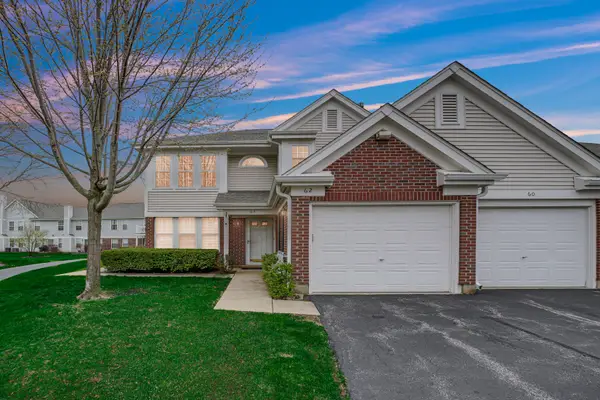 $250,000Pending3 beds 2 baths1,400 sq. ft.
62 Winding Run Lane #62, Streamwood, IL 60107
MLS# 12621754Listed by: COMPASS $295,000Pending2 beds 2 baths1,090 sq. ft.
1148 Fulton Drive, Streamwood, IL 60107
MLS# 12618308Listed by: RE/MAX SUBURBAN $354,900Pending3 beds 3 baths1,940 sq. ft.
500 Ascot Lane, Streamwood, IL 60107
MLS# 12621489Listed by: BERKSHIRE HATHAWAY HOMESERVICES STARCK REAL ESTATE $329,990Pending3 beds 2 baths1,800 sq. ft.
113 Meredith Lane #10-3, Streamwood, IL 60107
MLS# 12578211Listed by: COLDWELL BANKER REALTY $261,000Pending3 beds 1 baths1,156 sq. ft.
Address Withheld By Seller, Streamwood, IL 60107
MLS# 12552652Listed by: KELLER WILLIAMS SUCCESS REALTY $475,000Pending4 beds 4 baths2,570 sq. ft.
121 Augusta Drive, Streamwood, IL 60107
MLS# 12614663Listed by: REAL BROKER LLC $474,900Pending4 beds 3 baths2,049 sq. ft.
138 Emerald Drive, Streamwood, IL 60107
MLS# 12621111Listed by: RE/MAX SUBURBAN $244,900Active2 beds 1 baths1,193 sq. ft.
704 Lincolnwood Drive, Streamwood, IL 60107
MLS# 12620786Listed by: LPT REALTY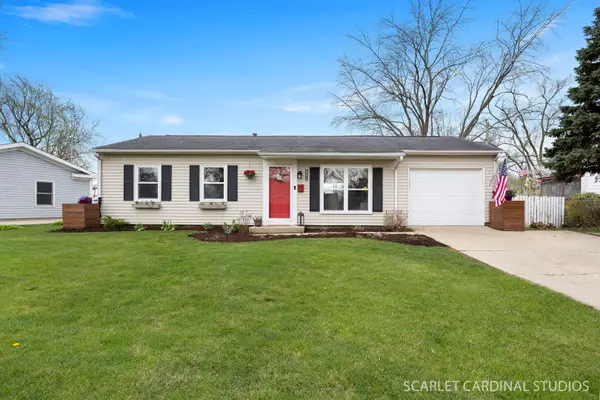 $315,000Pending3 beds 1 baths893 sq. ft.
801 Sunset Circle, Streamwood, IL 60107
MLS# 12616111Listed by: KELLER WILLIAMS PREMIERE PROPERTIES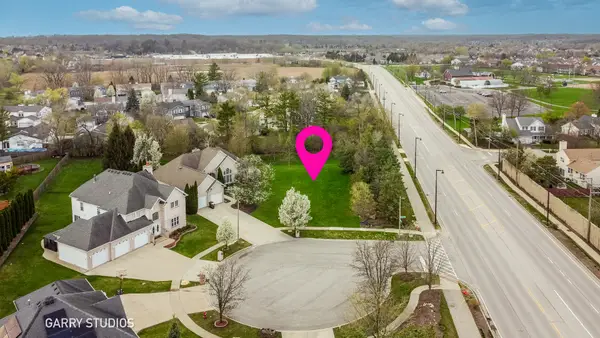 $119,896Active0.3 Acres
2 Osprey Court, Streamwood, IL 60107
MLS# 12619222Listed by: GARRY REAL ESTATE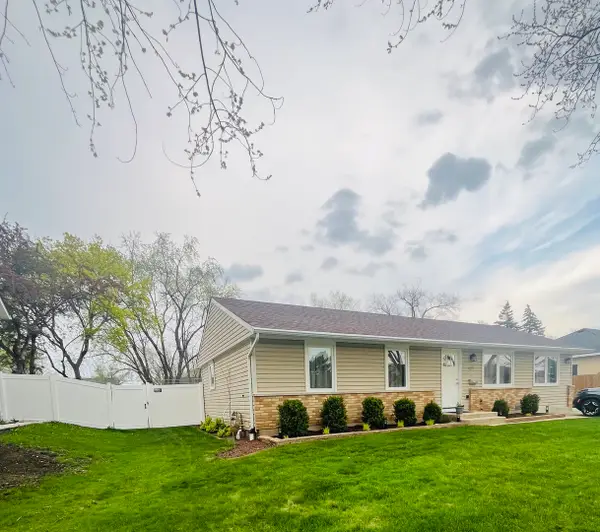 $321,999Pending2 beds 1 baths1,465 sq. ft.
621 Hayward Avenue, Streamwood, IL 60107
MLS# 12619366Listed by: COLDWELL BANKER REAL ESTATE GROUP $295,900Active2 beds 2 baths
254 Acorn Drive, Streamwood, IL 60107
MLS# 12607260Listed by: JAM REALTY CO $339,900Pending4 beds 2 baths1,425 sq. ft.
803 E Streamwood Boulevard, Streamwood, IL 60107
MLS# 12616187Listed by: EHOMES REALTY, LTD $324,900Pending3 beds 3 baths1,547 sq. ft.
425 Locksley Drive, Streamwood, IL 60107
MLS# 12615699Listed by: RE/MAX PREMIER LUXURY COLLECTION $319,000Pending3 beds 3 baths2,000 sq. ft.
171 Monarch Drive, Streamwood, IL 60107
MLS# 12615579Listed by: XR REALTY $399,900Pending3 beds 3 baths2,987 sq. ft.
Address Withheld By Seller, Streamwood, IL 60107
MLS# 12611718Listed by: HAUS & BODEN, LTD. $294,990Pending2 beds 2 baths1,052 sq. ft.
1903 Quaker Hollow Lane, Streamwood, IL 60107
MLS# 12596525Listed by: KELLER WILLIAMS ONECHICAGO $369,900Pending2 beds 3 baths2,345 sq. ft.
1476 Laurel Oaks Drive, Streamwood, IL 60107
MLS# 12612599Listed by: PROVIDENT REALTY, INC. $629,900Active6 beds 4 baths2,346 sq. ft.
4 Waterton Drive, Streamwood, IL 60107
MLS# 12614700Listed by: COMPASS $254,900Pending2 beds 2 baths1,182 sq. ft.
25 N Oltendorf Road, Streamwood, IL 60107
MLS# 12613728Listed by: REDFIN CORPORATION $359,900Pending4 beds 3 baths1,500 sq. ft.
1013 Sunnydale Boulevard, Streamwood, IL 60107
MLS# 12601592Listed by: PROVIDENT REALTY, INC. $375,000Pending2 beds 3 baths1,364 sq. ft.
358 Westgate Terrace, Streamwood, IL 60107
MLS# 12603978Listed by: RE/MAX LIBERTY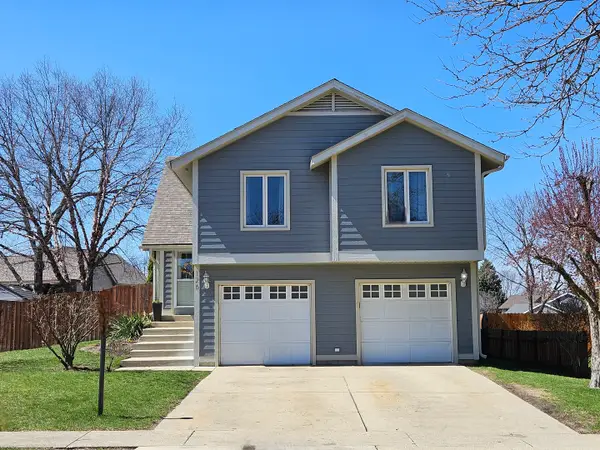 $399,900Pending3 beds 2 baths1,718 sq. ft.
126 Borris Circle, Streamwood, IL 60107
MLS# 12612495Listed by: CHICAGOLAND BROKERS, INC. $325,000Pending3 beds 2 baths1,286 sq. ft.
595 East Avenue, Streamwood, IL 60107
MLS# 12610524Listed by: @PROPERTIES CHRISTIE'S INTERNATIONAL REAL ESTATE $329,900Pending3 beds 1 baths1,360 sq. ft.
1013 Manor Drive, Streamwood, IL 60107
MLS# 12608917Listed by: @PROPERTIES CHRISTIES INTERNATIONAL REAL ESTATE $353,500Pending3 beds 3 baths1,940 sq. ft.
450 Ascot Lane, Streamwood, IL 60107
MLS# 12608964Listed by: COLDWELL BANKER REALTY $364,900Pending3 beds 2 baths1,741 sq. ft.
319 W Streamwood Boulevard, Streamwood, IL 60107
MLS# 12569678Listed by: HOMESMART CONNECT LLC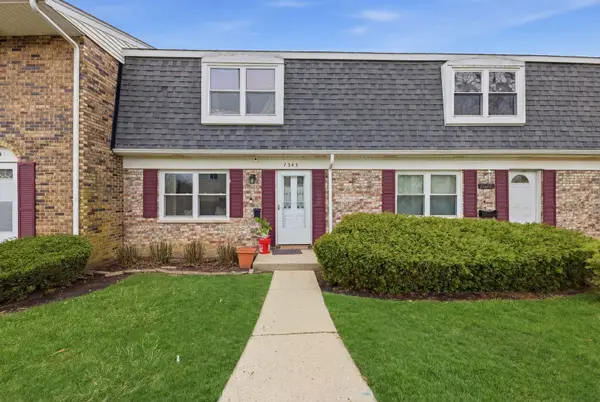 $219,900Pending2 beds 2 baths1,000 sq. ft.
1543 Mckool Avenue, Streamwood, IL 60107
MLS# 12608102Listed by: KELLER WILLIAMS ONECHICAGO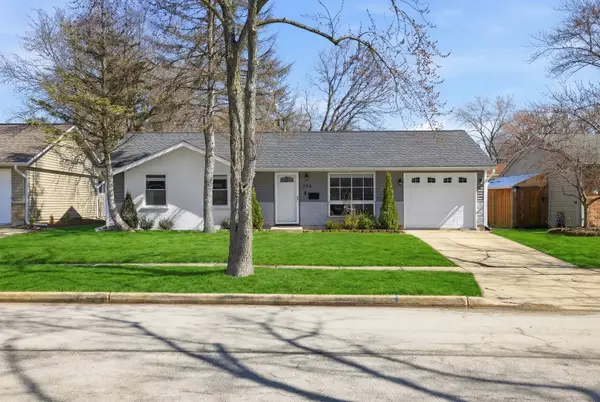 $310,000Pending3 beds 1 baths1,000 sq. ft.
205 Villa Road, Streamwood, IL 60107
MLS# 12608446Listed by: EXP REALTY $279,400Active2 beds 2 baths1,300 sq. ft.
629 W Streamwood Boulevard #B, Streamwood, IL 60107
MLS# 12607940Listed by: RE/MAX LIBERTY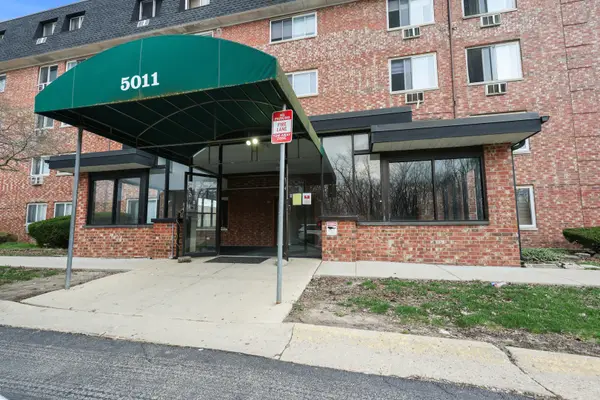 $135,000Pending1 beds 1 baths
5011 Valley Lane #204, Streamwood, IL 60107
MLS# 12606036Listed by: KELLER WILLIAMS NORTH SHORE WEST $319,000Pending3 beds 2 baths1,120 sq. ft.
700 Hayward Avenue, Streamwood, IL 60107
MLS# 12530352Listed by: DEI REALTY LLC $385,000Pending3 beds 2 baths1,661 sq. ft.
176 Jefferson Lane, Streamwood, IL 60107
MLS# 12595419Listed by: RE/MAX OF NAPERVILLE $345,000Pending3 beds 2 baths984 sq. ft.
201 W Streamwood Boulevard, Streamwood, IL 60107
MLS# 12613812Listed by: RE/MAX ACTION $264,900Pending2 beds 2 baths1,129 sq. ft.
49 Carey Lane, Streamwood, IL 60107
MLS# 12599820Listed by: KELLER WILLIAMS SUCCESS REALTY $299,000Pending2 beds 3 baths1,398 sq. ft.
627 Ascot Lane, Streamwood, IL 60107
MLS# 12601637Listed by: COMPASS $749,900Pending5 beds 4 baths4,700 sq. ft.
908 Blue Ridge Drive, Streamwood, IL 60107
MLS# 12601280Listed by: SKY HIGH REAL ESTATE INC. $222,500Pending2 beds 2 baths
703 Garden Circle #3, Streamwood, IL 60107
MLS# 12597188Listed by: ARNI REALTY INCORPORATED $329,900Pending2 beds 3 baths1,547 sq. ft.
179 Locksley Drive, Streamwood, IL 60107
MLS# 12588144Listed by: COLDWELL BANKER REALTY $329,900Pending3 beds 2 baths1,450 sq. ft.
213 Villa Road, Streamwood, IL 60107
MLS# 12606553Listed by: LEGACY PROPERTIES, A SARAH LEONARD COMPANY, LLC $299,900Pending3 beds 1 baths1,137 sq. ft.
111 Cedar Circle, Streamwood, IL 60107
MLS# 12595246Listed by: HUBENY REALTY INC $349,900Pending3 beds 2 baths992 sq. ft.
400 Country Lane, Streamwood, IL 60107
MLS# 12585076Listed by: BERKSHIRE HATHAWAY HOMESERVICES STARCK REAL ESTATE $250,000Pending2 beds 2 baths1,100 sq. ft.
741 W Streamwood Boulevard #A, Streamwood, IL 60107
MLS# 12561232Listed by: REALTY OF AMERICA $375,000Active3 beds 3 baths1,632 sq. ft.
1563 Yellowstone Drive, Streamwood, IL 60107
MLS# 12574394Listed by: ROYAL FAMILY REAL ESTATE $269,000Pending3 beds 2 baths1,096 sq. ft.
Address Withheld By Seller, Streamwood, IL 60107
MLS# 12574130Listed by: COLDWELL BANKER REALTY $319,900Pending3 beds 2 baths1,274 sq. ft.
601 Ridgewood Road, Streamwood, IL 60107
MLS# 12550015Listed by: RE/MAX SUBURBAN $365,000Pending3 beds 2 baths1,458 sq. ft.
62 Washington Avenue, Streamwood, IL 60107
MLS# 12496107Listed by: REAL BROKER, LLC $339,500Pending3 beds 2 baths1,305 sq. ft.
110 Cedar Circle, Streamwood, IL 60107
MLS# 12541200Listed by: GC REALTY AND DEVELOPMENT $220,000Pending2 beds 2 baths900 sq. ft.
Address Withheld By Seller, Streamwood, IL 60107
MLS# 12295490Listed by: CENTURY 21 CIRCLE $420,000Pending3 beds 3 baths1,603 sq. ft.
4 Aspen Court, Streamwood, IL 60107
MLS# 12516566Listed by: A M REALTY SERVICES LLC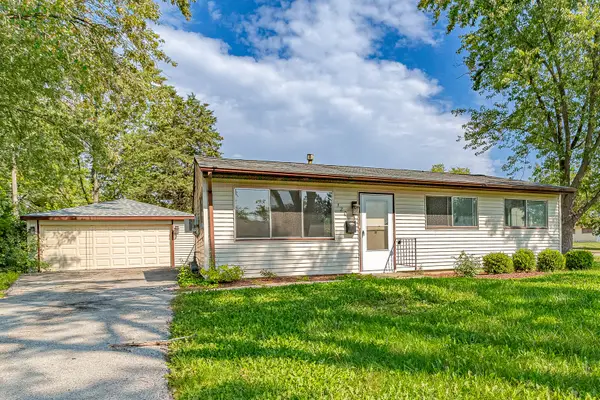 $284,500Active3 beds 1 baths1,018 sq. ft.
120 Grow Lane, Streamwood, IL 60107
MLS# 12470125Listed by: BERKSHIRE HATHAWAY HOMESERVICES AMERICAN HERITAGE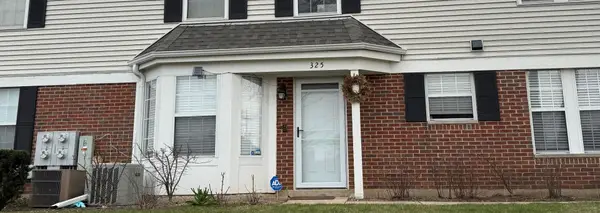 $300,000Pending2 beds 2 baths1,202 sq. ft.
325 Green Knoll Lane #325, Streamwood, IL 60107
MLS# 12594673Listed by: HOMESMART CONNECT $209,900Active0.96 Acres
305 S Bartlett Road, Streamwood, IL 60107
MLS# 11992935Listed by: FULTON GRACE REALTY
Local realty services provided by:CENTURY 21 All Pro Real Estate
Copyright 2026 Midwest Real Estate Data LLC. All rights reserved. The data relating to real estate for sale on this web site comes in part from the Broker Reciprocity Program of the Midwest Real Estate Data LLC. Listing information is deemed reliable but not guaranteed.
Neighborhoods near Streamwood, IL
Zip codes near Streamwood, IL
- 60067 homes for sale
- 60103 homes for sale
- 60107 homes for sale
- 60108 homes for sale
- 60120 homes for sale
- 60123 homes for sale
- 60133 homes for sale
- 60139 homes for sale
- 60143 homes for sale
- 60169 homes for sale
- 60172 homes for sale
- 60173 homes for sale
- 60177 homes for sale
- 60184 homes for sale
- 60185 homes for sale
- 60188 homes for sale
- 60192 homes for sale
- 60193 homes for sale
- 60194 homes for sale
- 60195 homes for sale
Popular searches near Streamwood, IL
- Barrington Township homes for sale
- Bartlett homes for sale
- Bloomingdale Township homes for sale
- Bloomingdale homes for sale
- Carol Stream homes for sale
- East Dundee homes for sale
- Elgin homes for sale
- Hanover homes for sale
- Hanover Park homes for sale
- Hoffman Estates homes for sale
- Inverness homes for sale
- Roselle homes for sale
- Schaumburg homes for sale
- Schaumburg Township homes for sale
- South Barrington homes for sale
- South Elgin homes for sale
- Wayne homes for sale
- Wayne homes for sale
- Wayne Township homes for sale
- West Dundee homes for sale
Protect your home and budget from life's surprises with an Assurant Home Warranty, backed by a partner that supports you through every step of homeownership. Explore Plans.
©2026 Century 21 Real Estate LLC. All rights reserved. CENTURY 21®, the CENTURY 21 Logo and C21® are service marks owned by Century 21 Real Estate LLC. Century 21 Real Estate LLC fully supports the principles of the Fair Housing Act and the Equal Opportunity Act. Each office is independently owned and operated. Listing information is deemed reliable but not guaranteed accurate.