- Avalon, McDonough homes for sale
- Benning Tech Park, Columbus homes for sale
- Brown's Farm, Locust Grove homes for sale
- City Square, McDonough homes for sale
- Columbus State University, Columbus homes for sale
- Deer Run, Conyers homes for sale
- Eagle's Brooke Country Club, Locust Grove homes for sale
- Eagles Landing, McDonough homes for sale
- East Carver Heights, Columbus homes for sale
- Heron Bay, Locust Grove homes for sale
- Honey Creek, Conyers homes for sale
- Lakewood Estates, Covington homes for sale
- Maple Ridge, Columbus homes for sale
- Nelson Heights, Covington homes for sale
- Old Town, Columbus homes for sale
- Rawson Park, Albany homes for sale
- The Enclave at Gross Lake, Covington homes for sale
- The Plantation, Covington Porterdale homes for sale
- Wesley Lakes, McDonough homes for sale
- Windsor Park, Columbus homes for sale
Warner Robins, GA - homes for sale
300 of 737 results displayed
- New
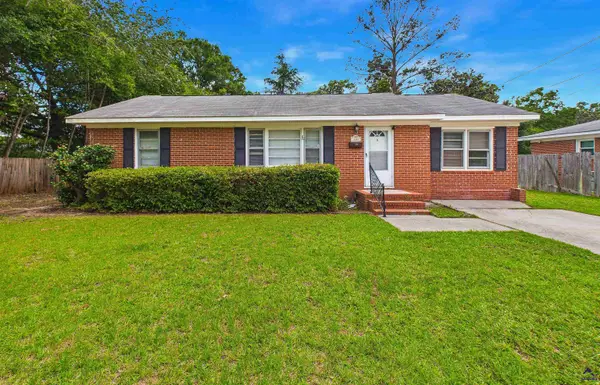
 $179,900Active3 beds 2 baths1,386 sq. ft.
307 Cherokee Drive, Warner Robins, GA 31093
MLS# 10782306Listed by: HomeSmart
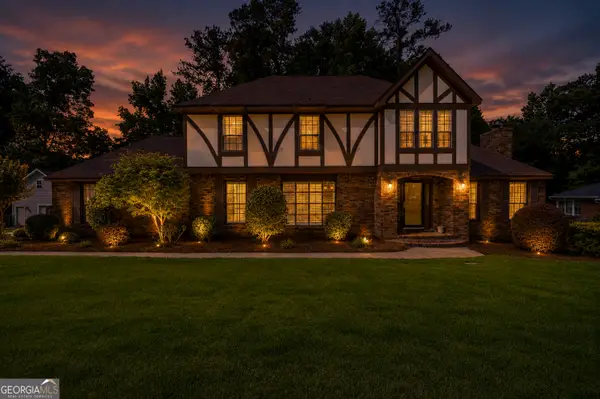
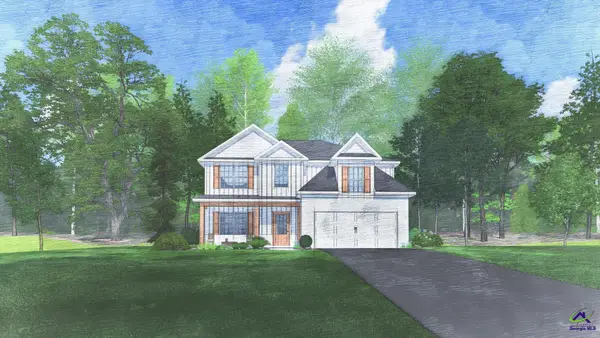
 $269,900Pending4 beds 2 baths1,694 sq. ft.
144 Logan's Mill Trail, Warner Robins, GA 31093
MLS# 263548Listed by: FHG PROPERTY MANAGEMENT LLC- New
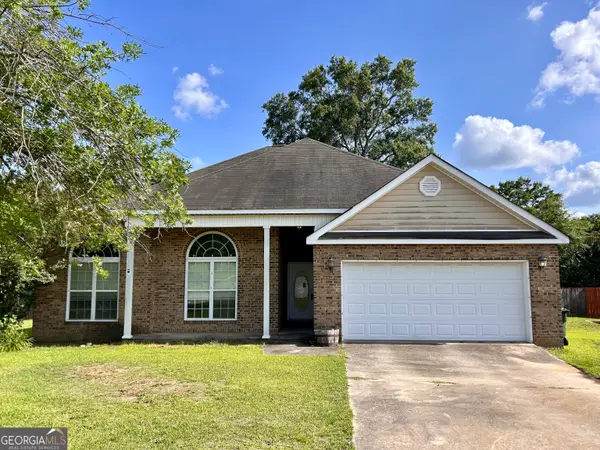
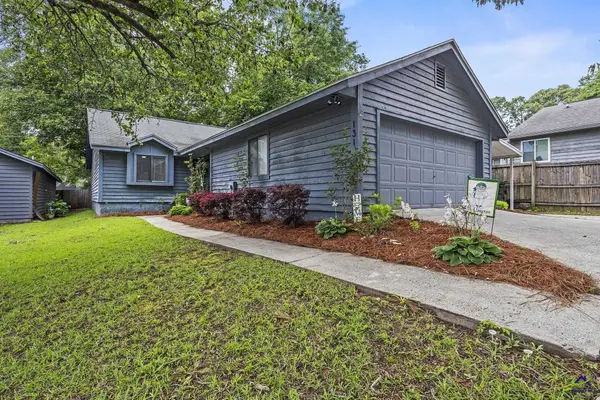
 $126,000Active3 beds 1 baths1,235 sq. ft.
124 Meadowdale Drive, Warner Robins, GA 31088
MLS# 184739Listed by: COLDWELL BANKER FREE REALTY, LLC - New
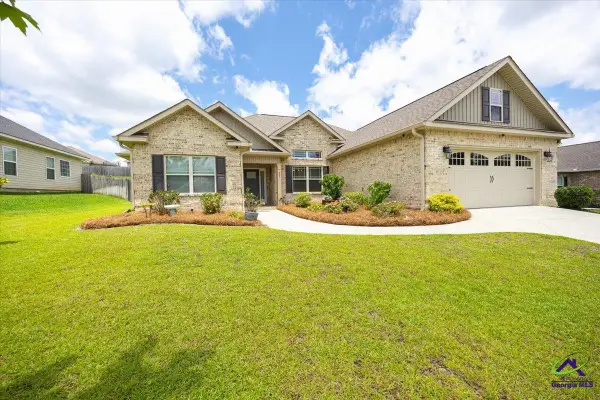
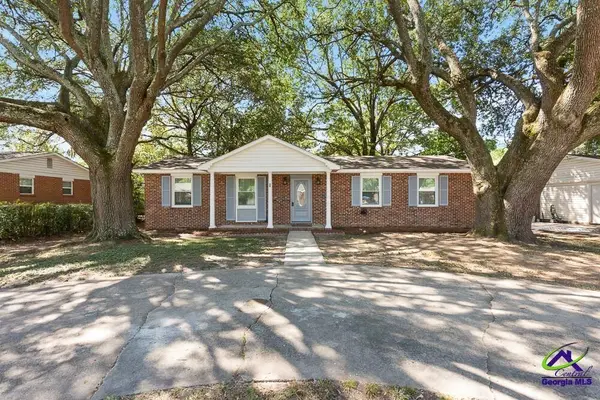
 $255,900Active3 beds 2 baths1,521 sq. ft.
137 Northsky Drive, Warner Robins, GA 31093
MLS# 10780789Listed by: Southern Classic Realtors - New
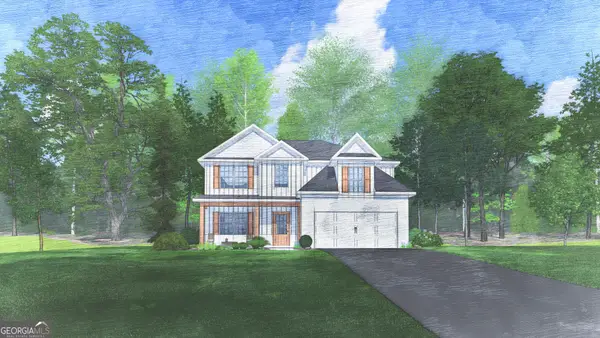
 $225,000Active3 beds 2 baths1,426 sq. ft.
121 Barnesdale Drive, Warner Robins, GA 31093
MLS# 10781558Listed by: Robins Realty Group - New
 $220,000Active3 beds 2 baths1,299 sq. ft.
103 Saint Brendands Drive, Bonaire, GA 31005
MLS# 263526Listed by: MAXIMUM ONE PLATINUM REALTORS  $409,900Active5 beds 3 baths2,637 sq. ft.
509 O'Brien Drive, Kathleen, GA 31047
MLS# 262861Listed by: HUGHSTON HOMES MARKETING, INC- New
 $299,900Active3 beds 2 baths1,670 sq. ft.
129 Savannah Lane, Bonaire, GA 31005
MLS# 10781450Listed by: Landmark Realty - New
 $205,000Active3 beds 2 baths1,198 sq. ft.
507 Scarborough Road, Warner Robins, GA 31093
MLS# 263519Listed by: SHERIDAN SOLOMON & ASSOCIATES-SOUTH - New
 $400,000Active5 beds 4 baths3,482 sq. ft.
202 Baxter Drive, Kathleen, GA 31047
MLS# 10781083Listed by: Southern Classic Realtors - New
 $472,000Active5 beds 3 baths2,306 sq. ft.
222 Blue Ridge Lane, Warner Robins, GA 31088
MLS# 10780853Listed by: Landmark Realty - New
 $253,790Active3 beds 2 baths1,475 sq. ft.
1123 Adirondac Way, Bonaire, GA 31005
MLS# 263510Listed by: DR HORTON REALTY OF GEORGIA - New
 $310,000Active5 beds 4 baths2,348 sq. ft.
138 Arbor Creek, Warner Robins, GA 31093
MLS# 10780703Listed by: Keller Williams River Cities - New
 $475,000Active5 beds 3 baths2,799 sq. ft.
222 Blue Ridge Lane, Warner Robins, GA 31088
MLS# 263492Listed by: LANDMARK REALTY - New
 $269,750Active3 beds 2 baths1,714 sq. ft.
1119 Adirondac Way, Bonaire, GA 31005
MLS# 263489Listed by: DR HORTON REALTY OF GEORGIA - New
 $212,000Active3 beds 2 baths1,331 sq. ft.
112 Willis Creek Drive, Warner Robins, GA 31088
MLS# 263490Listed by: GOLDEN KEY REALTY - New
 $397,500Active2 beds 1 baths1,600 sq. ft.
417 Plantation Road, Warner Robins, GA 31093
MLS# 263485Listed by: SHERIDAN SOLOMON & ASSOCIATES-SOUTH - New
 $292,870Active4 beds 2 baths1,774 sq. ft.
1121 Adirondac Way, Bonaire, GA 31005
MLS# 263486Listed by: DR HORTON REALTY OF GEORGIA - New
 $292,870Active4 beds 2 baths1,774 sq. ft.
1125 Adirondac Way, Bonaire, GA 31005
MLS# 263487Listed by: DR HORTON REALTY OF GEORGIA - New
 $299,370Active4 beds 2 baths1,774 sq. ft.
1118 Adirondac Way, Bonaire, GA 31005
MLS# 263488Listed by: DR HORTON REALTY OF GEORGIA - New
 $214,900Active3 beds 2 baths1,390 sq. ft.
113 Sandra Avenue, Warner Robins, GA 31088
MLS# 7783886Listed by: KELLER WILLIAMS REALTY ATL PART - New
 $49,900Active3 beds 2 baths
103 Trinity Drive, Warner Robins, GA 31088
MLS# 10780353Listed by: GPS Property Management LLC - New
 $364,900Active4 beds 2 baths2,303 sq. ft.
222 Santa Fe Trail, Warner Robins, GA 31088
MLS# 10780358Listed by: Southern Classic Realtors - New
 $246,000Active3 beds 2 baths1,470 sq. ft.
110 Roaring Forks Drive, Bonaire, GA 31005
MLS# 263479Listed by: COLDWELL BANKER FREE REALTY  $399,900Pending4 beds 2 baths2,596 sq. ft.
507 Scarlett Drive, Warner Robins, GA 31088
MLS# 263476Listed by: LANDMARK REALTY- New
 $195,000Active4 beds 2 baths1,618 sq. ft.
327 Bonnie Drive, Warner Robins, GA 31088
MLS# 263468Listed by: GOLDEN KEY REALTY - New
 $475,900Active5 beds 4 baths3,324 sq. ft.
214 Baxter Drive #13, Kathleen, GA 31047
MLS# 10779726Listed by: Hughston Homes Marketing  $475,900Pending5 beds 4 baths3,324 sq. ft.
214 Baxter Drive, Kathleen, GA 31047
MLS# 263465Listed by: HUGHSTON HOMES MARKETING, INC- New
 $420,000Active5 beds 4 baths2,481 sq. ft.
500 Rosewater Dr, Warner Robins, GA 31088
MLS# 10779540Listed by: Southern Classic Realtors - New
 $215,000Active3 beds 2 baths1,234 sq. ft.
115 Lauren Way, Warner Robins, GA 31093
MLS# 10779432Listed by: Southern Classic Realtors - New
 $379,900Active3 beds 2 baths2,543 sq. ft.
87 Park Ln, Warner Robins, GA 31093
MLS# 263460Listed by: SOUTHERN CLASSIC REALTORS - New
 $239,900Active3 beds 2 baths1,576 sq. ft.
121 Eastlake Drive, Warner Robins, GA 31093
MLS# 10779334Listed by: Keller Williams Middle Georgia - New
 $155,000Active3 beds 1 baths1,270 sq. ft.
132 Evergreen Street, Warner Robins, GA 31093
MLS# 263454Listed by: MAXIMUM ONE PLATINUM REALTORS - New
 $180,000Active3 beds 2 baths1,413 sq. ft.
732 Katherine Street, Warner Robins, GA 31088
MLS# 10779167Listed by: NoSplit Realty - New
 $159,900Active3 beds 1 baths1,238 sq. ft.
103 Woodlawn Avenue, Warner Robins, GA 31093
MLS# 263446Listed by: LANDMARK REALTY - New
 $98,000Active2 beds 2 baths900 sq. ft.
620 Gawin Drive, Warner Robins, GA 31093
MLS# 263449Listed by: COLDWELL BANKER ACCESS REALTY - New
 $349,900Active4 beds 3 baths2,595 sq. ft.
125 Stillwood Drive, Warner Robins, GA 31088
MLS# 10778828Listed by: MF Real Estate Firm - New

 $140,000Active3 beds 2 baths1,101 sq. ft.
112 Barbara Drive, Warner Robins, GA 31093
MLS# 10778861Listed by: Century 21 Homes & Investments - New
 $124,900Active3 beds 1 baths950 sq. ft.
104 Delaware Avenue, Warner Robins, GA 31093
MLS# 7782423Listed by: VIRTUAL PROPERTIES REALTY.COM - New
 $239,000Active4 beds 2 baths1,557 sq. ft.
105 Stallion Point, Bonaire, GA 31005
MLS# 10778107Listed by: Southern Classic Realtors - New
 $329,900Active4 beds 2 baths1,953 sq. ft.
207 Creek Ridge Road, Warner Robins, GA 31088
MLS# 263421Listed by: RE/MAX CUTTING EDGE REALTY - New
 $248,900Active4 beds 3 baths1,844 sq. ft.
101 Sourwood Lane, Warner Robins, GA 31093
MLS# 263417Listed by: SHERIDAN SOLOMON & ASSOCIATES-SOUTH - New
 $385,000Active3 beds 4 baths2,874 sq. ft.
232 Bazemore Circle, Warner Robins, GA 31093
MLS# 10777741Listed by: Landmark Realty - New
 $523,400Active6 beds 5 baths4,674 sq. ft.
101 Chambers Creek Circle, Bonaire, GA 31005
MLS# 10777428Listed by: Coldwell Banker Free Realty - New
 $214,900Active4 beds 2 baths1,360 sq. ft.
212 Palomino Lane, Warner Robins, GA 31088
MLS# 263403Listed by: LANDMARK REALTY - New
 $655,500Active5 beds 4 baths3,294 sq. ft.
103 Trailing Bend, Kathleen, GA 31047
MLS# 263407Listed by: LANDMARK REALTY - New
 $455,000Active5 beds 4 baths3,300 sq. ft.
102 Leconte N, Warner Robins, GA 31088
MLS# 10777031Listed by: Southern Classic Realtors - New
 $250,000Active3 beds 2 baths1,410 sq. ft.
111 Harmony Path, Bonaire, GA 31005
MLS# 263389Listed by: COLDWELL BANKER FREE REALTY - New
 $239,900Active3 beds 2 baths1,548 sq. ft.
220 Gray Fox Crossing, Bonaire, GA 31005
MLS# 10776835Listed by: Southern Classic Realtors - New
 $409,500Active4 beds 3 baths2,284 sq. ft.
105 Welney Circle, Warner Robins, GA 31088
MLS# 10776737Listed by: MF Real Estate Firm - New
 $241,450Active4 beds 2 baths1,653 sq. ft.
143 Arbor Creek, Warner Robins, GA 31093
MLS# 10776706Listed by: Century 21 Homes & Investments - New
 $489,900Active4 beds 3 baths2,614 sq. ft.
111 Maisie Way, Bonaire, GA 31005
MLS# 263383Listed by: HUGHSTON HOMES MARKETING, INC - New
 $178,000Active2 beds 2 baths1,224 sq. ft.
131 Ridge Pointe Court, Warner Robins, GA 31088
MLS# 263378Listed by: GILES REALTY LLC - New
 $187,500Active3 beds 3 baths1,352 sq. ft.
114 Karen Drive, Warner Robins, GA 31088
MLS# 263371Listed by: REAL BROKER LLC - New
 $489,900Active4 beds 3 baths2,614 sq. ft.
111 Maisie Way #235, Bonaire, GA 31005
MLS# 10776477Listed by: Hughston Homes Marketing - New
 $120,000Active3 beds 2 baths1,512 sq. ft.
109 Crestmont Court, Byron, GA 31008
MLS# 10776161Listed by: Georgia's Home Team Realty - New
 $120,000Active3 beds 2 baths1,512 sq. ft.
100 Crestmont Court, Byron, GA 31008
MLS# 10776166Listed by: Georgia's Home Team Realty - New
 $120,000Active3 beds 2 baths1,512 sq. ft.
604 Richmond Hill Parkway, Byron, GA 31008
MLS# 10776123Listed by: Georgia's Home Team Realty - New
 $250,000Active3 beds 2 baths2,052 sq. ft.
221 Gilchrist Drive, Warner Robins, GA 31093
MLS# 10775995Listed by: Golden Key Realty, Inc. - New
 $236,655Active3 beds 2 baths1,436 sq. ft.
428 Lamplight Drive #LOT D57, Byron, GA 31008
MLS# 10775946Listed by: SDC Realty Central Georgia - New
 $169,900Active3 beds 2 baths1,644 sq. ft.
211 Sunnydale Drive, Warner Robins, GA 31088
MLS# 10775706Listed by: MF Real Estate Firm - New
 $125,000Active4 beds 2 baths1,620 sq. ft.
110 Crestmont Court, Byron, GA 31008
MLS# 10775236Listed by: Georgia's Home Team Realty - New
 $395,000Active4 beds 2 baths1,990 sq. ft.
216 Golden Chestnut Bend, Bonaire, GA 31005
MLS# 263325Listed by: ARISE REALTY GROUP LLC - New
 $409,900Active4 beds 2 baths3,256 sq. ft.
106 Pickett Court, Warner Robins, GA 31093
MLS# 7779259Listed by: EXP REALTY, LLC.  $135,000Active3 beds 3 baths2,314 sq. ft.
209 Bernard Drive, Warner Robins, GA 31093
MLS# 10774813Listed by: Southern Classic Realtors $309,900Active3 beds 2 baths1,967 sq. ft.
109 Gray Fox Crossing, Bonaire, GA 31005
MLS# 10774767Listed by: Real Broker, LLC $490,000Active4 beds 3 baths2,442 sq. ft.
304 Montgomery Street, Warner Robins, GA 31088
MLS# 263310Listed by: AF REALTY GROUP $238,900Pending3 beds 2 baths1,572 sq. ft.
222 Gray Fox Crossing, Bonaire, GA 31005
MLS# 263311Listed by: LANDMARK REALTY $305,000Active3 beds 2 baths1,931 sq. ft.
225 Autumn Woods Drive, Warner Robins, GA 31088
MLS# 7779096Listed by: IMPERIAL ESTATE REALTY, LLC $209,000Pending3 beds 2 baths2,068 sq. ft.
121 Napier Avenue, Warner Robins, GA 31093
MLS# 263307Listed by: EXP REALTY ASSOCIATES $239,000Active4 beds 2 baths1,557 sq. ft.
105 Stallion Pointe, Bonaire, GA 31005
MLS# 263303Listed by: SOUTHERN CLASSIC REALTORS $149,999Active3 beds 2 baths1,066 sq. ft.
100 Mauldon Court, Warner Robins, GA 31093
MLS# 10774455Listed by: Connie R. Ham Middle GA Realty $620,000Active4 beds 4 baths3,426 sq. ft.
104 Running Creek Drive, Warner Robins, GA 31088
MLS# 263296Listed by: GILES REALTY LLC $235,000Active3 beds 2 baths1,332 sq. ft.
103 Highpoint Drive, Warner Robins, GA 31093
MLS# 10774330Listed by: Americom Realty of Warner Robins $285,000Active3 beds 2 baths1,768 sq. ft.
114 Ivey Ct, Warner Robins, GA 31088
MLS# 263287Listed by: LANDMARK REALTY $280,000Active4 beds 3 baths2,532 sq. ft.
514 Terrell Street, Warner Robins, GA 31088
MLS# 184576Listed by: KELLER WILLIAMS REALTY MIDDLE GEORGIA $139,900Active3 beds 1 baths988 sq. ft.
111 Benton Avenue, Warner Robins, GA 31088
MLS# 10774009Listed by: Keller Williams Middle Georgia $240,000Active3 beds 3 baths2,109 sq. ft.
709 Meadowridge Dr, Warner Robins, GA 31093
MLS# 263279Listed by: EXP REALTY ASSOCIATES $284,900Active3 beds 2 baths1,714 sq. ft.
116 Logan's Mill Trail, Warner Robins, GA 31093
MLS# 10773894Listed by: Maximum One Platinum Realtors $235,000Active3 beds 2 baths2,363 sq. ft.
308 Clairmont Drive, Warner Robins, GA 31088
MLS# 10773834Listed by: Landmark Realty $167,900Active3 beds 1 baths1,276 sq. ft.
214 Third Street, Warner Robins, GA 31093
MLS# 263271Listed by: LANDMARK REALTY $165,000Active3 beds 2 baths836 sq. ft.
1102 Green Street, Warner Robins, GA 31093
MLS# 10773552Listed by: A Home For You Realty, LLC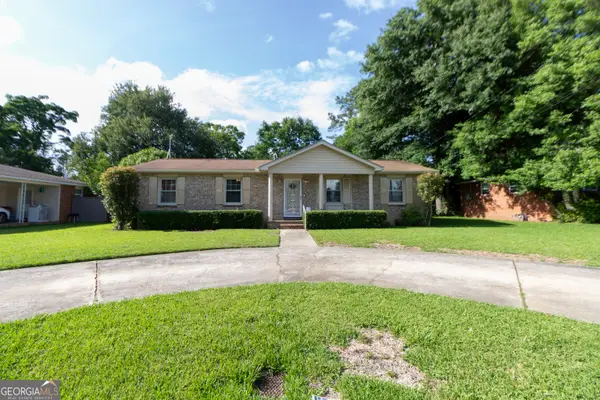 $149,999Active3 beds 2 baths1,352 sq. ft.
121 Sonja Drive, Warner Robins, GA 31088
MLS# 10773070Listed by: Maximum One Platinum Realtors $259,000Active3 beds 2 baths2,049 sq. ft.
205 Forest Mill Drive, Warner Robins, GA 31088
MLS# 10772969Listed by: Joseph Walter Realty, LLC $350,000Active4 beds 3 baths2,257 sq. ft.
109 Burnt Hickory Court, Warner Robins, GA 31088
MLS# 263240Listed by: KELLER WILLIAMS REALTY MIDDLE GEORGIA $465,000Active5 beds 3 baths2,854 sq. ft.
109 Lady Lane, Warner Robins, GA 31088
MLS# 184558Listed by: LANDMARK REALTY OF PERRY, INC. $174,900Active3 beds 2 baths1,422 sq. ft.
111 Ridge Pointe Court, Warner Robins, GA 31088
MLS# 10772603Listed by: Trowbridge Realty Corporation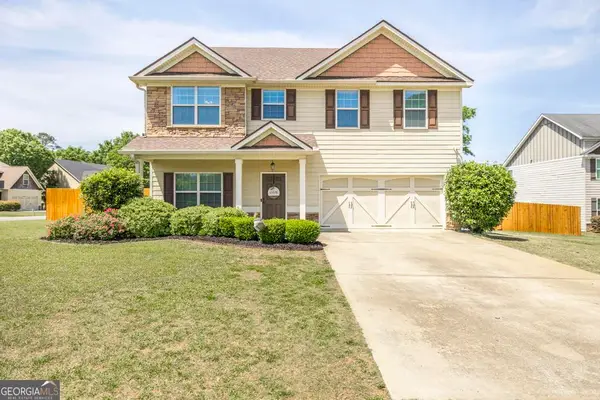 $325,000Pending4 beds 3 baths2,290 sq. ft.
100 Taconic Court, Bonaire, GA 31005
MLS# 10772549Listed by: Southern Classic Realtors $230,000Active4 beds 2 baths1,701 sq. ft.
316 Terrell Street, Warner Robins, GA 31088
MLS# 10772205Listed by: Robins Realty Group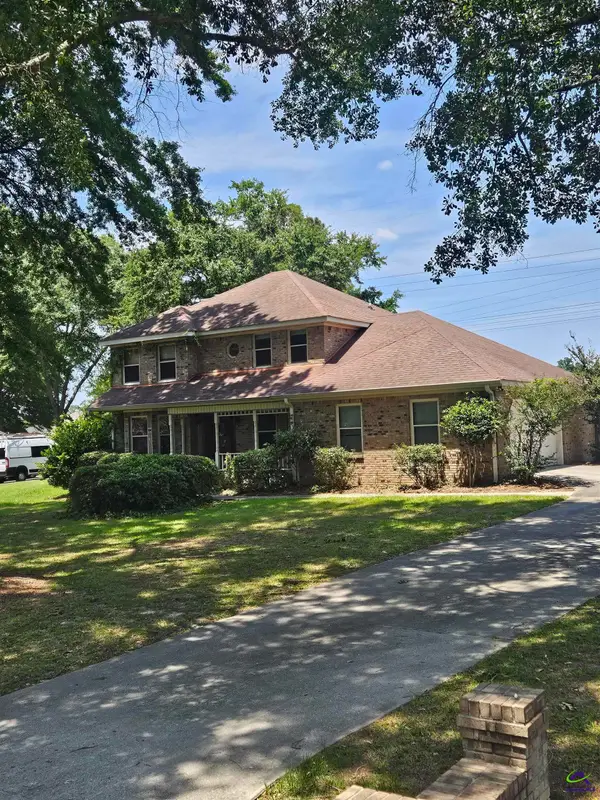 $317,900Active3 beds 3 baths2,180 sq. ft.
305 Empire Trail, Warner Robins, GA 31088
MLS# 263227Listed by: ASSIST-2-SELL, SMART CHOICE REAL ESTATE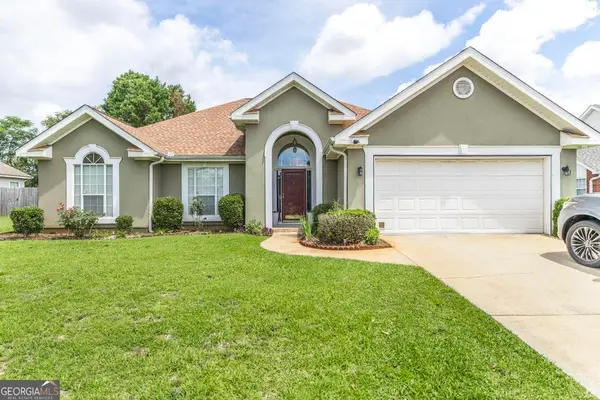 $351,500Active3 beds 2 baths2,070 sq. ft.
123 Galaxy Avenue, Bonaire, GA 31005
MLS# 10772171Listed by: Real Broker, LLC $444,000Active4 beds 3 baths2,545 sq. ft.
213 Tucker Road, Warner Robins, GA 31088
MLS# 10772076Listed by: Southern Classic Realtors $254,000Active4 beds 2 baths1,578 sq. ft.
125 Northsky Drive, Warner Robins, GA 31093
MLS# 263219Listed by: FICKLING & COMPANY $295,638Active3 beds 2 baths1,675 sq. ft.
101 Brayden Rex Court, Perry, GA 31069
MLS# 263217Listed by: KEG REALTORS $245,000Active3 beds 2 baths1,535 sq. ft.
96 Santangelo Court, Warner Robins, GA 31093
MLS# 10771840Listed by: Keller Williams Middle Georgia $279,990Active4 beds 3 baths2,053 sq. ft.
305 Southgate Drive #LOT D62, Warner Robins, GA 31008
MLS# 10771560Listed by: SDC Realty Central Georgia $328,500Active4 beds 2 baths1,800 sq. ft.
234 Creek Ridge Drive, Warner Robins, GA 31088
MLS# 263197Listed by: ROBINS REALTY GROUP LLC $279,900Active4 beds 2 baths2,027 sq. ft.
428 Cross Creek Way, Warner Robins, GA 31088
MLS# 10771286Listed by: Real Broker, LLC $309,900Active3 beds 3 baths2,062 sq. ft.
504 Nandina Ct, Warner Robins, GA 31088
MLS# 3220683Listed by: SWAYZE REAL ESTATE GROUP $239,900Active3 beds 2 baths1,360 sq. ft.
207 Roaring Forks Drive, Bonaire, GA 31005
MLS# 10771013Listed by: Maximum One Platinum Realtors $210,000Active3 beds 2 baths1,637 sq. ft.
213 Spruce Street, Warner Robins, GA 31088
MLS# 10770882Listed by: Landmark Realty $305,000Active3 beds 3 baths1,831 sq. ft.
216 Raleigh Drive, Warner Robins, GA 31088
MLS# 10770715Listed by: Southern Classic Realtors $190,000Active2 beds 2 baths1,266 sq. ft.
306 Eagles Landing Trail, Warner Robins, GA 31093
MLS# 10770805Listed by: Keller Williams Middle Georgia $649,900Active5 beds 4 baths3,587 sq. ft.
405 Old Bridge Road, Warner Robins, GA 31088
MLS# 263147Listed by: KELLER WILLIAMS REALTY MIDDLE GEORGIA $112,900Active2 beds 1 baths888 sq. ft.
305 Mcarthur Boulevard, Warner Robins, GA 31093
MLS# 10769548Listed by: Century 21 Homes & Investments $349,866Active4 beds 2 baths1,881 sq. ft.
203 Woodwinds Court, Kathleen, GA 31047
MLS# 10769299Listed by: Driggers Team Real Estate $239,900Active3 beds 2 baths1,400 sq. ft.
502 Arrie Drive, Byron, GA 31008
MLS# 10769249Listed by: Kelly Wood Realty $351,168Pending4 beds 2 baths1,888 sq. ft.
205 Woodwinds Court, Kathleen, GA 31047
MLS# 263132Listed by: DRIGGERS TEAM REAL ESTATE $399,000Active4 beds 3 baths2,837 sq. ft.
1499 Leverette Road, Warner Robins, GA 31088
MLS# 10769117Listed by: House To Home Properties &Commercial $155,000Active3 beds 2 baths1,250 sq. ft.
313 Orchard Lane, Warner Robins, GA 31093
MLS# 263130Listed by: REAL BROKER LLC $515,000Active4 beds 3 baths2,811 sq. ft.
501 Old Bridge Road, Warner Robins, GA 31088
MLS# 10768998Listed by: Landmark Realty $130,000Active2 beds 1 baths998 sq. ft.
106 Westcliff Circle #APT C, Warner Robins, GA 31093
MLS# 10768935Listed by: Coldwell Banker Access Realty $195,000Active3 beds 2 baths1,408 sq. ft.
106 Galahad Drive, Warner Robins, GA 31093
MLS# 10768814Listed by: Southern Classic Realtors $395,000Active4 beds 2 baths1,980 sq. ft.
212 Golden Chestnut Bend, Bonaire, GA 31005
MLS# 10768713Listed by: Arise Realty Group, LLC $178,000Pending3 beds 2 baths1,166 sq. ft.
111 Brandonshire Lane, Bonaire, GA 31005
MLS# 10768753Listed by: Robins Realty Group $187,000Active3 beds 2 baths1,550 sq. ft.
504 Angus Boulevard, Warner Robins, GA 31088
MLS# 10768754Listed by: Landmark Realty $394,900Pending5 beds 3 baths3,021 sq. ft.
110 Regency Court, Warner Robins, GA 31088
MLS# 263120Listed by: COLDWELL BANKER ACCESS REALTY $665,000Active4 beds 4 baths5,354 sq. ft.
230 Tucker Road, Warner Robins, GA 31088
MLS# 263115Listed by: LANDMARK REALTY $122,000Active2 beds 2 baths998 sq. ft.
106 Westcliff Circle, Warner Robins, GA 31093
MLS# 263110Listed by: COLDWELL BANKER ACCESS REALTY $395,000Active4 beds 2 baths1,980 sq. ft.
214 Golden Chestnut Bend, Bonaire, GA 31005
MLS# 10768529Listed by: Arise Realty Group, LLC $144,500Active3 beds 1 baths1,202 sq. ft.
114 Williams Terrace, Warner Robins, GA 31093
MLS# 10768389Listed by: Americom Realty of Warner Robins $345,000Active5 beds 3 baths3,321 sq. ft.
111 Glacier Trail, Warner Robins, GA 31088
MLS# 10768432Listed by: Dwelli $99,900Active4 beds 2 baths1,641 sq. ft.
102 Brown Drive, Warner Robins, GA 31093
MLS# 10768122Listed by: Keller Williams Middle Georgia $245,000Active3 beds 2 baths1,600 sq. ft.
224 Sunflower Drive, Bonaire, GA 31005
MLS# 10768004Listed by: Southern Classic Realtors $252,900Active3 beds 2 baths1,690 sq. ft.
302 Appling Way, Byron, GA 31008
MLS# 10767968Listed by: Maximum One Realtor Partners $235,000Active3 beds 2 baths1,633 sq. ft.
202 Sunnymeade Drive, Warner Robins, GA 31093
MLS# 263094Listed by: REAL BROKER LLC $269,900Active4 beds 3 baths2,044 sq. ft.
107 Rock Run Trail, Warner Robins, GA 31093
MLS# 263089Listed by: LANDMARK REALTY $225,000Active4 beds 3 baths2,050 sq. ft.
315 Donna Drive, Warner Robins, GA 31088
MLS# 10767878Listed by: Southern Classic Realtors $175,000Active3 beds 2 baths1,658 sq. ft.
100 Hillside Terrace, Warner Robins, GA 31088
MLS# 263085Listed by: SOUTHERN LUXURY GROUP REALTY $167,000Active3 beds 2 baths1,205 sq. ft.
96 Ravenwood Way, Warner Robins, GA 31093
MLS# 10767649Listed by: Realty Unlimited, LLC $215,000Pending3 beds 2 baths1,432 sq. ft.
113 woodfield Drive, Warner Robins, GA 31088
MLS# 263068Listed by: FICKLING & COMPANY $240,000Active3 beds 2 baths1,578 sq. ft.
107 Woodfield Drive, Warner Robins, GA 31088
MLS# 263066Listed by: CENTURY 21 HOMES & INVESTMENTS $269,900Active3 beds 3 baths1,719 sq. ft.
112 Bulloch Court, Byron, GA 31008
MLS# 263062Listed by: WIND & WATER REALTY $269,900Active3 beds 2 baths1,549 sq. ft.
113 Bulloch Court, Byron, GA 31008
MLS# 263063Listed by: WIND & WATER REALTY $270,900Active3 beds 2 baths1,549 sq. ft.
114 Bulloch Court, Byron, GA 31008
MLS# 263064Listed by: WIND & WATER REALTY $309,900Active4 beds 3 baths2,091 sq. ft.
100 Bulloch Court, Byron, GA 31008
MLS# 10767207Listed by: Wind & Water Realty $295,000Active3 beds 2 baths1,686 sq. ft.
104 Savannah Lane, Bonaire, GA 31005
MLS# 10767132Listed by: Southern Classic Realtors $280,000Active4 beds 2 baths1,614 sq. ft.
605 Charlestown Way, Bonaire, GA 31005
MLS# 263055Listed by: LAND OF PROMISE PROPERTIES $514,900Active5 beds 3 baths3,151 sq. ft.
600 Bella Notte Circle, Warner Robins, GA 31088
MLS# 263056Listed by: HUGHSTON HOMES MARKETING, INC $160,000Active5 beds 2 baths1,192 sq. ft.
205 Kensington Circle, Warner Robins, GA 31093
MLS# 10766497Listed by: HomeSmart $348,900Active5 beds 5 baths2,662 sq. ft.
107 Lakewood Drive, Warner Robins, GA 31088
MLS# 263034Listed by: LANDMARK REALTY $159,000Active3 beds 2 baths1,560 sq. ft.
127 Kirkwood Circle, Warner Robins, GA 31088
MLS# 263032Listed by: LANDMARK REALTY $399,000Active4 beds 3 baths2,356 sq. ft.
101 Leconte N, Warner Robins, GA 31088
MLS# 10766403Listed by: Robins Realty Group $425,000Active4 beds 3 baths2,586 sq. ft.
204 Clayton Court, Warner Robins, GA 31088
MLS# 10766273Listed by: Fickling & Company $320,000Active4 beds 2 baths1,857 sq. ft.
318 Weston Drive, Kathleen, GA 31047
MLS# 263025Listed by: ASSIST-2-SELL, SMART CHOICE REAL ESTATE $875,000Active4 beds 5 baths4,315 sq. ft.
209 Carriage Run, Warner Robins, GA 31088
MLS# 263021Listed by: LANDMARK REALTY $225,000Active3 beds 3 baths2,925 sq. ft.
99 Sandy Valley Drive, Warner Robins, GA 31088
MLS# 10765999Listed by: Keller Williams Middle Georgia $279,900Active3 beds 2 baths2,053 sq. ft.
116 South Oaks Lane, Warner Robins, GA 31088
MLS# 10765511Listed by: Landmark Realty $329,000Active4 beds 3 baths2,632 sq. ft.
223 Shenandoah Trail, Warner Robins, GA 31088
MLS# 263005Listed by: FICKLING & COMPANY - MACON $294,990Active4 beds 3 baths2,372 sq. ft.
306 Southgate Drive #LOT D61, Warner Robins, GA 31008
MLS# 10765434Listed by: SDC Realty Central Georgia $259,999Active3 beds 2 baths1,418 sq. ft.
120 Merri Valley Drive, Warner Robins, GA 31088
MLS# 262994Listed by: DRIGGERS TEAM REAL ESTATE $259,999Active3 beds 2 baths1,418 sq. ft.
122 Merri Valley Drive, Warner Robins, GA 31088
MLS# 262995Listed by: DRIGGERS TEAM REAL ESTATE $259,999Active3 beds 2 baths1,418 sq. ft.
116 Merri Valley Drive, Warner Robins, GA 31088
MLS# 262975Listed by: DRIGGERS TEAM REAL ESTATE $259,999Active3 beds 2 baths1,418 sq. ft.
118 Merri Valley Drive, Warner Robins, GA 31088
MLS# 262976Listed by: DRIGGERS TEAM REAL ESTATE $314,900Active3 beds 3 baths2,107 sq. ft.
312 Twelve Oaks Drive, Warner Robins, GA 31088
MLS# 262969Listed by: EXP REALTY ASSOCIATES $399,900Active4 beds 3 baths2,474 sq. ft.
104 Oak Branch Lane, Bonaire, GA 31005
MLS# 262955Listed by: COLDWELL BANKER FREE REALTY $523,400Active6 beds 5 baths4,674 sq. ft.
106 Oak Branch Lane, Bonaire, GA 31005
MLS# 262956Listed by: COLDWELL BANKER FREE REALTY $449,900Pending5 beds 3 baths3,151 sq. ft.
400 Baxter Drive, Kathleen, GA 31047
MLS# 262929Listed by: HUGHSTON HOMES MARKETING, INC $205,000Pending5 beds 3 baths2,137 sq. ft.
419 Pine Valley Drive, Warner Robins, GA 31088
MLS# 262928Listed by: KELLER WILLIAMS REALTY MIDDLE GEORGIA $422,600Active5 beds 3 baths2,637 sq. ft.
124 Maisie Way #204, Bonaire, GA 31005
MLS# 10763307Listed by: Hughston Homes Marketing $449,900Active5 beds 3 baths3,151 sq. ft.
400 Baxter Drive #4, Kathleen, GA 31047
MLS# 10763480Listed by: Hughston Homes Marketing $529,900Active5 beds 4 baths2,821 sq. ft.
240 Flat Shoal Drive, Bonaire, GA 31005
MLS# 10763494Listed by: Real Broker, LLC $422,600Pending5 beds 3 baths2,637 sq. ft.
124 Maisie Way, Bonaire, GA 31005
MLS# 262923Listed by: HUGHSTON HOMES MARKETING, INC $269,990Pending4 beds 3 baths2,417 sq. ft.
123 S Amanda Place, Warner Robins, GA 31088
MLS# 262924Listed by: GOOD THING REALTY LLC $349,900Active4 beds 2 baths2,456 sq. ft.
211 Cade Terrace, Warner Robins, GA 31088
MLS# 262915Listed by: KELLER WILLIAMS REALTY MIDDLE GEORGIA $239,900Pending3 beds 2 baths1,606 sq. ft.
105 Barecky Drive, Warner Robins, GA 31088
MLS# 262909Listed by: LANDMARK REALTY $253,750Active4 beds 2 baths1,790 sq. ft.
151 Martin Mill Trail, Warner Robins, GA 31093
MLS# 10762995Listed by: Century 21 Homes & Investments $275,000Active4 beds 3 baths2,438 sq. ft.
101 south oaks Lane, Warner Robins, GA 31088
MLS# 262901Listed by: LANDMARK REALTY $439,350Pending5 beds 3 baths2,864 sq. ft.
118 Maisie Way, Bonaire, GA 31005
MLS# 262887Listed by: HUGHSTON HOMES MARKETING, INC $486,420Pending5 beds 3 baths3,158 sq. ft.
115 Maisie Way, Bonaire, GA 31005
MLS# 262889Listed by: HUGHSTON HOMES MARKETING, INC $545,800Pending5 beds 5 baths3,669 sq. ft.
403 Baxter Drive, Kathleen, GA 31047
MLS# 262895Listed by: HUGHSTON HOMES MARKETING, INC $545,800Active5 beds 5 baths3,669 sq. ft.
403 Baxter Drive #40, Kathleen, GA 31047
MLS# 10762603Listed by: Hughston Homes Marketing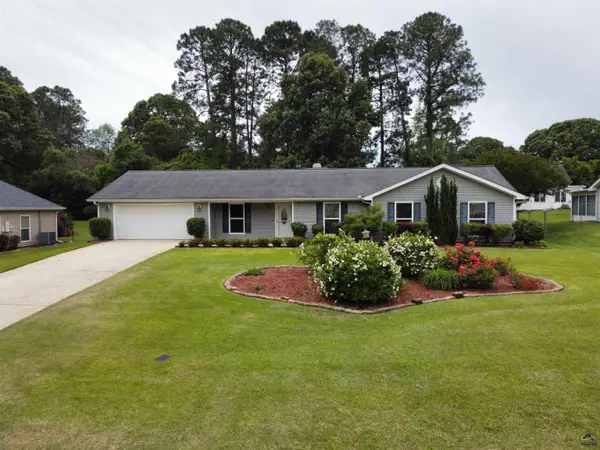 $264,000Active4 beds 2 baths1,875 sq. ft.
314 Cedar Ridge Drive, Warner Robins, GA 31088
MLS# 262888Listed by: GOLDEN KEY REALTY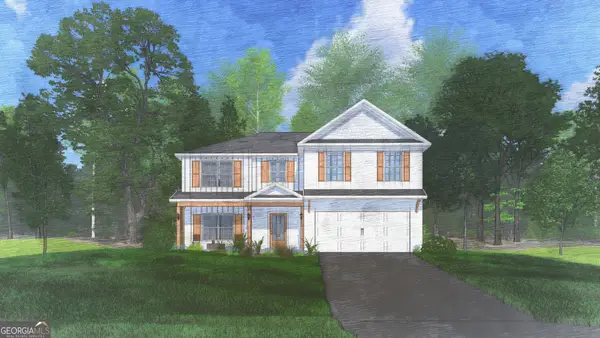 $439,350Active5 beds 3 baths2,864 sq. ft.
118 Maisie Way #207, Bonaire, GA 31005
MLS# 10762461Listed by: Hughston Homes Marketing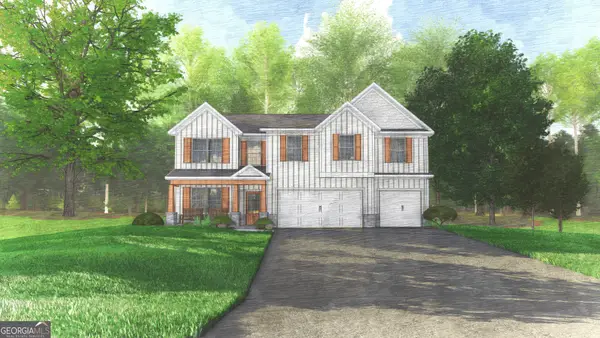 $486,420Active5 beds 3 baths3,158 sq. ft.
115 Maisie Way #233, Bonaire, GA 31005
MLS# 10762475Listed by: Hughston Homes Marketing $135,000Active3 beds 1 baths1,101 sq. ft.
101 Sparta Street, Warner Robins, GA 31088
MLS# 10762445Listed by: Giles Realty $40,000Active1 beds 1 baths
108 Glenwood Avenue, Warner Robins, GA 31088
MLS# 10762142Listed by: Golden Key Realty, Inc.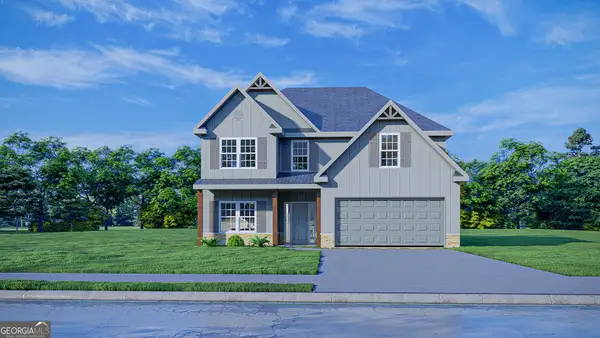 $409,900Active5 beds 3 baths2,637 sq. ft.
509 O'brien Drive #43, Kathleen, GA 31047
MLS# 10761722Listed by: Hughston Homes Marketing $135,000Pending2 beds 1 baths1,182 sq. ft.
130 S Pleasant Hill Road, Warner Robins, GA 31088
MLS# 262843Listed by: AF REALTY GROUP $199,900Active3 beds 2 baths1,300 sq. ft.
103 Draper Street, Warner Robins, GA 31088
MLS# 10761115Listed by: Landmark Realty $298,900Active3 beds 2 baths1,777 sq. ft.
605 Adirondac Way, Bonaire, GA 31005
MLS# 10761026Listed by: Real Broker, LLC $290,265Pending3 beds 2 baths1,569 sq. ft.
410 Lamplight Drive, Byron, GA 31008
MLS# 262839Listed by: LANDMARK REALTY $599,900Active5 beds 3 baths2,988 sq. ft.
184 Giles Road, Warner Robins, GA 31093
MLS# 10760929Listed by: NextHome 180 Realty $339,900Active4 beds 3 baths2,262 sq. ft.
247 Hatcher Road, Warner Robins, GA 31088
MLS# 10760780Listed by: Americom Realty of Warner Robins $405,000Active4 beds 2 baths2,104 sq. ft.
403 Cannon Point Drive, Bonaire, GA 31005
MLS# 10760448Listed by: Fickling & Company Inc. $465,000Active5 beds 3 baths2,854 sq. ft.
109 Lady Lane, Warner Robins, GA 31088
MLS# 262815Listed by: LANDMARK REALTY $650,000Pending4 beds 4 baths3,996 sq. ft.
222 Stacy Lane, Warner Robins, GA 31088
MLS# 262808Listed by: LANDMARK REALTY $289,000Active4 beds 3 baths2,376 sq. ft.
126 Martin Mill Trail, Warner Robins, GA 31093
MLS# 10760000Listed by: eXp Realty $239,900Active4 beds 3 baths2,121 sq. ft.
203 Springdale Drive, Warner Robins, GA 31088
MLS# 262806Listed by: BARBEE DREAM HOMES REAL ESTATE GROUP LLC $279,900Pending3 beds 3 baths1,770 sq. ft.
132 Concord Ridge, Warner Robins, GA 31093
MLS# 262798Listed by: AF REALTY GROUP $249,950Active4 beds 3 baths1,476 sq. ft.
103 Park Bench Way #LOT D79, Warner Robins, GA 31008
MLS# 10759607Listed by: SDC Realty Central Georgia $284,990Active4 beds 2 baths2,231 sq. ft.
304 Southgate Drive #LOT D60, Warner Robins, GA 31008
MLS# 10759691Listed by: SDC Realty Central Georgia $499,900Active5 beds 3 baths2,787 sq. ft.
113 Maisie Way, Bonaire, GA 31005
MLS# 262791Listed by: HUGHSTON HOMES MARKETING, INC $499,900Active5 beds 3 baths2,787 sq. ft.
113 Maisie Way #234, Bonaire, GA 31005
MLS# 10759568Listed by: Hughston Homes Marketing $299,000Active3 beds 2 baths1,727 sq. ft.
119 Garrett Lane, Bonaire, GA 31005
MLS# 10759593Listed by: Southern Classic Realtors $170,000Active3 beds 2 baths1,737 sq. ft.
320 Draper Street, Warner Robins, GA 31088
MLS# 10759414Listed by: Sheridan Solomon & Assoc South $419,900Pending5 beds 3 baths2,864 sq. ft.
214 O'Brien Drive, Kathleen, GA 31047
MLS# 262786Listed by: HUGHSTON HOMES MARKETING, INC $285,000Active3 beds 2 baths2,325 sq. ft.
310 Forest Hill, Warner Robins, GA 31088
MLS# 262788Listed by: RE/MAX REALTY TEAM $419,900Active5 beds 3 baths2,864 sq. ft.
214 O'brien Drive #36, Kathleen, GA 31047
MLS# 10759216Listed by: Hughston Homes Marketing $265,000Pending3 beds 2 baths1,595 sq. ft.
103 Gloucester Road, Bonaire, GA 31005
MLS# 7765560Listed by: UNLOCK REALTY GROUP $110,000Active2 beds 1 baths800 sq. ft.
423 Camellia Circle, Warner Robins, GA 31093
MLS# 10759137Listed by: eXp Realty $375,000Active4 beds 3 baths4,084 sq. ft.
1728 Green Street, Warner Robins, GA 31093
MLS# 184280Listed by: KELLER WILLIAMS REALTY MIDDLE GEORGIA $289,900Pending3 beds 2 baths1,878 sq. ft.
636 Smithville Church Road, Warner Robins, GA 31088
MLS# 262778Listed by: LANDMARK REALTY $337,000Active5 beds 3 baths3,518 sq. ft.
108 Chantilly Drive, Warner Robins, GA 31088
MLS# 10758853Listed by: Robins Realty Group $386,500Active4 beds 2 baths2,075 sq. ft.
519 Liberty Hall Drive, Bonaire, GA 31005
MLS# 10758682Listed by: Driggers Team Real Estate $480,000Active4 beds 4 baths2,830 sq. ft.
228 Perth Court, Warner Robins, GA 31088
MLS# 10758419Listed by: Landmark Realty $245,000Active3 beds 2 baths1,922 sq. ft.
122 Joy Drive, Warner Robins, GA 31088
MLS# 262755Listed by: LANDMARK REALTY $407,400Pending4 beds 3 baths2,599 sq. ft.
516 O'Brien Drive, Kathleen, GA 31047
MLS# 262750Listed by: HUGHSTON HOMES MARKETING, INC $407,400Active4 beds 3 baths2,599 sq. ft.
516 O'brien Drive #37, Kathleen, GA 31047
MLS# 10757943Listed by: Hughston Homes Marketing $315,000Pending3 beds 3 baths1,819 sq. ft.
107 Courthouse Lane, Warner Robins, GA 31088
MLS# 262746Listed by: AMERICOM REALTY OF WARNER ROBINS $306,000Active5 beds 3 baths2,342 sq. ft.
137 Red Birch Lane, Warner Robins, GA 31093
MLS# 184256Listed by: FICKLING & COMPANY-WR $185,000Active3 beds 2 baths2,066 sq. ft.
102 Hemlock Street, Warner Robins, GA 31093
MLS# 10756973Listed by: First Choice Realty Group GA $419,999Pending4 beds 4 baths
124 Flora Circle, Warner Robins, GA 31088
MLS# 10756752Listed by: Pristine Palaces Realty LLC $329,900Active3 beds 3 baths2,578 sq. ft.
208 Shenandoah Trail, Warner Robins, GA 31088
MLS# 262710Listed by: SOUTHERN CLASSIC REALTORS $175,000Active3 beds 2 baths1,115 sq. ft.
202 Elmwood Street, Warner Robins, GA 31093
MLS# 10756551Listed by: Fickling & Company, Inc. $259,000Pending4 beds 2 baths1,781 sq. ft.
144 Martin Mill Trail, Warner Robins, GA 31093
MLS# 262704Listed by: LANDMARK REALTY $355,000Pending3 beds 3 baths2,326 sq. ft.
102 Ashton Court, Warner Robins, GA 31088
MLS# 262697Listed by: COLDWELL BANKER ACCESS REALTY $129,900Active3 beds 2 baths1,100 sq. ft.
205 Debra Drive, Warner Robins, GA 31088
MLS# 10756241Listed by: Market South Properties Inc. $315,000Active3 beds 2 baths1,906 sq. ft.
103 Savannah Lane, Bonaire, GA 31005
MLS# 10756117Listed by: Covington Signature Realty $174,900Active3 beds 2 baths1,618 sq. ft.
118 Meadowcliff Circle, Warner Robins, GA 31093
MLS# 10756118Listed by: Southern Classic Realtors $339,000Active4 beds 3 baths3,063 sq. ft.
105 Fox Glen Drive, Warner Robins, GA 31088
MLS# 10756139Listed by: MF Real Estate Firm $365,000Active4 beds 3 baths2,558 sq. ft.
419 Morgan Ranch Circle, Bonaire, GA 31005
MLS# 262676Listed by: REAL BROKER LLC $250,000Pending3 beds 2 baths1,434 sq. ft.
100 Tudor Place, Warner Robins, GA 31088
MLS# 262682Listed by: SIMPLE REALTY CO $99,500Active3 beds 1 baths1,130 sq. ft.
610 Cherokee Drive, Warner Robins, GA 31093
MLS# 10755841Listed by: Sheridan Solomon & Associates $249,000Pending3 beds 2 baths1,947 sq. ft.
214 Rio Pinar Drive, Warner Robins, GA 31088
MLS# 262658Listed by: COLDWELL BANKER ACCESS REALTY $275,000Active4 beds 2 baths1,866 sq. ft.
111 Weaver Road, Warner Robins, GA 31093
MLS# 262661Listed by: KELLY RIGHT REAL ESTATE OF GEORGIA $205,000Active3 beds 2 baths1,418 sq. ft.
102 Greenspan Way, Byron, GA 31008
MLS# 10755329Listed by: Opendoor Brokerage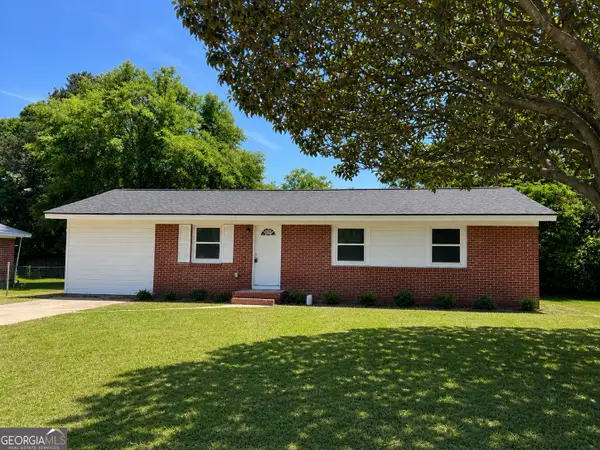 $189,999Active3 beds 2 baths1,325 sq. ft.
111 Susan Drive, Warner Robins, GA 31093
MLS# 10755390Listed by: Southern Classic Realtors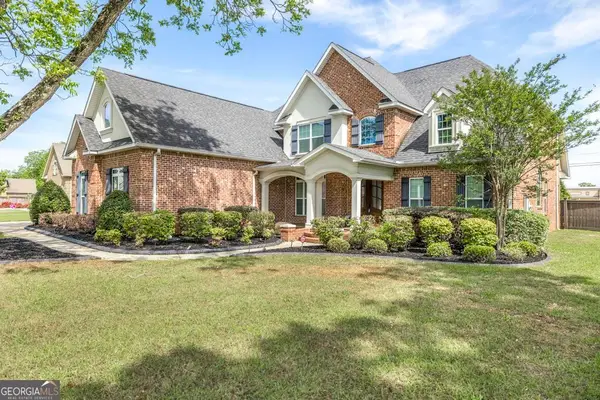 $575,000Active5 beds 3 baths3,479 sq. ft.
201 Running Creek Drive, Warner Robins, GA 31088
MLS# 10755127Listed by: Southern Classic Realtors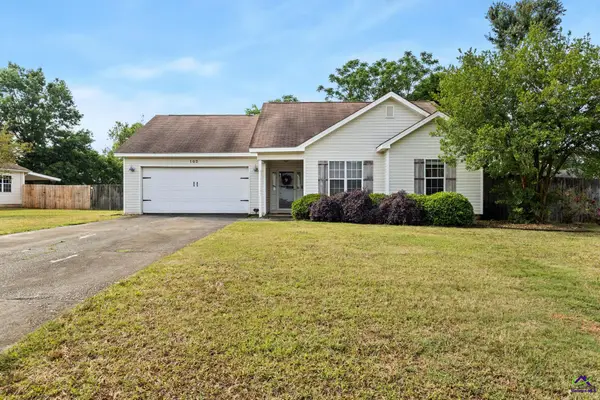 $219,900Active3 beds 2 baths1,174 sq. ft.
102 Grindstaff Drive, Bonaire, GA 31005
MLS# 262642Listed by: SOUTHERN CLASSIC REALTORS $235,000Pending4 beds 2 baths1,900 sq. ft.
802 Westwood Drive, Warner Robins, GA 31088
MLS# 262629Listed by: AF REALTY GROUP $449,900Pending5 beds 4 baths3,355 sq. ft.
218 Knob Hill Drive, Warner Robins, GA 31088
MLS# 262621Listed by: REAL BROKER LLC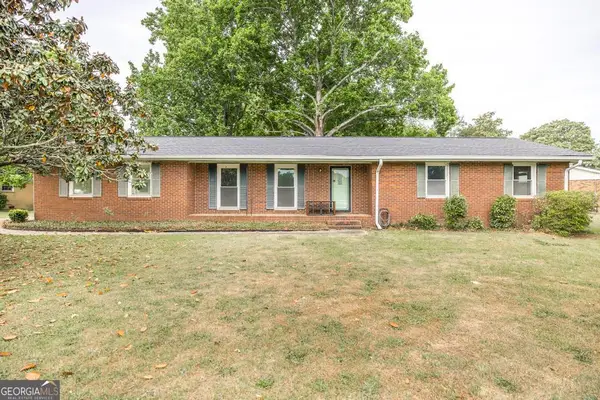 $150,000Active3 beds 2 baths1,489 sq. ft.
105 Auburn Drive, Warner Robins, GA 31088
MLS# 10754034Listed by: Covington Signature Realty $675,900Pending5 beds 4 baths3,204 sq. ft.
406 Southern Woods Trail, Kathleen, GA 31047
MLS# 262609Listed by: LANDMARK REALTY $199,900Pending3 beds 2 baths1,200 sq. ft.
202 Woodland Drive, Warner Robins, GA 31088
MLS# 262608Listed by: REAL BROKER LLC $575,555Pending5 beds 4 baths3,150 sq. ft.
315 Woodlands Boulevard, Kathleen, GA 31047
MLS# 262599Listed by: REAL BROKER LLC $459,900Active5 beds 3 baths3,158 sq. ft.
511 O'Brien Drive, Kathleen, GA 31047
MLS# 262587Listed by: HUGHSTON HOMES MARKETING, INC $315,000Active3 beds 3 baths1,908 sq. ft.
114 & 116 Chadwick Road, Warner Robins, GA 31088
MLS# 10753120Listed by: Americom Realty of Warner Robins $390,400Active4 beds 3 baths2,379 sq. ft.
513 O'brien Drive #41, Kathleen, GA 31047
MLS# 10752911Listed by: Hughston Homes Marketing $459,900Active5 beds 3 baths3,158 sq. ft.
511 O'brien Drive #42, Kathleen, GA 31047
MLS# 10753019Listed by: Hughston Homes Marketing $390,400Active4 beds 3 baths2,379 sq. ft.
513 O'Brien Drive, Kathleen, GA 31047
MLS# 262583Listed by: HUGHSTON HOMES MARKETING, INC $175,000Active2 beds 2 baths1,197 sq. ft.
66 Hamilton Woods Court, Warner Robins, GA 31088
MLS# 262574Listed by: LANDMARK REALTY $472,400Active5 beds 4 baths3,324 sq. ft.
304 Baxter Drive, Kathleen, GA 31047
MLS# 262573Listed by: HUGHSTON HOMES MARKETING, INC $472,400Active5 beds 4 baths3,324 sq. ft.
304 Baxter Drive #6, Kathleen, GA 31047
MLS# 10742785Listed by: Hughston Homes Marketing $396,900Pending4 beds 2 baths1,960 sq. ft.
210 Golden Chestnut Bnd, Bonaire, GA 31005
MLS# 262571Listed by: ARISE REALTY GROUP LLC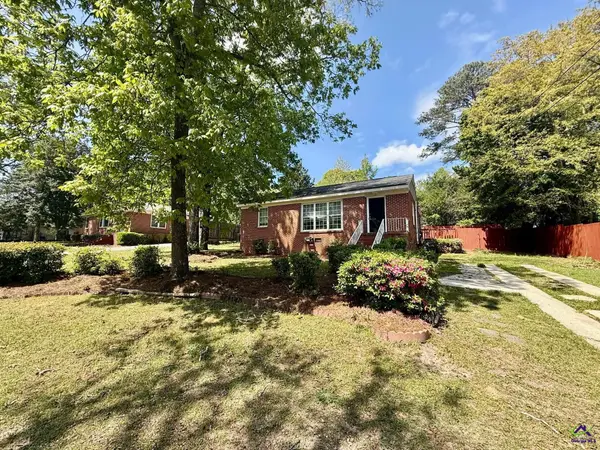 $139,900Pending4 beds 1 baths1,110 sq. ft.
106 Benton Avenue, Warner Robins, GA 31088
MLS# 262561Listed by: GOLDEN KEY REALTY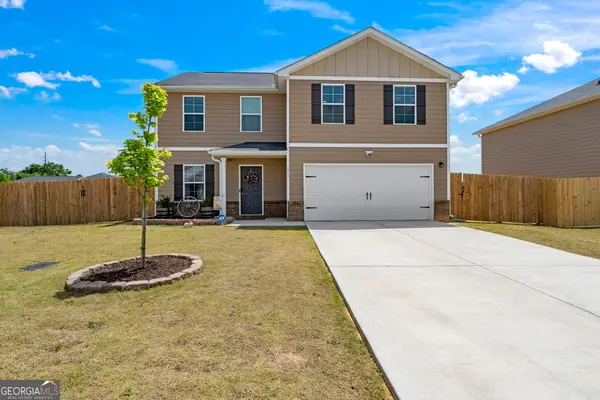 $279,900Active4 beds 3 baths2,044 sq. ft.
238 Isabella Way, Byron, GA 31008
MLS# 10742316Listed by: Real Broker, LLC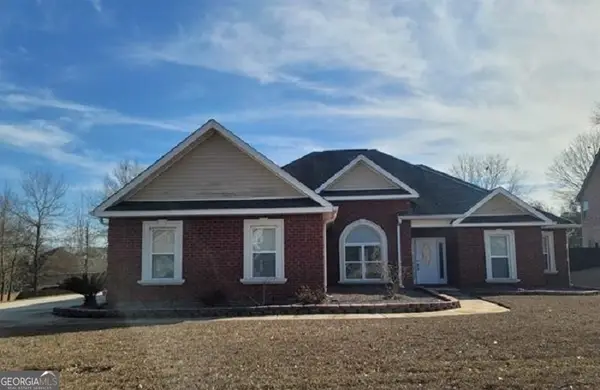 $330,000Active3 beds 3 baths1,998 sq. ft.
225 Morgan Ranch Circle, Bonaire, GA 31005
MLS# 10742055Listed by: Coldwell Banker Access Realty $569,900Active5 beds 5 baths3,398 sq. ft.
106 Lisa Marie Court, Warner Robins, GA 31088
MLS# 10741859Listed by: Southern Classic Realtors $509,900Active5 beds 3 baths2,983 sq. ft.
106 Vinings Place Drive, Warner Robins, GA 31088
MLS# 10741596Listed by: Southern Classic Realtors $264,900Active5 beds 3 baths1,904 sq. ft.
104 Lori Court, Warner Robins, GA 31093
MLS# 10741554Listed by: BHHS Georgia Properties $248,800Pending3 beds 2 baths1,582 sq. ft.
217 Cart Path Way, Bonaire, GA 31005
MLS# 262517Listed by: AMERICOM REALTY OF WARNER ROBINS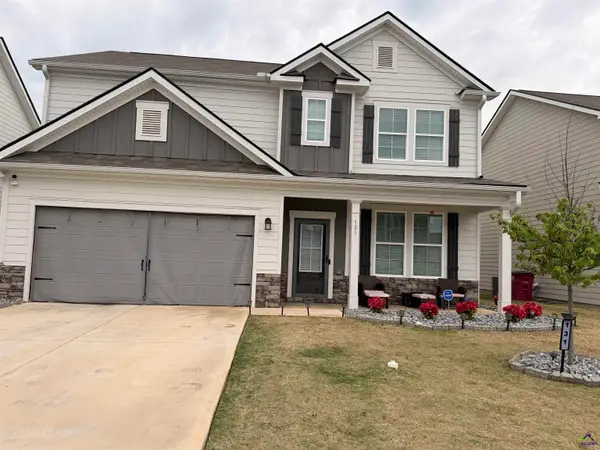 $315,000Active5 beds 3 baths2,340 sq. ft.
131 Red Birch Lane, Warner Robins, GA 31093
MLS# 262519Listed by: SOUTHERN CLASSIC REALTORS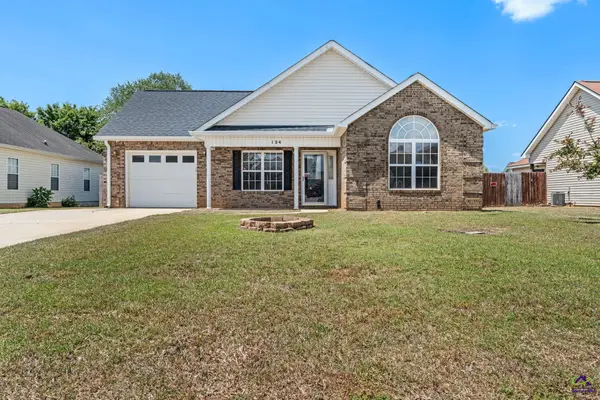 $239,900Pending3 beds 2 baths1,526 sq. ft.
124 Cedarland Drive, Warner Robins, GA 31088
MLS# 262514Listed by: REAL BROKER LLC $545,400Pending6 beds 6 baths5,356 sq. ft.
127 Alton Tucker Sr Blvd, Bonaire, GA 31005
MLS# 262513Listed by: COLDWELL BANKER FREE REALTY $175,000Active4 beds 2 baths1,430 sq. ft.
237 Suzanne Drive, Warner Robins, GA 31093
MLS# 10741078Listed by: BHHS Georgia Properties $339,900Pending4 beds 3 baths2,262 sq. ft.
206 Rhett Court, Warner Robins, GA 31088
MLS# 262505Listed by: COLDWELL BANKER ACCESS REALTY $175,000Active2 beds 1 baths864 sq. ft.
123 Kirkwood Circle, Warner Robins, GA 31088
MLS# 262507Listed by: REAL BROKER LLC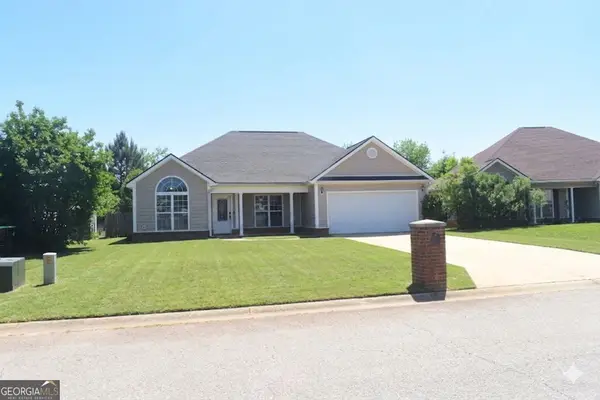 $249,900Active3 beds 2 baths1,450 sq. ft.
111 Raymond Circle, Warner Robins, GA 31088
MLS# 10740290Listed by: Blanchard & Calhoun Real Estate $849,000Active4 beds 4 baths5,122 sq. ft.
207 MILL POND CHASE, Warner Robins, GA 31088
MLS# 262489Listed by: HUDSON REALTY, INC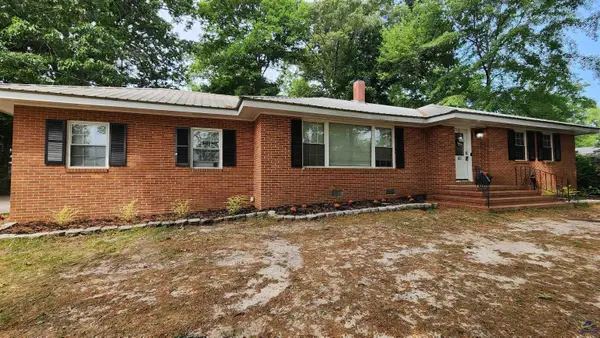 $192,900Pending3 beds 2 baths1,556 sq. ft.
101 Robin Hood Drive, Warner Robins, GA 31088
MLS# 262487Listed by: BARBEE DREAM HOMES REAL ESTATE GROUP LLC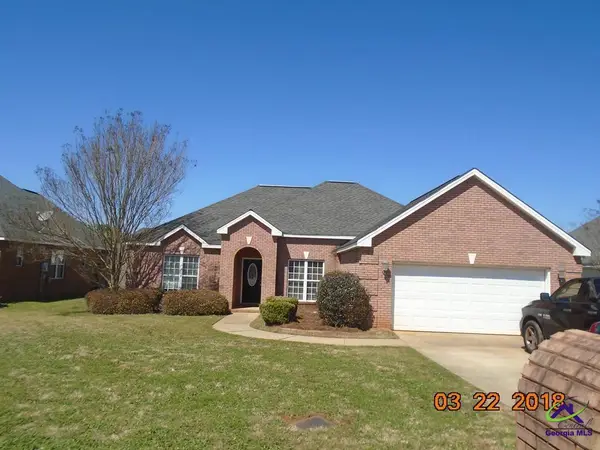 $225,000Pending3 beds 2 baths1,756 sq. ft.
208 Sedgebrooke Drive, Warner Robins, GA 31088
MLS# 262474Listed by: COLDWELL BANKER FREE REALTY $299,000Active5 beds 4 baths3,010 sq. ft.
113 Quail Run Drive, Warner Robins, GA 31088
MLS# 10739655Listed by: Acorn Real Estate $335,000Active4 beds 3 baths2,726 sq. ft.
315 Deven Court, Warner Robins, GA 31088
MLS# 7758028Listed by: COLDWELL BANKER REALTY $410,000Active3 beds 2 baths2,052 sq. ft.
638 Smithville Church Road, Warner Robins, GA 31088
MLS# 262441Listed by: REAL BROKER LLC- Open Sat, 2am to 4pm
 $899,000Active4 beds 6 baths7,848 sq. ft.
117 Carriage Run, Warner Robins, GA 31088
MLS# 10737624Listed by: Keller Williams West Atlanta  $384,900Active4 beds 3 baths2,406 sq. ft.
306 Baxter Drive #5, Kathleen, GA 31047
MLS# 184064Listed by: HUGHSTON HOMES MARKETING, INC. $414,900Active4 beds 3 baths2,778 sq. ft.
402 Baxter Drive #03, Kathleen, GA 31047
MLS# 184065Listed by: HUGHSTON HOMES MARKETING, INC. $419,900Active5 beds 3 baths2,864 sq. ft.
407 Baxter Drive #38, Kathleen, GA 31047
MLS# 184066Listed by: HUGHSTON HOMES MARKETING, INC. $160,000Active4 beds 2 baths1,215 sq. ft.
423 King Drive, Warner Robins, GA 31093
MLS# 10737158Listed by: Maximum One Platinum Realtors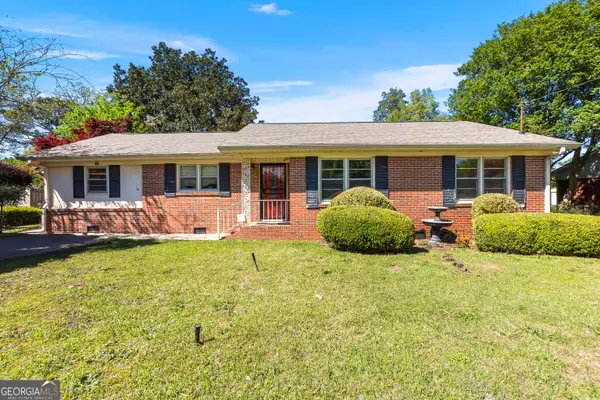 $224,900Active4 beds 3 baths2,576 sq. ft.
116 Woodlawn Avenue, Warner Robins, GA 31093
MLS# 10737294Listed by: Real Broker, LLC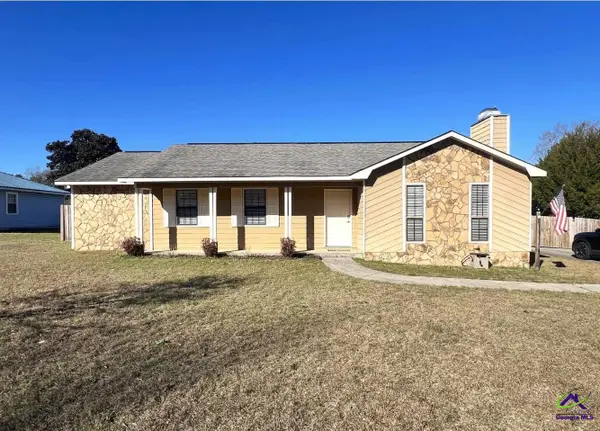 $250,000Active3 beds 2 baths1,529 sq. ft.
108 Turtle Dove Court, Warner Robins, GA 31088
MLS# 262415Listed by: FICKLING & COMPANY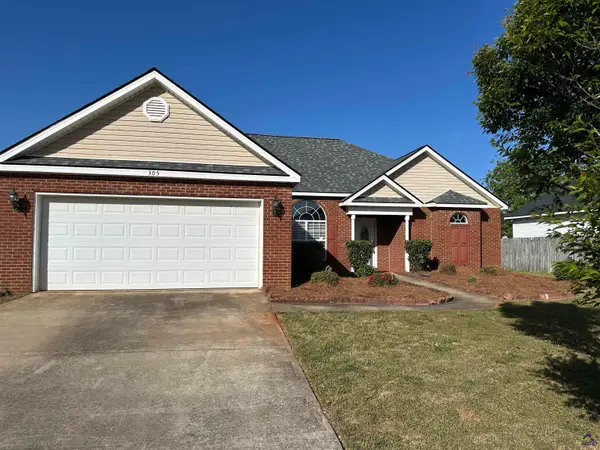 $247,000Pending3 beds 2 baths1,675 sq. ft.
305 Minter Drive, Warner Robins, GA 31088
MLS# 262403Listed by: COLDWELL BANKER FREE REALTY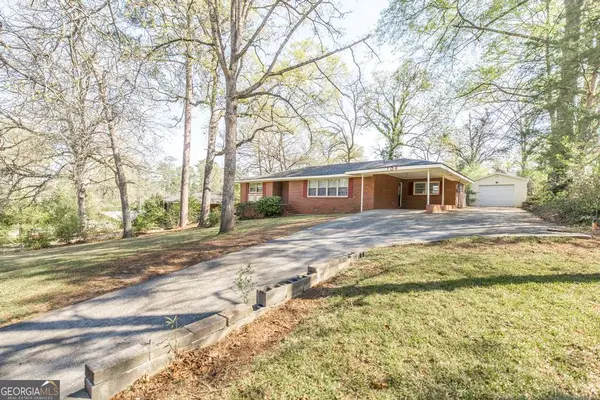 $229,900Active4 beds 2 baths1,696 sq. ft.
104 Mary Lane, Warner Robins, GA 31088
MLS# 10736854Listed by: Rite Choice Realty $234,500Pending3 beds 2 baths1,473 sq. ft.
216 Charlestown Way, Bonaire, GA 31005
MLS# 262396Listed by: REAL BROKER LLC $229,900Active3 beds 2 baths1,340 sq. ft.
132 Larkspur Lane, Bonaire, GA 31005
MLS# 10736547Listed by: Spectrum Real Estate, Inc. $349,900Pending3 beds 2 baths1,870 sq. ft.
102 Rambling Creek Cove, Byron, GA 31008
MLS# 262384Listed by: LANDMARK REALTY $299,900Pending3 beds 3 baths2,176 sq. ft.
273 Lakeshore Drive, Warner Robins, GA 31088
MLS# 262382Listed by: COLDWELL BANKER FREE REALTY $175,000Active3 beds 2 baths1,416 sq. ft.
408 Angus Boulevard, Warner Robins, GA 31088
MLS# 10736314Listed by: eXp Realty $367,000Active4 beds 3 baths2,395 sq. ft.
112 Ballyhara, Warner Robins, GA 31088
MLS# 10736085Listed by: GPS Realty $199,500Active3 beds 2 baths1,353 sq. ft.
604 Gateway Drive, Bonaire, GA 31005
MLS# 10735936Listed by: Landmark Realty $245,000Pending3 beds 3 baths1,580 sq. ft.
107 Bellshill Ct, Warner Robins, GA 31088
MLS# 262359Listed by: SOUTHERN CLASSIC REALTORS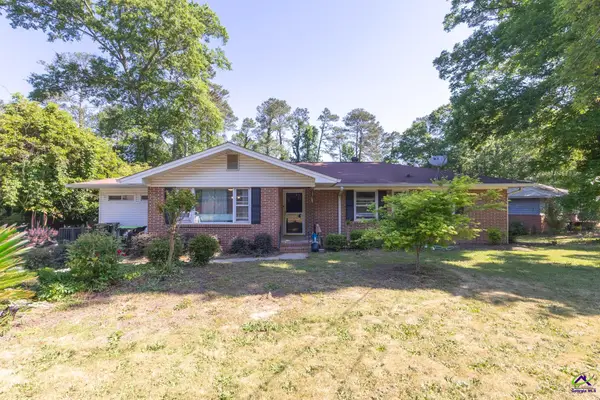 $224,900Active3 beds 2 baths1,966 sq. ft.
408 Skyway Drive, Warner Robins, GA 31088
MLS# 262355Listed by: MF REAL ESTATE FIRM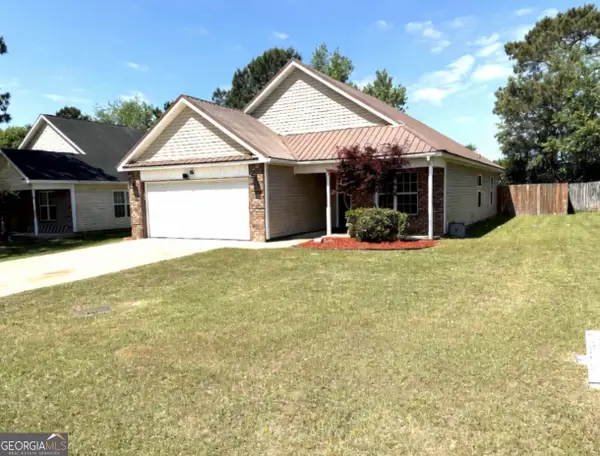 $230,900Active4 beds 2 baths1,581 sq. ft.
338 Hidden Creek Circle, Warner Robins, GA 31088
MLS# 10735524Listed by: Maximum One Platinum Realtors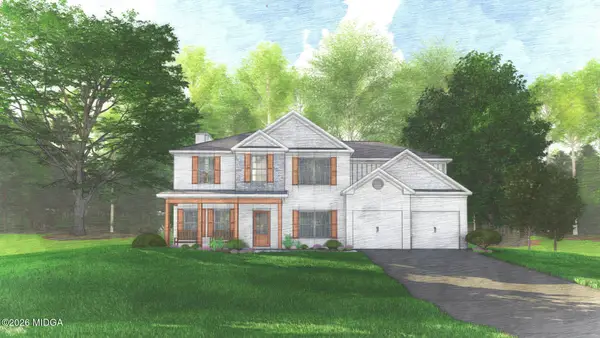 $469,900Pending5 beds 4 baths3,324 sq. ft.
119 Maisie Way #231, Bonaire, GA 31005
MLS# 184017Listed by: HUGHSTON HOMES MARKETING, INC.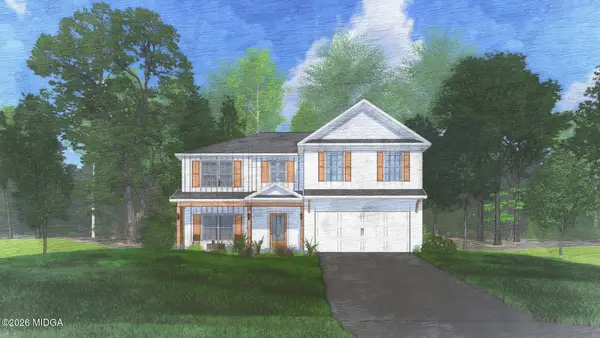 $424,900Pending5 beds 3 baths2,864 sq. ft.
122 Maisie Way #205, Bonaire, GA 31005
MLS# 184015Listed by: HUGHSTON HOMES MARKETING, INC. $245,000Active3 beds 2 baths1,770 sq. ft.
121 Crestwood Road, Warner Robins, GA 31093
MLS# 184011Listed by: ARISE REALTY GROUP LLC $225,000Active3 beds 2 baths1,209 sq. ft.
333 Tyson Glen Drive, Warner Robins, GA 31088
MLS# 10734921Listed by: Robins Realty Group $257,000Active3 beds 2 baths1,811 sq. ft.
104 Haag Drive, Warner Robins, GA 31093
MLS# 10734938Listed by: Robins Realty Group $285,015Active4 beds 3 baths2,024 sq. ft.
426 Lamplight Drive #LOT D56, Warner Robins, GA 31008
MLS# 10734515Listed by: SDC Realty Central Georgia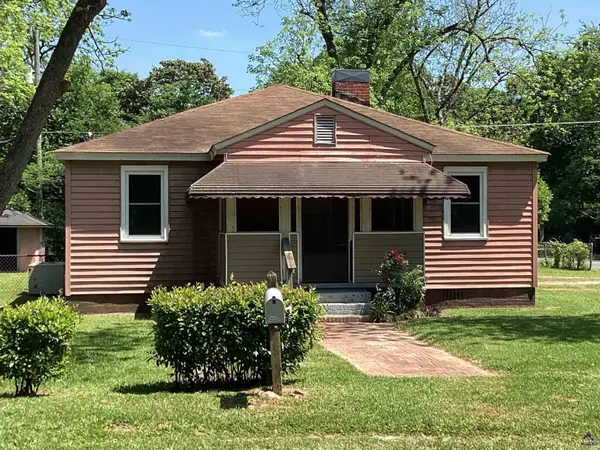 $126,000Active3 beds 2 baths1,235 sq. ft.
124 Meadowdale Drive, Warner Robins, GA 31088
MLS# 262318Listed by: COLDWELL BANKER FREE REALTY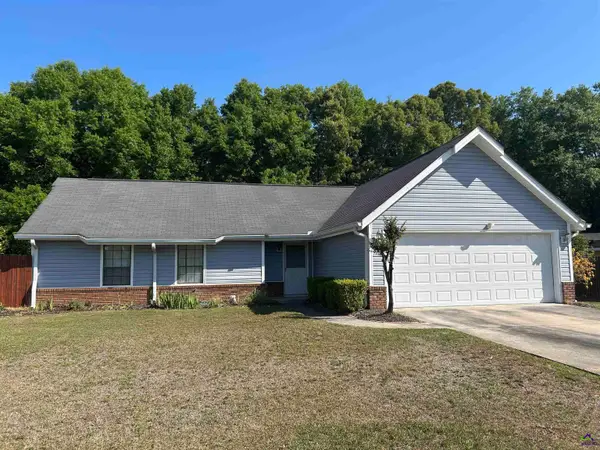 $185,000Pending3 beds 2 baths1,279 sq. ft.
103 Woodfield Drive, Warner Robins, GA 31088
MLS# 262298Listed by: LANDMARK REALTY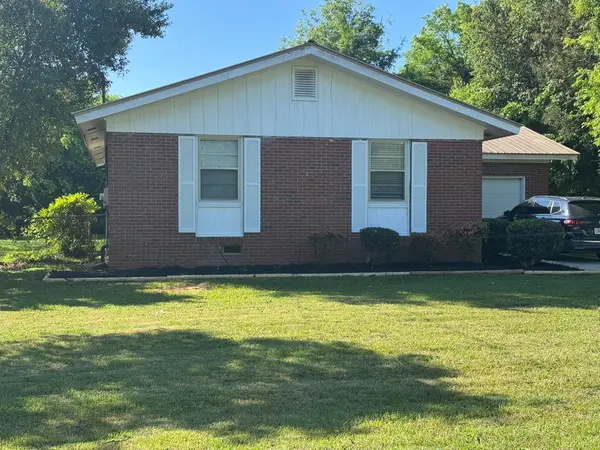 $144,900Active3 beds 1 baths1,254 sq. ft.
1032 Elberta Road, Warner Robins, GA 31093
MLS# 10732208Listed by: Century 21 Homes & Investments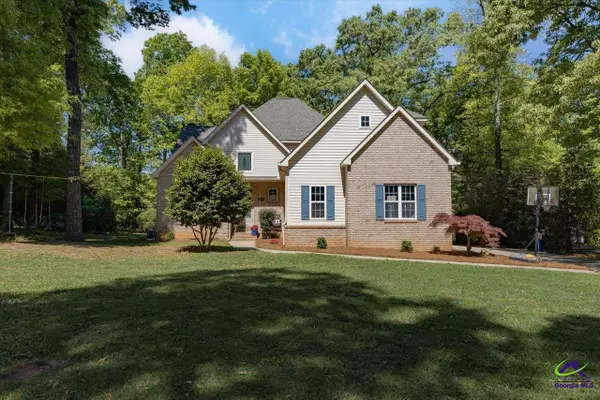 $371,500Pending4 beds 3 baths2,397 sq. ft.
109 Timberlane Avenue, Warner Robins, GA 31088
MLS# 262290Listed by: LANDMARK REALTY $194,000Active3 beds 2 baths1,910 sq. ft.
202 Springdale Drive, Warner Robins, GA 31069
MLS# 262284Listed by: LANDMARK REALTY $169,000Pending3 beds 2 baths1,196 sq. ft.
201 Sonja Drive, Warner Robins, GA 31088
MLS# 262281Listed by: WELLSTON HOMES AND LAND, LLC $284,900Active4 beds 2 baths1,773 sq. ft.
115 Taylor Woods Court, Bonaire, GA 31005
MLS# 10730969Listed by: MF Real Estate Firm $269,000Pending4 beds 2 baths1,678 sq. ft.
139 North Sky, Warner Robins, GA 31093
MLS# 262265Listed by: CENTURY 21 HOMES & INVESTMENTS- Open Sat, 12 to 4pm
 $477,000Active5 beds 3 baths2,854 sq. ft.
207 Bella Notte Circle, Warner Robins, GA 31088
MLS# 10730687Listed by: eXp Realty  $339,000Active4 beds 3 baths2,411 sq. ft.
221 Loudon Hill Drive, Warner Robins, GA 31088
MLS# 10730447Listed by: Joseph Walter Realty, LLC
Local realty services provided by:CENTURY 21 Crowe Realty, CENTURY 21 Homes & Investments, CENTURY 21 Results, CENTURY 21 Premier
2026 Georgia MLS. All rights reserved. Information Deem Reliable But Not Guaranteed June 9, 2026 METROMLS Member Broker: Clinton Crowe
Neighborhoods near Warner Robins, GA
Zip codes near Warner Robins, GA
- 31005 homes for sale
- 31008 homes for sale
- 31014 homes for sale
- 31020 homes for sale
- 31025 homes for sale
- 31028 homes for sale
- 31030 homes for sale
- 31044 homes for sale
- 31047 homes for sale
- 31052 homes for sale
- 31057 homes for sale
- 31069 homes for sale
- 31088 homes for sale
- 31093 homes for sale
- 31098 homes for sale
- 31201 homes for sale
- 31204 homes for sale
- 31206 homes for sale
- 31216 homes for sale
- 31217 homes for sale
Popular searches near Warner Robins, GA
- Bonaire homes for sale
- Byron homes for sale
- Centerville homes for sale
- Cochran homes for sale
- Dry Branch homes for sale
- Elko homes for sale
- Fort Valley homes for sale
- Jeffersonville homes for sale
- Kathleen homes for sale
- Lizella homes for sale
- Macon homes for sale
- Macon-Bibb County homes for sale
- Macon East homes for sale
- Macon West homes for sale
- Marshallville homes for sale
- North Twiggs homes for sale
- Perry homes for sale
- Rutland homes for sale
- South Twiggs homes for sale
- Zenith homes for sale
Protect your home and budget from life's surprises with an Assurant Home Warranty, backed by a partner that supports you through every step of homeownership. Explore Plans.
©2026 Century 21 Real Estate LLC. All rights reserved. CENTURY 21®, the CENTURY 21 Logo and C21® are service marks owned by Century 21 Real Estate LLC. Century 21 Real Estate LLC fully supports the principles of the Fair Housing Act and the Equal Opportunity Act. Each office is independently owned and operated. Listing information is deemed reliable but not guaranteed accurate.