- Adkins homes for sale
- China Grove homes for sale
- Elmendorf homes for sale
- Falls City homes for sale
- Floresville homes for sale
- Gillett homes for sale
- Hobson homes for sale
- Karnes City homes for sale
- La Vernia homes for sale
- Leming homes for sale
- New Berlin homes for sale
- Nixon homes for sale
- Poth homes for sale
- St Hedwig homes for sale
- San Antonio East homes for sale
- Sandy Oaks homes for sale
- Southwest Guadalupe homes for sale
- Stockdale homes for sale
- Sutherland Springs homes for sale
- Zuehl homes for sale
Wilson County, TX - homes for sale
300 of 413 results displayed
- New
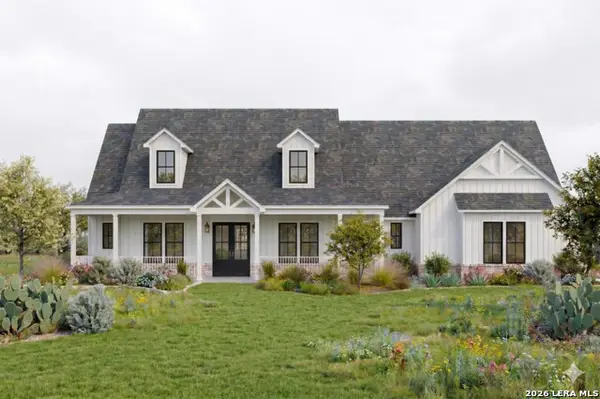
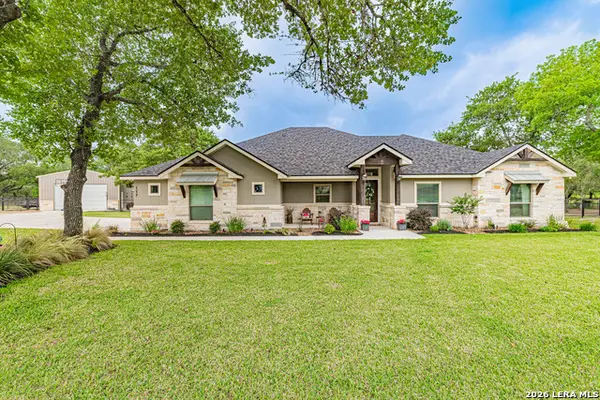
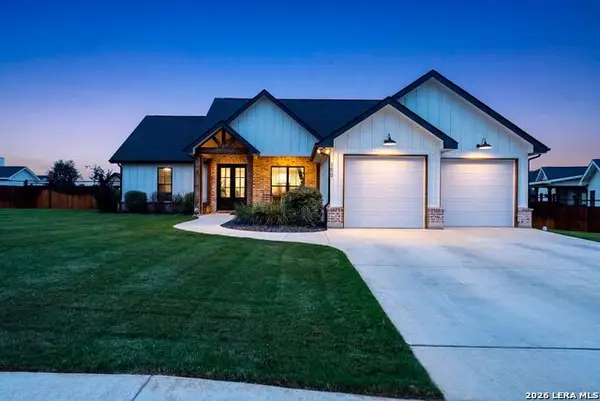 $529,000Active4 beds 2 baths2,033 sq. ft.
156 Woodbridge Dr, La Vernia, TX 78121
MLS# 1964812Listed by: EXP REALTY - New
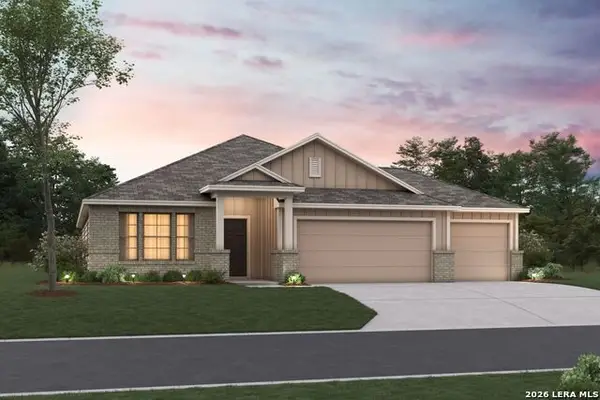
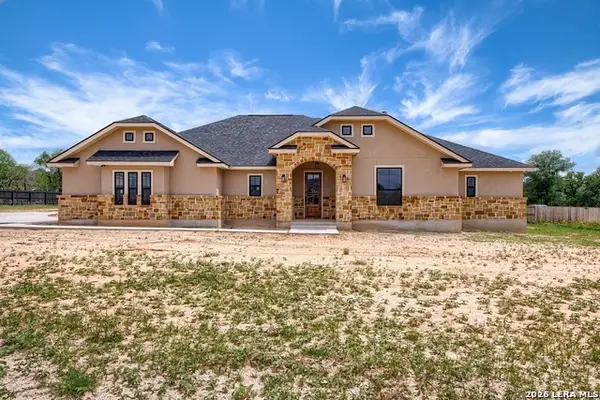
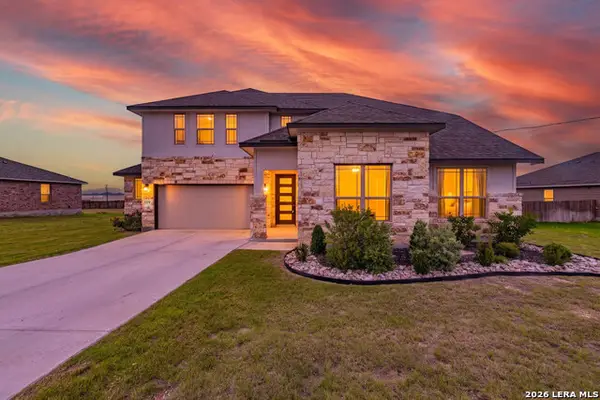 $478,000Active4 beds 3 baths3,219 sq. ft.
109 Willow Oak Trl, Floresville, TX 78114
MLS# 1964829Listed by: HOMESTEAD & RANCH REAL ESTATE - New
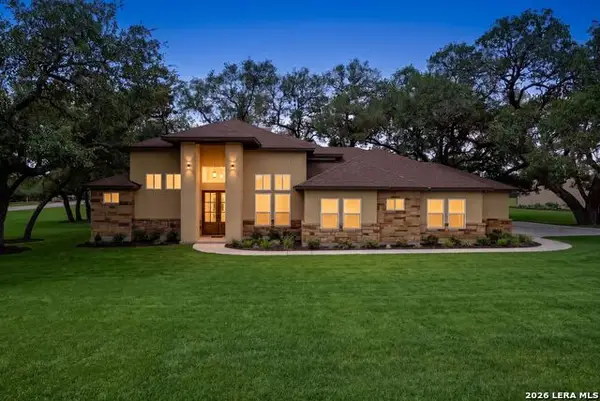
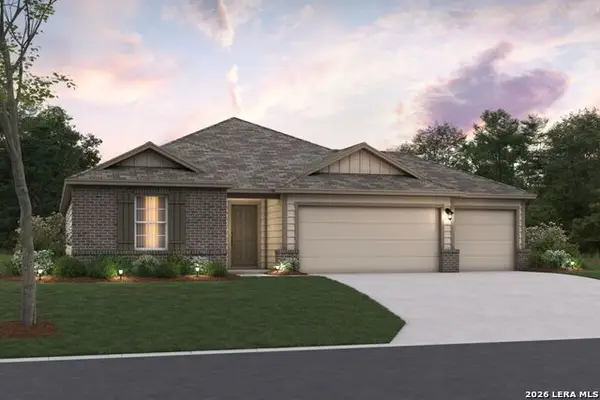
 $350,000Active4 beds 3 baths1,903 sq. ft.
776 Crestview, Floresville, TX 78114
MLS# 1964676Listed by: SOUTH TEXAS REALTY, LLC - New
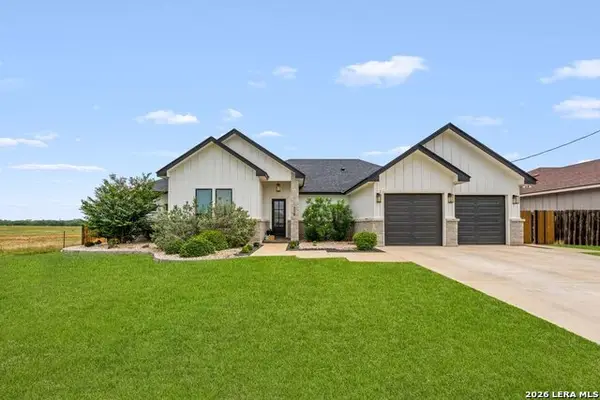
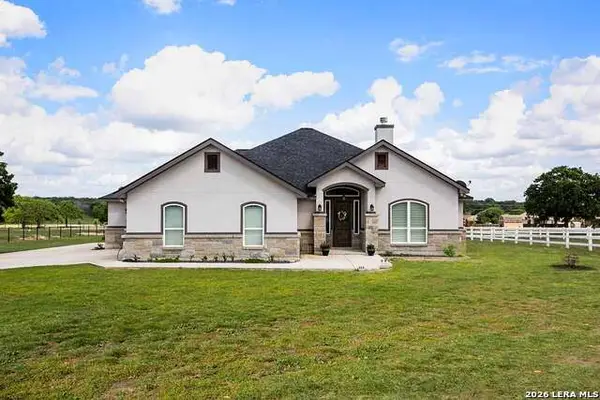
 $489,000Active3 beds 3 baths2,340 sq. ft.
101 Vintage Run Dr, La Vernia, TX 78121
MLS# 1964601Listed by: EXP REALTY - New
 $690,000Active4 beds 3 baths2,203 sq. ft.
238 Cibolo Way, La Vernia, TX 78121
MLS# 1964490Listed by: EPIQUE REALTY LLC - New
 $485,000Active4 beds 3 baths1,817 sq. ft.
116 Park Hts, Poth, TX 78147
MLS# 1964450Listed by: SOUTHERLY & CO. REAL ESTATE - New
 $609,000Active4 beds 3 baths2,654 sq. ft.
109 Summer Meadow Dr, La Vernia, TX 78121
MLS# 1964459Listed by: REFA PROFESSIONALS - New
 $415,000Active3 beds 2 baths
238 Deer Ridge, La Vernia, TX 78121
MLS# 1964435Listed by: REAL BROKER, LLC - New
 $549,900Active4 beds 3 baths2,185 sq. ft.
552 Jacobs Ln, La Vernia, TX 78121
MLS# 1964415Listed by: EXP REALTY - New
 $630,000Active4 beds 4 baths3,398 sq. ft.
107 Oakview, Floresville, TX 78114
MLS# 1964402Listed by: UNITED COUNTRY REAL ESTATE TEXAS RANCH AND HOME - New
 $1,195,000Active4 beds 4 baths2,718 sq. ft.
1891 State Highway 97 E, Floresville, TX 78114
MLS# 1963433Listed by: UNITED COUNTRY REAL ESTATE TEXAS RANCH AND HOME - New
 $650,000Active4 beds 2 baths2,370 sq. ft.
3091 County Road 357, La Vernia, TX 78121
MLS# 1964242Listed by: JOSEPH WALTER REALTY, LLC - Open Sat, 12 to 3pmNew
 $649,000Active4 beds 4 baths2,700 sq. ft.
207 Hidden Ranch, Floresville, TX 78114
MLS# 1963947Listed by: KELLER WILLIAMS HERITAGE  $900,000Active1 beds 2 baths1,522 sq. ft.
203 Champions (two Homes) Boulevard, La Vernia, TX 78121
MLS# 610033Listed by: LEGACY BROKER GROUP- New
 $315,000Active3 beds 3 baths2,116 sq. ft.
465 Middle Green Loop, Floresville, TX 78114
MLS# 1963558Listed by: CLARK REALTY & ASSOCIATES,LLC - New
 $70,000Active3 beds 1 baths836 sq. ft.
708 Peach, Floresville, TX 78114
MLS# 1963466Listed by: 3D REALTY & PROPERTY MANAGEMENT - New
 $299,000Active3 beds 2 baths1,481 sq. ft.
1002 Eagle Crest Dr, Floresville, TX 78114
MLS# 1963339Listed by: BRAY REAL ESTATE GROUP- DALLAS - New
 $475,000Active4 beds 2 baths2,108 sq. ft.
205 Sendera Crossing, La Vernia, TX 78121
MLS# 612503Listed by: LEGACY BROKER GROUP  $900,000Active4 beds 3 baths2,139 sq. ft.
203 Champions Blvd. ( Two Homes ), La Vernia, TX 78121
MLS# 1944135Listed by: LEGACY BROKER GROUP- New
 $460,000Active3 beds 3 baths2,649 sq. ft.
106 Oak Ridge Dr., La Vernia, TX 78121
MLS# 1963087Listed by: KELLER WILLIAMS LEGACY - New
 $630,000Active4 beds 4 baths3,398 sq. ft.
107 Oakview Drive, Floresville, TX 78114
MLS# 611304Listed by: UNITED COUNTRY REAL ESTATE, TE - Open Sat, 11am to 2pmNew
 $265,000Active3 beds 2 baths1,483 sq. ft.
185 Lark Hill Rd, Floresville, TX 78114
MLS# 1962975Listed by: REDBIRD REALTY LLC - New
 $620,000Active4 beds 3 baths2,248 sq. ft.
263 Cibolo Ridge Dr, La Vernia, TX 78121
MLS# 1962904Listed by: HOMESTEAD & RANCH REAL ESTATE - New
 $710,000Active4 beds 3 baths2,162 sq. ft.
181 Champions Blvd, La Vernia, TX 78121
MLS# 1962810Listed by: 1ST CHOICE REALTY GROUP - New
 $650,000Active3 beds 3 baths2,534 sq. ft.
249 Legacy Trail, La Vernia, TX 78121
MLS# 1960137Listed by: M. STAGERS REALTY PARTNERS - New
 $589,999Active4 beds 3 baths2,500 sq. ft.
160 Pradera Ridge, Floresville, TX 78114
MLS# 1962613Listed by: JAKE ANTHONY REALTY, LLC - New
 $179,999Active3 beds 1 baths882 sq. ft.
333 Wildrose Dr, Floresville, TX 78114
MLS# 1962544Listed by: ORCHARD BROKERAGE - Open Sat, 12am to 4pmNew
 $860,000Active3 beds 5 baths4,019 sq. ft.
233 Twin Oaks Dr, La Vernia, TX 78121
MLS# 1962576Listed by: JB GOODWIN, REALTORS - Open Sat, 12 to 4pmNew
 $659,000Active4 beds 4 baths2,870 sq. ft.
158 Estates Dr, La Vernia, TX 78121
MLS# 1962496Listed by: REAL BROKER, LLC - New
 $135,000Active2 beds 1 baths832 sq. ft.
1311 Pine St., Floresville, TX 78114
MLS# 1962368Listed by: LMG REALTY LLC - New
 $429,999Active4 beds 2 baths1,958 sq. ft.
121 Cheyenne Dr, Floresville, TX 78114
MLS# 1962301Listed by: SOVY REALTY GROUP - New
 $754,000Active4 beds 4 baths3,241 sq. ft.
128 Pinot Pl, La Vernia, TX 78121
MLS# 1962268Listed by: WSI REALTY - New
 $497,000Active4 beds 3 baths1,880 sq. ft.
116 Pinot Pl, La Vernia, TX 78121
MLS# 1962228Listed by: WSI REALTY - New
 $536,000Active3 beds 3 baths2,095 sq. ft.
120 Pinot Pl, La Vernia, TX 78121
MLS# 1962239Listed by: WSI REALTY - New
 $551,000Active4 beds 3 baths2,200 sq. ft.
125 Syrah St, La Vernia, TX 78121
MLS# 1962242Listed by: WSI REALTY - New
 $582,000Active4 beds 4 baths2,400 sq. ft.
108 Tempranillo Ter, La Vernia, TX 78121
MLS# 1962255Listed by: WSI REALTY - New
 $579,900Active4 beds 3 baths1,925 sq. ft.
149 Cibolo Ridge Dr, La Vernia, TX 78121
MLS# 1962257Listed by: SOUTHERLY & CO. REAL ESTATE - New
 $429,990Active3 beds 2 baths1,930 sq. ft.
121 Prescott Drive, Floresville, TX 78114
MLS# 1962099Listed by: ESCAPE REALTY - New
 $439,990Active4 beds 3 baths2,211 sq. ft.
128 Greeley Drive, Floresville, TX 78114
MLS# 1962080Listed by: ESCAPE REALTY - New
 $409,990Active4 beds 2 baths1,958 sq. ft.
124 Greeley Drive, Floresville, TX 78114
MLS# 1962072Listed by: ESCAPE REALTY - New
 $435,000Active3 beds 2 baths1,684 sq. ft.
206 S Palo Alto Drive, Floresville, TX 78114
MLS# 1962069Listed by: SOUTH TEXAS REALTY, LLC  $380,000Pending3 beds 2 baths1,587 sq. ft.
628 Sunshine Mdw, Adkins, TX 78101
MLS# 1961919Listed by: COLDWELL BANKER D'ANN HARPER, REALTOR- New
 $650,000Active3 beds 3 baths2,553 sq. ft.
172 Bobby Lynn, Adkins, TX 78101
MLS# 1961923Listed by: COLDWELL BANKER D'ANN HARPER - New
 $485,000Active3 beds 2 baths1,674 sq. ft.
197 Cibolo Ridge Dr, La Vernia, TX 78121
MLS# 1961940Listed by: REAL BROKER, LLC - New
 $460,000Active3 beds 2 baths2,129 sq. ft.
113 Miller Cv, La Vernia, TX 78121
MLS# 1961800Listed by: SOUTH ROOTS REALTY - Open Sat, 1 to 4pmNew
 $579,900Active4 beds 3 baths2,472 sq. ft.
104 N Tranquility, La Vernia, TX 78121
MLS# 1961712Listed by: FULMER REALTY, LLC - New
 $659,900Active3 beds 3 baths2,422 sq. ft.
117 Shelby, Adkins, TX 78101
MLS# 1961673Listed by: REAL BROKER, LLC - New
 $1,100,000Active4 beds 4 baths3,466 sq. ft.
128 Bridgewater Dr, La Vernia, TX 78121
MLS# 1961551Listed by: HOMESTEAD & RANCH REAL ESTATE - New
 $665,900Active4 beds 4 baths2,607 sq. ft.
116 Hondo Ridge Dr, La Vernia, TX 78121
MLS# 1961596Listed by: CRISP REALTY, INC. - New

 $465,000Active5 beds 4 baths4,849 sq. ft.
601 State Highway 123 N, Stockdale, TX 78160
MLS# 611952Listed by: CENTURY 21 RUNNING S REALTY  $449,000Active4 beds 3 baths3,710 sq. ft.
106 Hickory Cir, Floresville, TX 78114
MLS# 1892102Listed by: 1ST CHOICE WEST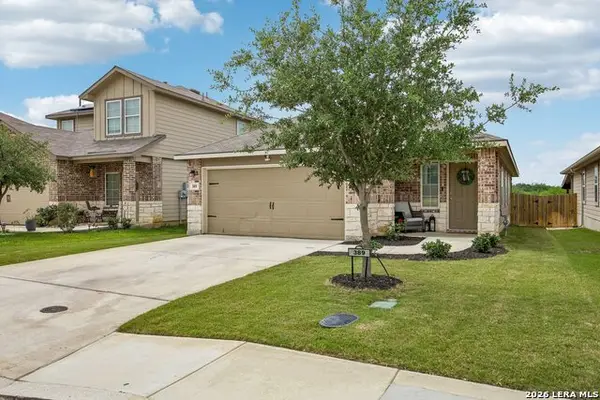 $259,900Active3 beds 2 baths1,396 sq. ft.
389 Middle Green Loop, Floresville, TX 78114
MLS# 1961291Listed by: KELLER WILLIAMS CITY-VIEW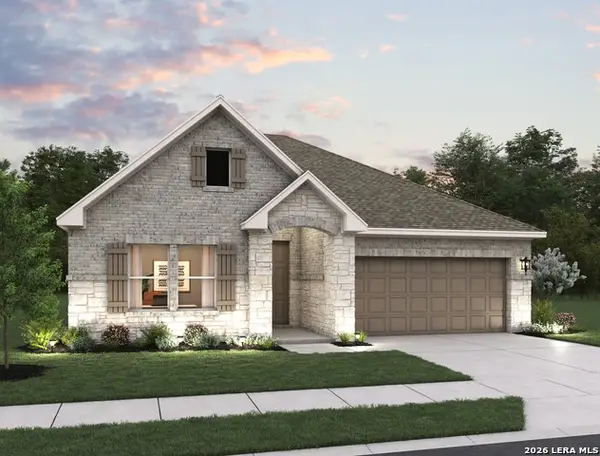 $391,990Active4 beds 3 baths1,916 sq. ft.
242 Brood Dr, Adkins, TX 78101
MLS# 1960912Listed by: EXP REALTY $424,900Active3 beds 3 baths1,698 sq. ft.
721 N Dickson, Poth, TX 78147
MLS# 1960759Listed by: RE/MAX SOUTHERN ESTATE REALTY $425,000Pending4 beds 2 baths2,167 sq. ft.
2520 County Road 319, La Vernia, TX 78121
MLS# 1960660Listed by: KELLER WILLIAMS HERITAGE $556,000Active4 beds 2 baths2,201 sq. ft.
133 Sendera Crossing, La Vernia, TX 78121
MLS# 1960737Listed by: JB GOODWIN, REALTORS $675,000Active4 beds 4 baths2,525 sq. ft.
104 Abrego Knoll Dr, Floresville, TX 78114
MLS# 1960571Listed by: EXP REALTY $895,000Active2 beds 2 baths1,541 sq. ft.
1277 County Road 138, Floresville, TX 78114
MLS# 1960552Listed by: HIGHRIDGE LAND AND HOMES $52,000Active3 beds 2 baths1,248 sq. ft.
602 S 6th St, Stockdale, TX 78160
MLS# 1960488Listed by: CONFIDENCE REALTY GROUP $475,000Active5 beds 4 baths2,753 sq. ft.
903 E Westmeyer, Poth, TX 78147
MLS# 1960494Listed by: SOUTH TEXAS REALTY, LLC $267,500Active3 beds 2 baths1,648 sq. ft.
728 Crestview, Floresville, TX 78114
MLS# 1960232Listed by: KELLER WILLIAMS HERITAGE- Open Sat, 1 to 4pm
 $794,900Active4 beds 4 baths2,969 sq. ft.
104 Reserve Court, La Vernia, TX 78121
MLS# 1960128Listed by: FULMER REALTY, LLC  $350,000Active4 beds 4 baths2,870 sq. ft.
120 Center Creek Drive, Floresville, TX 78114
MLS# 1959886Listed by: MAGNOLIA REALTY $699,000Active4 beds 3 baths2,614 sq. ft.
173 Bobby Lynn Drive, Adkins, TX 78101
MLS# 78727653Listed by: KELLER WILLIAMS SIGNATURE $595,000Active4 beds 2 baths2,222 sq. ft.
129 Sendera Xing, La Vernia, TX 78121
MLS# 1959639Listed by: SOUTH ROOTS REALTY $1,385,000Active5 beds 3 baths2,746 sq. ft.
1224 Fm 3432, La Vernia, TX 78121
MLS# 608928Listed by: TKO LISTINGS, LLC $89,900Active2 beds 2 baths1,056 sq. ft.
12475 Fm 1681, Nixon, TX 78140
MLS# 611212Listed by: COLDWELL BANKER D'ANN HARPER $350,000Active3 beds 2 baths1,678 sq. ft.
128 Parkcrest, Floresville, TX 78114
MLS# 1959454Listed by: ORCHARD BROKERAGE $199,999Active3 beds 2 baths1,124 sq. ft.
501 E Westmeyer St, Poth, TX 78147
MLS# 1959443Listed by: REAL BROKER, LLC $425,000Active3 beds 3 baths2,545 sq. ft.
608 F St, Floresville, TX 78114
MLS# 1959417Listed by: SOUTH TEXAS LAND & HOME $607,779Active4 beds 3 baths2,557 sq. ft.
155 Pradera Ridge Drive, Floresville, TX 78114
MLS# 1959374Listed by: PATRICK THOMPSON, BROKER $600,244Active4 beds 4 baths2,622 sq. ft.
164 Pradera Ridge Drive, Floresville, TX 78114
MLS# 1959375Listed by: PATRICK THOMPSON, BROKER $1,499,000Active4 beds 4 baths3,816 sq. ft.
78 Marx Lane, La Vernia, TX 78121
MLS# 1959242Listed by: FULMER REALTY, LLC $565,000Active4 beds 2 baths1,845 sq. ft.
700 Lake Valley, La Vernia, TX 78121
MLS# 1959234Listed by: HOMESTEAD & RANCH REAL ESTATE $275,000Active2 beds 1 baths1,104 sq. ft.
429 Quail Hollow Dr, Adkins, TX 78101
MLS# 1958941Listed by: DAVIDSON PROPERTIES, INC. $375,000Active2 beds 2 baths1,247 sq. ft.
124 Home Pl, Adkins, TX 78101
MLS# 1958878Listed by: OPTION ONE REAL ESTATE $709,950Active4 beds 3 baths2,989 sq. ft.
156 Crescent Ridge, Adkins, TX 78101
MLS# 1958700Listed by: EXP REALTY $272,500Active3 beds 2 baths1,546 sq. ft.
150 Legendary Trail Loop, Floresville, TX 78114
MLS# 610590Listed by: VISTA REALTY $289,000Active3 beds 2 baths1,662 sq. ft.
604 Schneider, Poth, TX 78147
MLS# 1958458Listed by: DWELL REAL ESTATE GROUP $649,000Active5 beds 4 baths2,925 sq. ft.
136 Sunset, La Vernia, TX 78121
MLS# 1958340Listed by: LONGHORN REALTY $899,900Active3 beds 3 baths2,867 sq. ft.
128 Bucks, La Vernia, TX 78121
MLS# 1958378Listed by: COLDWELL BANKER D'ANN HARPER $450,000Active3 beds 3 baths2,129 sq. ft.
1271 County Road 119, Floresville, TX 78114
MLS# 1958231Listed by: HOMESTEAD & RANCH REAL ESTATE $589,900Active3 beds 4 baths2,452 sq. ft.
218 Deer Ridge, La Vernia, TX 78121
MLS# 1958012Listed by: HOMESTEAD & RANCH REAL ESTATE $347,000Active3 beds 2 baths1,606 sq. ft.
201 Brinkoeter St, Poth, TX 78147
MLS# 1958008Listed by: SOUTH TEXAS LAND & HOME $729,900Pending4 beds 4 baths2,859 sq. ft.
152 Hondo Ridge, La Vernia, TX 78121
MLS# 1957955Listed by: FULMER REALTY, LLC $598,900Pending4 beds 3 baths2,512 sq. ft.
204 Ash Pkwy, La Vernia, TX 78121
MLS# 1957908Listed by: LISTING RESULTS, LLC $397,900Active3 beds 3 baths2,142 sq. ft.
130 Merion Ln, La Vernia, TX 78121
MLS# 1957855Listed by: SEPPALA REAL ESTATE GROUP $518,700Active4 beds 3 baths1,848 sq. ft.
4029 County Road 117, Floresville, TX 78114
MLS# 1957778Listed by: PREMIER REALTY GROUP PLATINUM $480,000Active3 beds 2 baths1,666 sq. ft.
124 Elm Country Dr, La Vernia, TX 78121
MLS# 1957754Listed by: TOM VILLA REALTY $599,300Active4 beds 4 baths2,819 sq. ft.
424 Homecrest Dr, La Vernia, TX 78121
MLS# 1957643Listed by: REALHOME SERVICES & SOLUTIONS $562,000Active3 beds 3 baths1,500 sq. ft.
1186 Us Highway 181, Floresville, TX 78114
MLS# 1957387Listed by: FOSTER FAMILY REAL ESTATE $769,000Active4 beds 3 baths2,751 sq. ft.
120 Timber Heights, La Vernia, TX 78121
MLS# 1957388Listed by: FOSTER FAMILY REAL ESTATE $344,900Pending3 beds 2 baths1,426 sq. ft.
218 Colonial, La Vernia, TX 78121
MLS# 1957233Listed by: NOLAV REALTY LLC $555,000Active4 beds 3 baths2,569 sq. ft.
1855 Burr Oak Ln, Adkins, TX 78101
MLS# 1957054Listed by: ORCHARD BROKERAGE $499,000Active4 beds 2 baths2,111 sq. ft.
217 Hunters Dawn, La Vernia, TX 78121
MLS# 1957125Listed by: EXP REALTY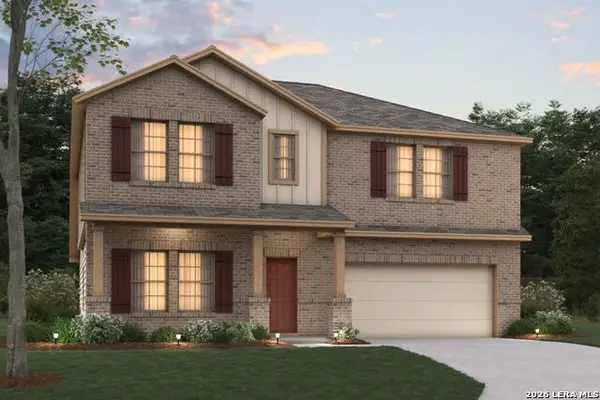 $458,970Active4 beds 3 baths2,819 sq. ft.
109 Prescott Dr, Floresville, TX 78114
MLS# 1956907Listed by: ESCAPE REALTY $629,900Active4 beds 4 baths2,480 sq. ft.
177 Timber, La Vernia, TX 78121
MLS# 1956721Listed by: CROSSPOINT REALTY, LLC $369,990Active4 beds 3 baths1,875 sq. ft.
120 Peeps Ct., Adkins, TX 78101
MLS# 1956564Listed by: EXP REALTY $399,000Active3 beds 2 baths1,994 sq. ft.
117 Fairway, Floresville, TX 78114
MLS# 1956620Listed by: KELLER WILLIAMS HERITAGE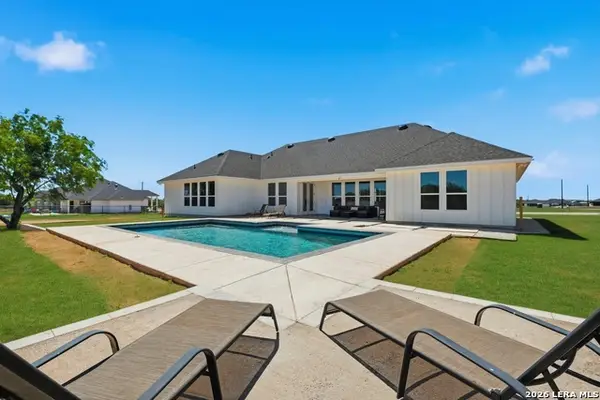 $629,000Pending4 beds 3 baths2,551 sq. ft.
113 Hidden Hills, Floresville, TX 78114
MLS# 1956434Listed by: LEVI RODGERS REAL ESTATE GROUP $399,990Pending4 beds 3 baths2,165 sq. ft.
306 Brood Dr, Adkins, TX 78101
MLS# 1956376Listed by: EXP REALTY $650,000Active4 beds 2 baths2,542 sq. ft.
121 Westfield Lndg, La Vernia, TX 78121
MLS# 1956407Listed by: LPT REALTY, LLC $289,900Active3 beds 3 baths1,937 sq. ft.
141 Bunkers Hill Rd, Floresville, TX 78114
MLS# 1956410Listed by: KELLER WILLIAMS HERITAGE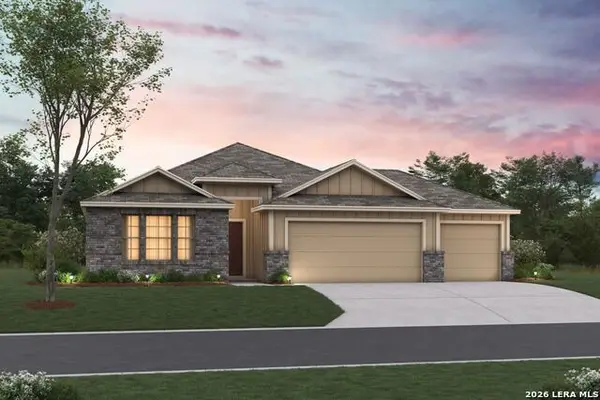 $429,990Active4 beds 3 baths2,025 sq. ft.
117 Prescott Drive, Floresville, TX 78114
MLS# 1955913Listed by: ESCAPE REALTY $900,000Active1 beds 2 baths1,518 sq. ft.
203 UNIT B Champions Blvd (two Homes), La Vernia, TX 78121
MLS# 1955917Listed by: LEGACY BROKER GROUP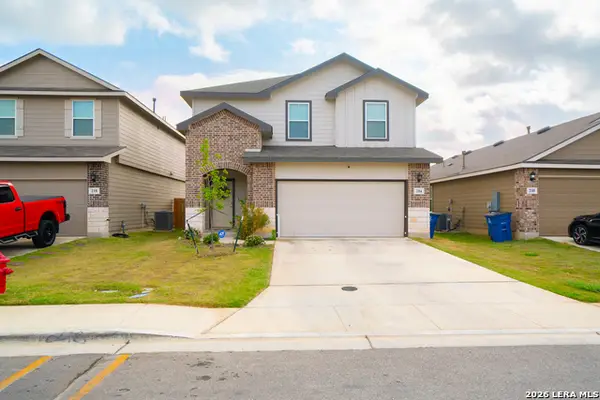 $285,000Active4 beds 3 baths1,952 sq. ft.
214 Legendary Trail Loop, Floresville, TX 78114
MLS# 1955701Listed by: EXP REALTY $639,950Active3 beds 4 baths3,300 sq. ft.
Tract 2 11.95 AC - 1460 E State Highway 87, Nixon, TX 78140
MLS# 2819191Listed by: SWOPE & YOUNG LAND COMPANY $333,900Pending4 beds 2 baths1,751 sq. ft.
188 Turnberry Dr, La Vernia, TX 78121
MLS# 9969478Listed by: SEPPALA REAL ESTATE GROUP $579,000Active4 beds 3 baths2,300 sq. ft.
200 Cibolo Way, La Vernia, TX 78121
MLS# 1955497Listed by: FOSTER FAMILY REAL ESTATE $789,000Active4 beds 3 baths3,152 sq. ft.
230 Shamrock, Floresville, TX 78114
MLS# 1955439Listed by: SOUTH TEXAS REALTY, LLC $589,000Active4 beds 3 baths2,400 sq. ft.
142 Timber Place, La Vernia, TX 78121
MLS# 1955442Listed by: FOSTER FAMILY REAL ESTATE $365,000Active3 beds 2 baths1,811 sq. ft.
145 Gentle Breeze, Floresville, TX 78114
MLS# 609715Listed by: KELLER WILLIAMS HERITAGE $540,000Active3 beds 2 baths2,065 sq. ft.
120 Magnolia, La Vernia, TX 78121
MLS# 1955330Listed by: REAL BROKER, LLC $270,000Pending3 beds 2 baths2,008 sq. ft.
805 S 6th Street, Stockdale, TX 78160
MLS# 608692Listed by: RE/MAX FIRST SHOT $1,000,049Active4 beds 4 baths3,343 sq. ft.
121 N. Abrego Crossing, Floresville, TX 78114
MLS# 1955225Listed by: BELMARES PROPERTIES, L.L.C. $749,000Active4 beds 3 baths3,269 sq. ft.
15820 Fm 539, La Vernia, TX 78121
MLS# 1955114Listed by: KELLER WILLIAMS HERITAGE $620,000Active4 beds 3 baths2,716 sq. ft.
112 S Abrego Crossing, Floresville, TX 78114
MLS# 1954962Listed by: RE/MAX NORTH-SAN ANTONIO $430,000Active3 beds 2 baths2,050 sq. ft.
213 Bluebonnet Ridge, La Vernia, TX 78121
MLS# 1954953Listed by: WATTERS INTERNATIONAL REALTY $465,000Active5 beds 4 baths4,849 sq. ft.
601 State Highway 123, Stockdale, TX 78160
MLS# 1954907Listed by: CENTURY 21 RUNNING S REALTY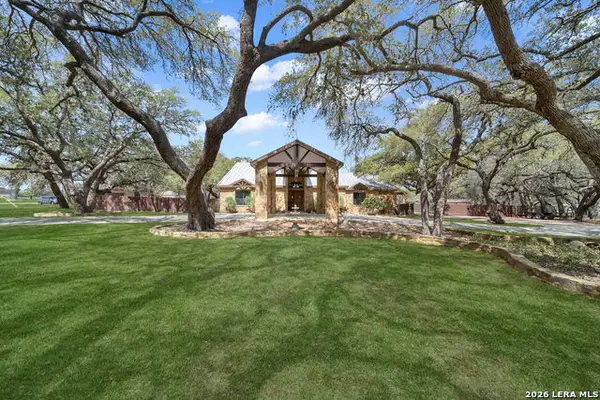 $699,000Active3 beds 2 baths3,049 sq. ft.
100 Vintage Trail Dr, La Vernia, TX 78121
MLS# 1952652Listed by: EXP REALTY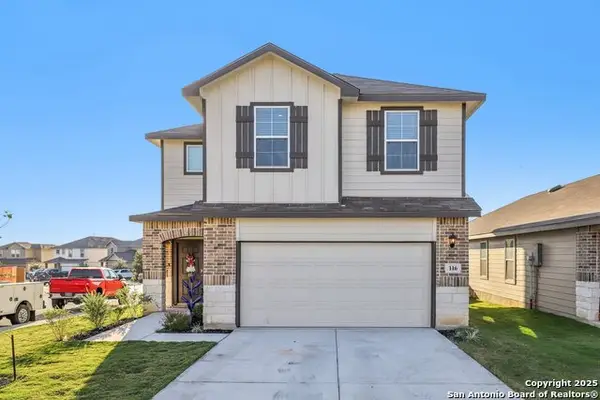 $304,900Active4 beds 3 baths2,223 sq. ft.
116 Middle Green, Floresville, TX 78114
MLS# 1954746Listed by: REAL BROKER, LLC $395,000Active3 beds 2 baths2,434 sq. ft.
135 Pullman, La Vernia, TX 78121
MLS# 1954458Listed by: THE REALTY PLACE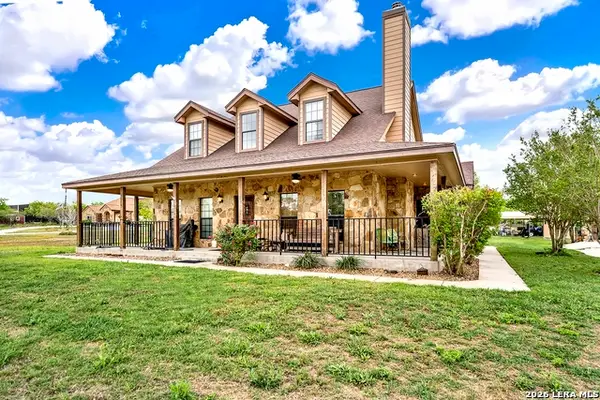 $604,000Active3 beds 4 baths3,169 sq. ft.
3283 Hartfield, La Vernia, TX 78121
MLS# 1954461Listed by: SOUTH ROOTS REALTY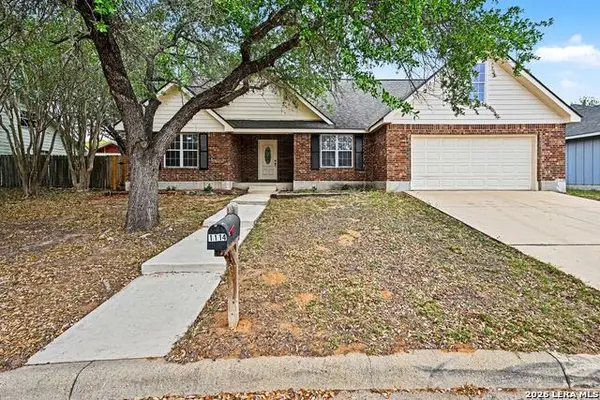 $359,500Pending3 beds 2 baths1,679 sq. ft.
1114 Iris Crescent, Floresville, TX 78114
MLS# 1954493Listed by: ORCHARD BROKERAGE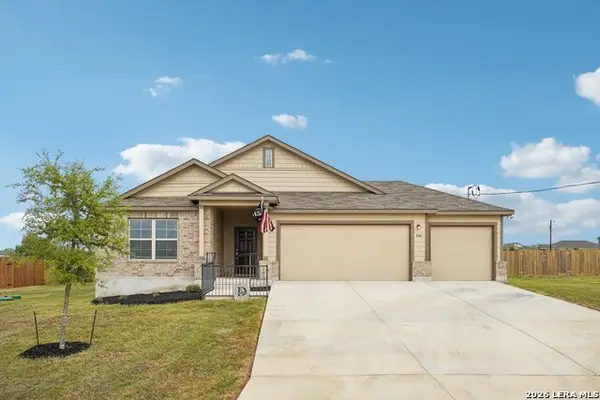 $437,500Active4 beds 3 baths2,218 sq. ft.
104 Pendleton Cv, Floresville, TX 78114
MLS# 1954408Listed by: REAL BROKER, LLC $550,000Active4 beds 2 baths2,124 sq. ft.
100 County Road 423, Stockdale, TX 78160
MLS# 7847180Listed by: SUNNY LANE REALTY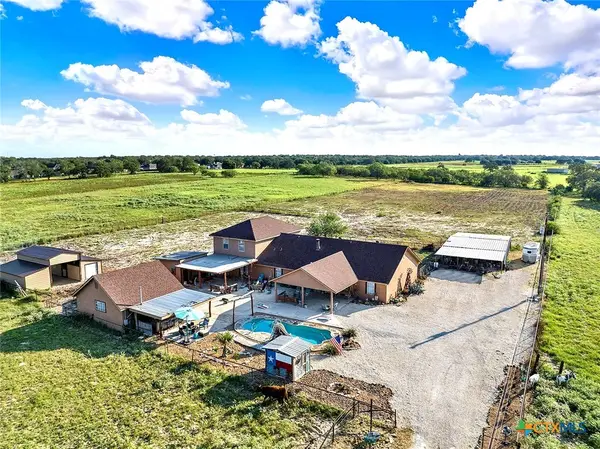 $795,000Active6 beds 5 baths3,888 sq. ft.
10470 Fm 539, Sutherland Springs, TX 78161
MLS# 609239Listed by: TKO LISTINGS, LLC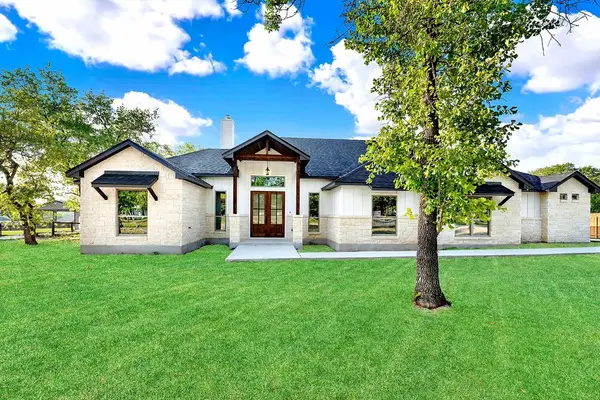 $699,500Active4 beds 4 baths2,840 sq. ft.
249 Cibolo Way, La Vernia, TX 78121
MLS# 76289620Listed by: RED PEAR REALTY $639,900Active4 beds 3 baths2,411 sq. ft.
246 Cibolo Way, La Vernia, TX 78121
MLS# 1953779Listed by: M EFFECT REALTY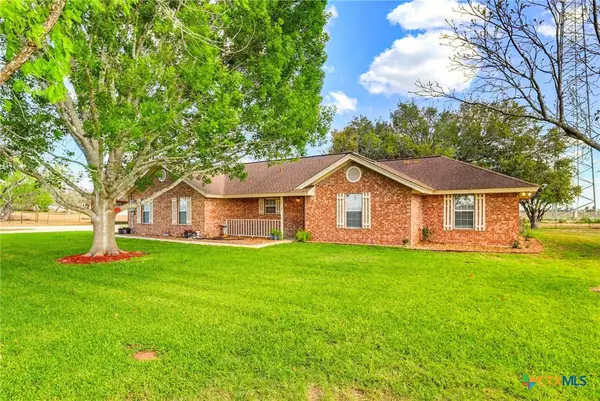 $598,000Active3 beds 2 baths1,649 sq. ft.
8416 Fm 541, Stockdale, TX 78160
MLS# 608988Listed by: TS REALTY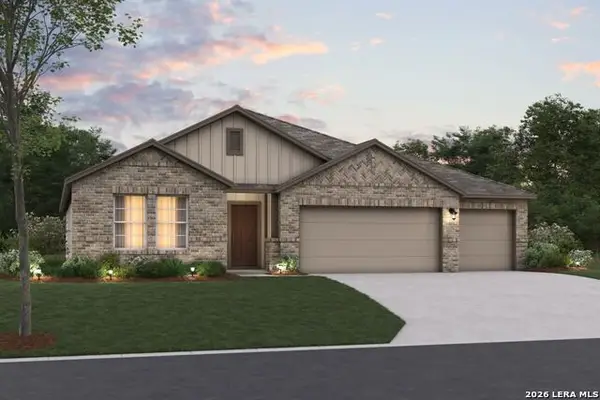 $389,990Active3 beds 2 baths1,958 sq. ft.
112 Greeley Drive, Floresville, TX 78114
MLS# 1953250Listed by: ESCAPE REALTY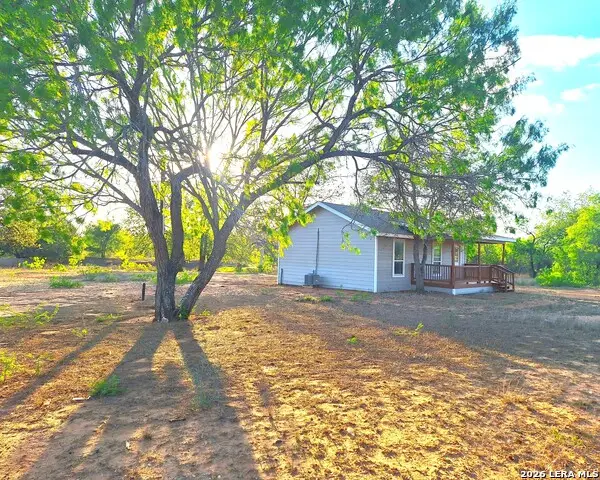 $285,000Pending2 beds 1 baths750 sq. ft.
4904 Blackhill, Floresville, TX 78114
MLS# 1953060Listed by: SHARON PETERS $1,385,000Active5 beds 3 baths2,800 sq. ft.
1224 Fm 3432, La Vernia, TX 78101
MLS# 1951201Listed by: TKO LISTINGS, LLC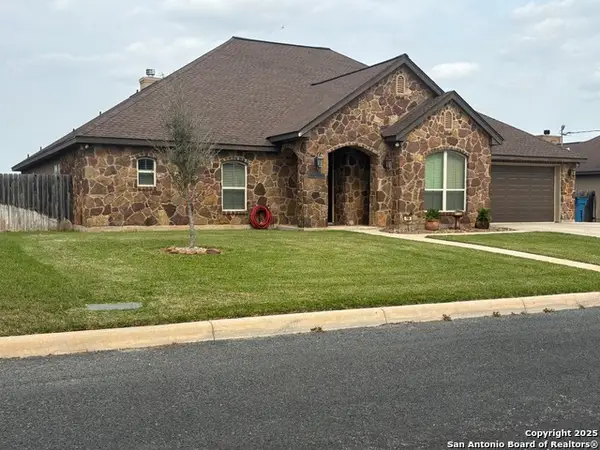 $598,000Active4 beds 5 baths3,530 sq. ft.
104 Park View, Poth, TX 78147
MLS# 1952970Listed by: KELLER WILLIAMS BOERNE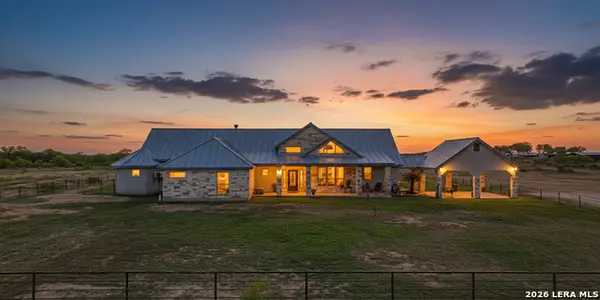 $1,150,000Active5 beds 4 baths3,538 sq. ft.
946 County Road 361, La Vernia, TX 78121
MLS# 1952948Listed by: HOMESTEAD & RANCH REAL ESTATE $420,000Active4 beds 3 baths1,880 sq. ft.
104 S Elise Dr, La Vernia, TX 78121
MLS# 1952823Listed by: EXP REALTY $420,000Active3 beds 3 baths2,438 sq. ft.
902 Eagle Creek Dr., Floresville, TX 78114
MLS# 1952509Listed by: TKO LISTINGS, LLC $547,000Active4 beds 3 baths2,390 sq. ft.
193 Oak Fields Dr, Floresville, TX 78114
MLS# 1952538Listed by: FOSTER FAMILY REAL ESTATE $780,000Active4 beds 3 baths2,479 sq. ft.
166 Big Oak Dr, Adkins, TX 78101
MLS# 1952378Listed by: VORTEX REALTY $329,999Active3 beds 2 baths1,797 sq. ft.
1312 C St, Floresville, TX 78114
MLS# 1942289Listed by: EXP REALTY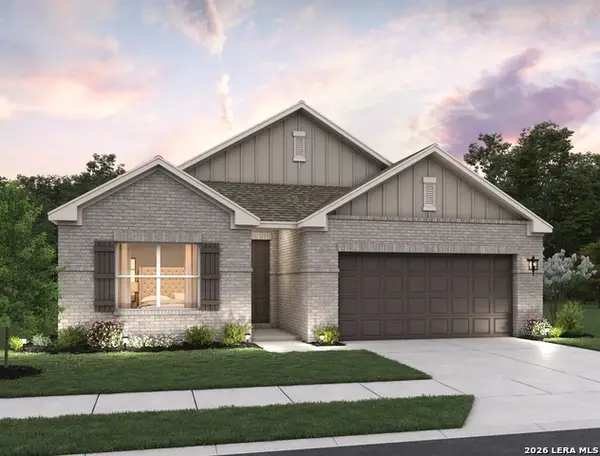 $392,990Active4 beds 3 baths2,096 sq. ft.
310 Brood Dr, Adkins, TX 78101
MLS# 1952341Listed by: EXP REALTY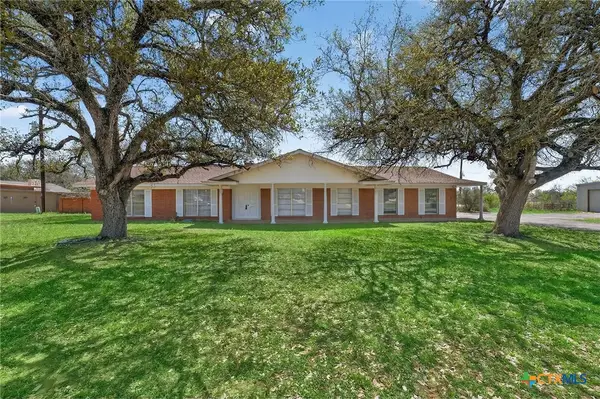 $389,990Active3 beds 2 baths2,618 sq. ft.
514 Hospital Boulevard, Floresville, TX 78114
MLS# 606879Listed by: REAL BROKER, LLC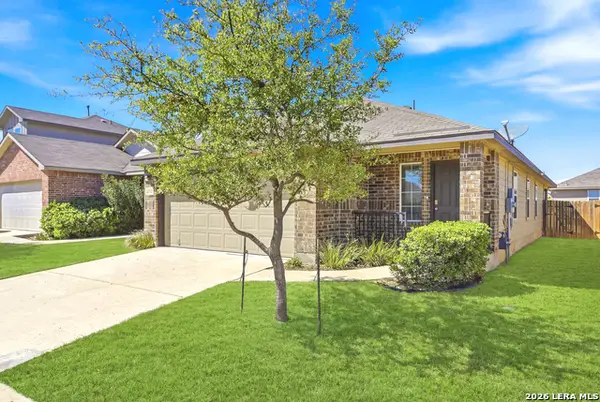 $306,000Active3 beds 2 baths1,396 sq. ft.
216 E Middle Green Loop, Floresville, TX 78114
MLS# 1952138Listed by: HARZHEIM PROPERTIES, LLC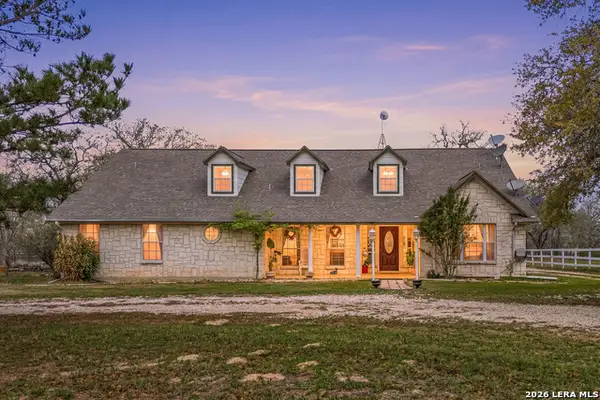 $625,000Active3 beds 2 baths2,409 sq. ft.
837 Paddy Rd, Floresville, TX 78114
MLS# 1950831Listed by: REDFIN CORPORATION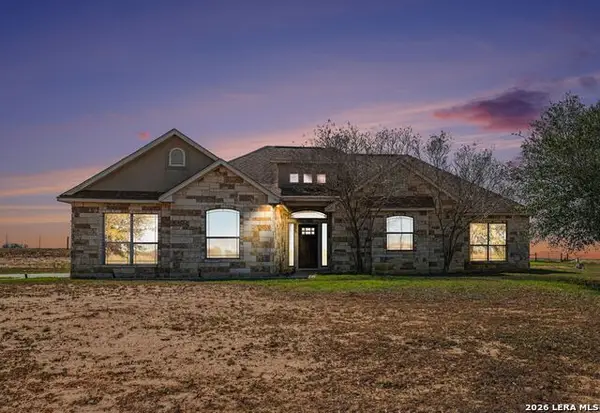 $475,000Pending3 beds 2 baths2,161 sq. ft.
3270 County Road 405, Floresville, TX 78114
MLS# 1951839Listed by: ORCHARD BROKERAGE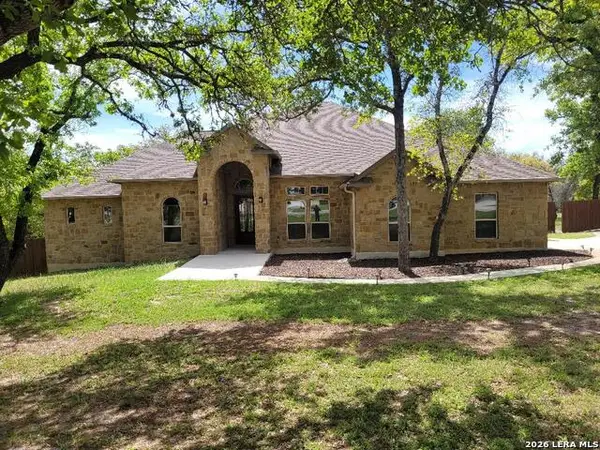 $665,000Active4 beds 3 baths2,500 sq. ft.
218 Champions Blvd, La Vernia, TX 78121
MLS# 1951762Listed by: KELLER WILLIAMS CITY-VIEW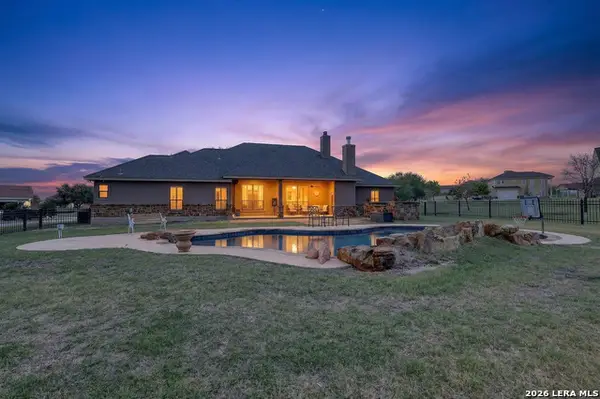 $848,000Active4 beds 3 baths2,535 sq. ft.
121 Abrego Mount, Floresville, TX 78114
MLS# 1951769Listed by: RE/MAX SOUTHERN ESTATE REALTY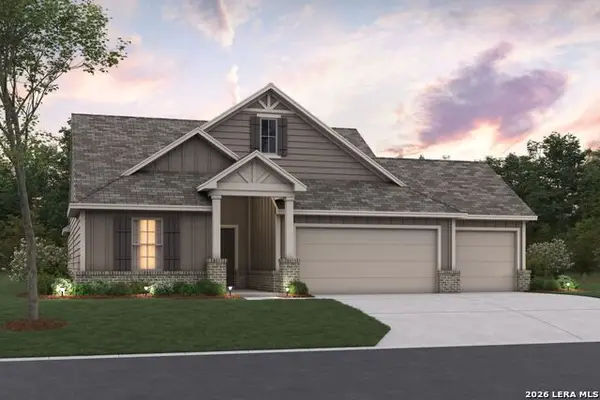 $419,990Active4 beds 3 baths2,188 sq. ft.
104 Greeley Drive, Floresville, TX 78114
MLS# 1951603Listed by: ESCAPE REALTY $585,000Active3 beds 3 baths1,716 sq. ft.
311 Governors, Floresville, TX 78114
MLS# 1951553Listed by: LPT REALTY, LLC $379,000Active3 beds 3 baths1,992 sq. ft.
25 Labus Ln, Floresville, TX 78114
MLS# 1951295Listed by: SOUTH TEXAS REALTY, LLC $699,000Pending5 beds 4 baths2,805 sq. ft.
140 Timber Heights, La Vernia, TX 78101
MLS# 1951099Listed by: VORTEX REALTY $750,000Active4 beds 4 baths3,438 sq. ft.
204 Fawn, Floresville, TX 78114
MLS# 1951010Listed by: KELLER WILLIAMS HERITAGE $480,000Active3 beds 2 baths1,854 sq. ft.
528 Jacobs, La Vernia, TX 78121
MLS# 1950994Listed by: RE/MAX FIRST SHOT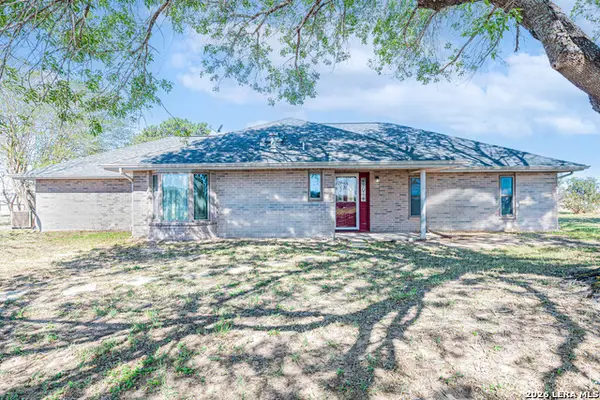 $525,000Active3 beds 2 baths1,749 sq. ft.
491 State Highway 97, Floresville, TX 78114
MLS# 1950899Listed by: HOMESTEAD & RANCH REAL ESTATE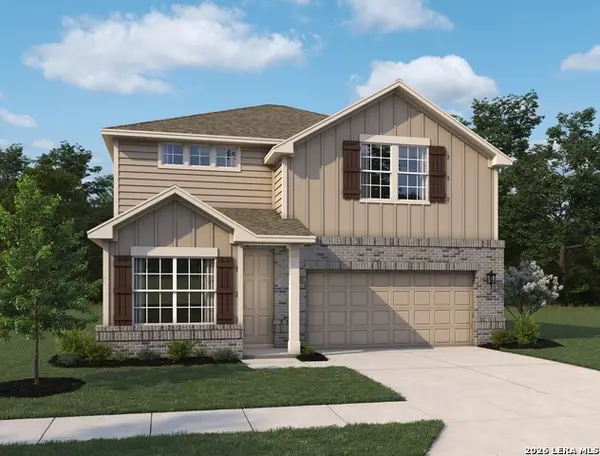 $354,990Active4 beds 3 baths2,206 sq. ft.
127 Peeps Ct., Adkins, TX 78101
MLS# 1950572Listed by: EXP REALTY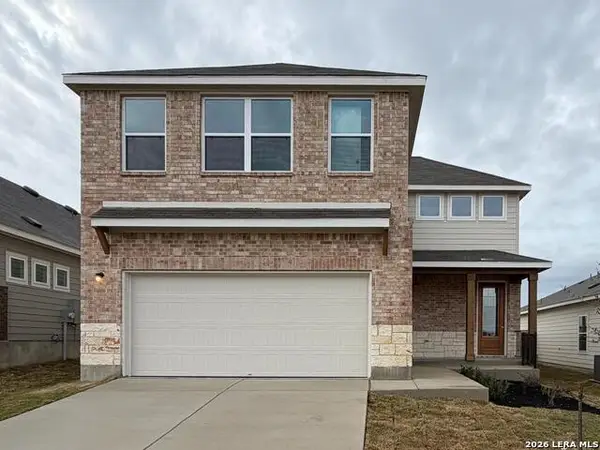 $394,990Pending5 beds 3 baths2,553 sq. ft.
135 Peeps Ct., Adkins, TX 78101
MLS# 1950535Listed by: EXP REALTY- Open Sun, 10am to 2pm
 $549,900Active4 beds 3 baths2,349 sq. ft.
380 Abrego Lake, Floresville, TX 78114
MLS# 1950512Listed by: BK REAL ESTATE  $713,000Active4 beds 4 baths2,862 sq. ft.
116 Timber Heights, La Vernia, TX 78121
MLS# 1950192Listed by: PHYLLIS BROWNING COMPANY $369,900Active4 beds 2 baths2,450 sq. ft.
513 State Highway 123, Stockdale, TX 78160
MLS# 1950053Listed by: CROSSPOINT REALTY, LLC $349,990Active4 beds 3 baths2,206 sq. ft.
115 Peeps Ct., Adkins, TX 78101
MLS# 1949914Listed by: EXP REALTY $639,900Active4 beds 4 baths2,770 sq. ft.
1007 Bluebonnet Lane (lot 195), Adkins, TX 78101
MLS# 1947127Listed by: FULMER REALTY, LLC $539,999Active3 beds 3 baths2,250 sq. ft.
112 W Magnolia, La Vernia, TX 78121
MLS# 1949676Listed by: HOMESTEAD & RANCH REAL ESTATE $699,000Active3 beds 3 baths3,165 sq. ft.
632 Lake Valley, La Vernia, TX 78121
MLS# 1949689Listed by: KELLER WILLIAMS HERITAGE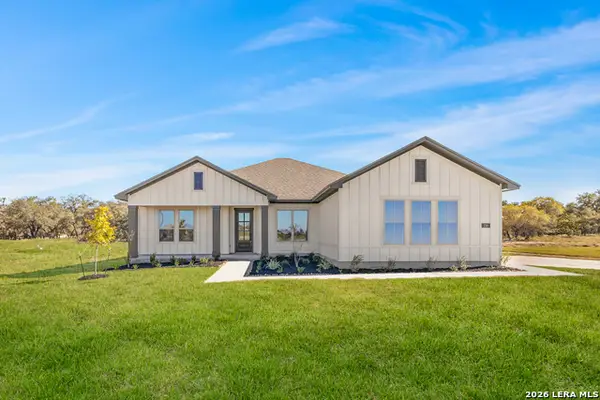 $569,107Active4 beds 3 baths2,569 sq. ft.
139 Pradera Ridge, Floresville, TX 78114
MLS# 1949690Listed by: KEN GEZELLA $670,000Active4 beds 3 baths2,591 sq. ft.
104 Hondo Ridge, La Vernia, TX 78121
MLS# 1949485Listed by: KELLER WILLIAMS HERITAGE $699,000Active3 beds 2 baths1,980 sq. ft.
828 Shady Grove, Adkins, TX 78101
MLS# 1949503Listed by: SOUTH ROOTS REALTY- Open Sat, 12 to 4pm
 $649,000Active4 beds 4 baths2,625 sq. ft.
113 Hondo Dr, La Vernia, TX 78121
MLS# 1949212Listed by: SOUTH ROOTS REALTY  $675,000Pending4 beds 3 baths2,659 sq. ft.
144 Hidden Forest, La Vernia, TX 78121
MLS# 1949136Listed by: RE/MAX SECURITY REAL ESTATE- Open Sat, 12 to 4pm
 $598,500Active4 beds 3 baths2,541 sq. ft.
157 Summer Meadow, La Vernia, TX 78121
MLS# 1948972Listed by: LPT REALTY, LLC  $890,000Pending6 beds 4 baths3,810 sq. ft.
124 Copper Creek, La Vernia, TX 78121
MLS# 1948894Listed by: HAYES HERITAGE REALTY, LLC $226,000Active4 beds 2 baths1,811 sq. ft.
135 Muirfield Ln, La Vernia, TX 78121
MLS# 1948769Listed by: BHHS DON JOHNSON REALTORS - NB $179,000Active1 beds 1 baths460 sq. ft.
2074 County Road 306, Floresville, TX 78114
MLS# 1948665Listed by: 1ST CHOICE REALTY GROUP $345,000Active3 beds 3 baths1,704 sq. ft.
802 Eagle Creek, Floresville, TX 78114
MLS# 1948586Listed by: EXP REALTY $699,500Active4 beds 4 baths2,840 sq. ft.
249 Cibolo Way, La Vernia, TX 78121
MLS# 606974Listed by: RED PEAR REALTY $899,000Active5 beds 3 baths3,800 sq. ft.
125 Hidden Hills, Floresville, TX 78114
MLS# 1948018Listed by: KELLER WILLIAMS HERITAGE $489,000Active3 beds 2 baths1,990 sq. ft.
124 Rosewood Dr, La Vernia, TX 78121
MLS# 1947327Listed by: FOSTER FAMILY REAL ESTATE $269,900Pending3 beds 2 baths1,545 sq. ft.
481 Middle Green Loop, Floresville, TX 78114
MLS# 1947281Listed by: KELLER WILLIAMS HERITAGE $550,000Active4 beds 3 baths1,847 sq. ft.
1026 Wild Flower, Floresville, TX 78114
MLS# 1947201Listed by: SOVY REALTY GROUP $255,000Active3 beds 2 baths1,656 sq. ft.
1501 Longhorn, Floresville, TX 78114
MLS# 1947206Listed by: SOVY REALTY GROUP $399,000Active3 beds 2 baths2,000 sq. ft.
133 Grand View, Floresville, TX 78114
MLS# 1947180Listed by: OPTION ONE REAL ESTATE $349,900Active4 beds 2 baths1,860 sq. ft.
213 Oak View, La Vernia, TX 78121
MLS# 1947007Listed by: TOP GUN REALTY, LLC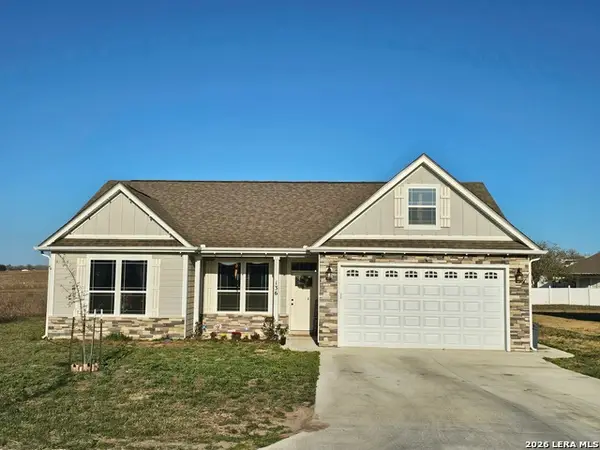 $290,000Active3 beds 2 baths1,572 sq. ft.
136 Turnberry, La Vernia, TX 78121
MLS# 1946784Listed by: RESI REALTY, LLC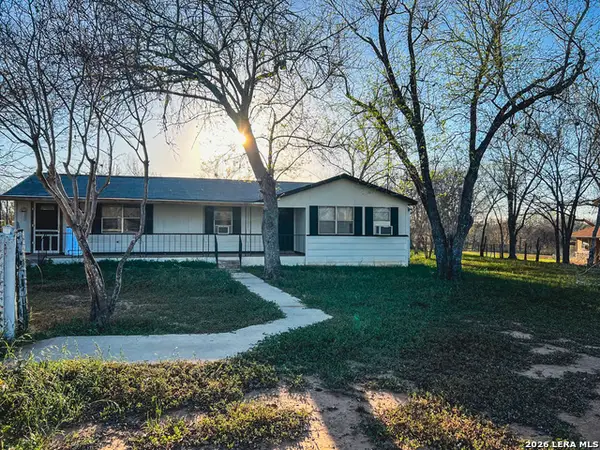 $250,000Active3 beds 2 baths1,503 sq. ft.
1207 El Paso, Stockdale, TX 78160
MLS# 1946642Listed by: THE REAL ESTATE MARKETPLACE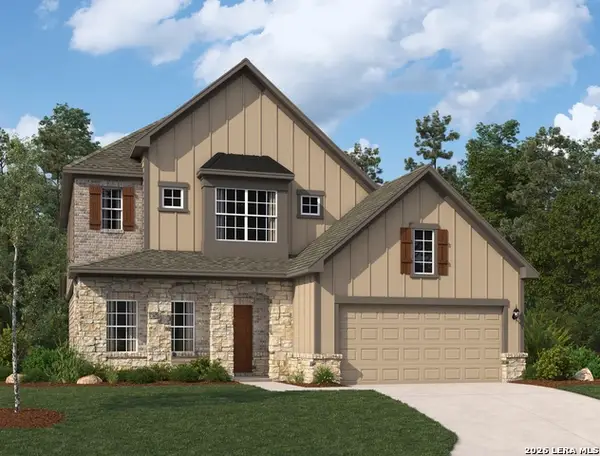 $428,990Pending4 beds 4 baths2,522 sq. ft.
311 Brood Dr, Adkins, TX 78101
MLS# 1946467Listed by: EXP REALTY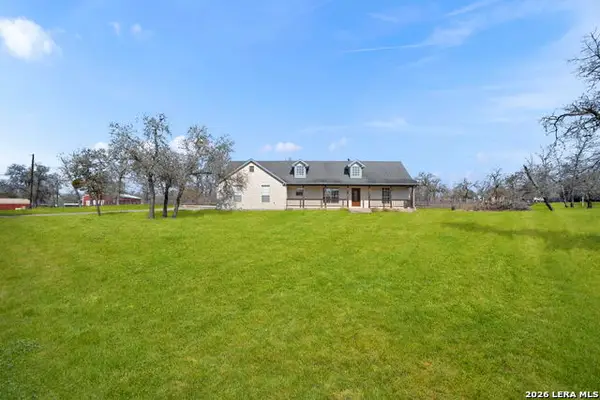 $500,000Pending4 beds 2 baths1,978 sq. ft.
11560 Fm 775, Floresville, TX 78114
MLS# 1946421Listed by: COLDWELL BANKER D'ANN HARPER, REALTOR $455,000Active3 beds 2 baths1,601 sq. ft.
2127 Bentwood, Floresville, TX 78114
MLS# 1946200Listed by: LEGACY BROKER GROUP $279,000Pending3 beds 2 baths1,653 sq. ft.
772 Crestview, Floresville, TX 78114
MLS# 1946181Listed by: JPAR SAN ANTONIO $335,000Active3 beds 2 baths1,820 sq. ft.
1275 Morning Glory, Adkins, TX 78101
MLS# 1946020Listed by: TALLGRASS REAL ESTATE, LLC $549,500Active4 beds 3 baths2,392 sq. ft.
1474 Cr 342, La Vernia, TX 78121
MLS# 606035Listed by: TKO LISTINGS, LLC- Open Sat, 10am to 6pm
 $419,990Active4 beds 3 baths2,188 sq. ft.
120 Greeley Drive, Floresville, TX 78114
MLS# 1945773Listed by: ESCAPE REALTY  $280,000Active3 beds 2 baths1,242 sq. ft.
316 N Welhausen, Poth, TX 78147
MLS# 1945668Listed by: LUXURY HOME & LAND SALES, LLC $635,000Active4 beds 2 baths2,187 sq. ft.
220 Cibolo Ridge, La Vernia, TX 78121
MLS# 1945588Listed by: TEXAS EDGE REALTY $140,000Active3 beds 2 baths1,413 sq. ft.
86 Fm 478, Floresville, TX 78114
MLS# 1945386Listed by: RE/MAX SOUTHERN ESTATE REALTY $730,000Active4 beds 4 baths3,003 sq. ft.
603 Sunshine Meadow, Adkins, TX 78101
MLS# 1945082Listed by: TRIPOINT REALTY LLC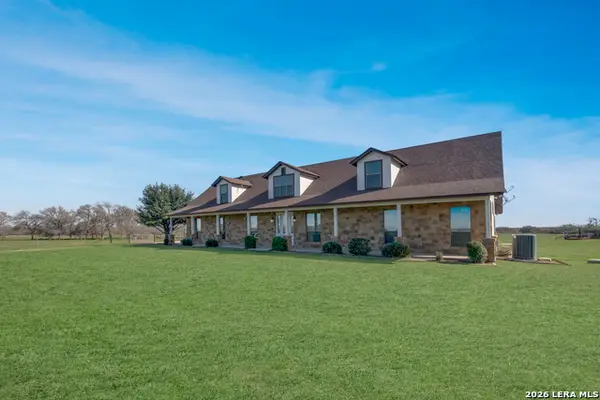 $1,599,000Active4 beds 4 baths3,183 sq. ft.
3255 Fm 539, La Vernia, TX 78121
MLS# 1945079Listed by: HAYES HERITAGE REALTY, LLC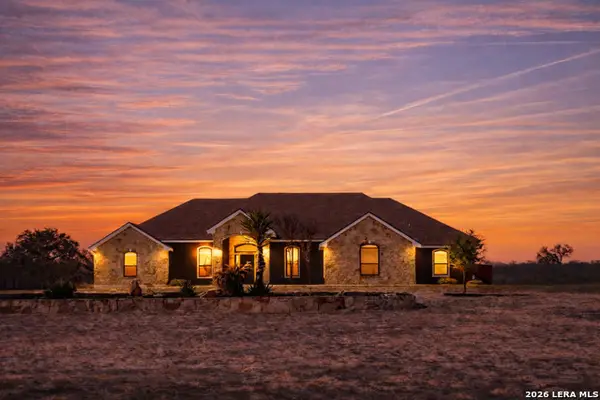 $775,000Active4 beds 3 baths2,753 sq. ft.
201 Abrego Lake, Floresville, TX 78114
MLS# 1944942Listed by: RE/MAX SOUTHERN ESTATE REALTY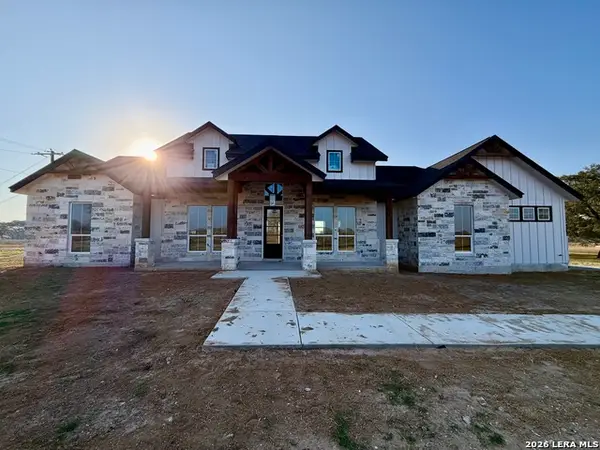 $575,900Active4 beds 3 baths2,354 sq. ft.
712 County Road 320, Floresville, TX 78114
MLS# 1944859Listed by: 3D REALTY & PROPERTY MANAGEMENT $509,985Active3 beds 3 baths2,226 sq. ft.
105 Oakmont Ln, La Vernia, TX 78121
MLS# 1944812Listed by: VORTEX REALTY $184,900Active2 beds 1 baths1,000 sq. ft.
149 Carroll, Poth, TX 78147
MLS# 1944590Listed by: RE/MAX SOUTHERN ESTATE REALTY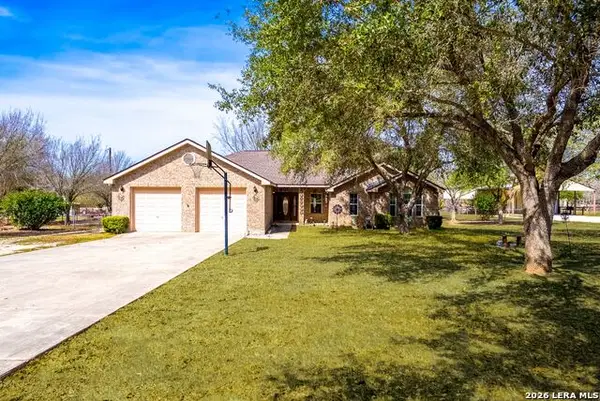 $489,900Active4 beds 2 baths2,039 sq. ft.
248 Hunters Dawn Dr, La Vernia, TX 78121
MLS# 1944599Listed by: EXP REALTY $599,000Active5 beds 3 baths3,249 sq. ft.
622 N Dickson, Poth, TX 78147
MLS# 1944531Listed by: EXP REALTY $900,000Active4 beds 3 baths2,211 sq. ft.
203 Champions Blvd, La Vernia, TX 78121
MLS# 8203170Listed by: LEGACY BROKER GROUP $599,990Active4 beds 4 baths2,773 sq. ft.
109 Colibro Creek, La Vernia, TX 78121
MLS# 1944448Listed by: EXP REALTY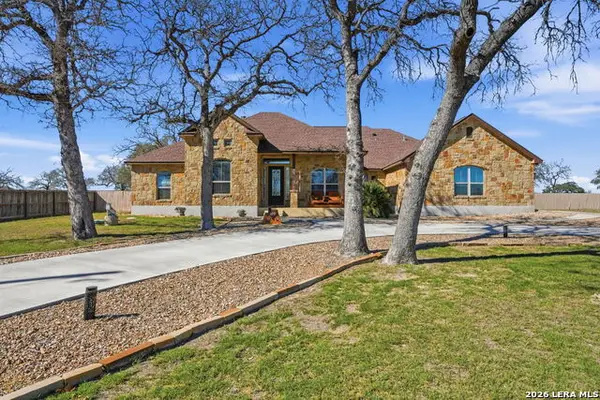 $714,999Active4 beds 3 baths2,797 sq. ft.
109 Bucks Ln, La Vernia, TX 78121
MLS# 1938290Listed by: HOUSE BUYERS DIRECT $679,900Active4 beds 3 baths2,533 sq. ft.
105 Bobby Lynn, Adkins, TX 78101
MLS# 1944237Listed by: REAL BROKER, LLC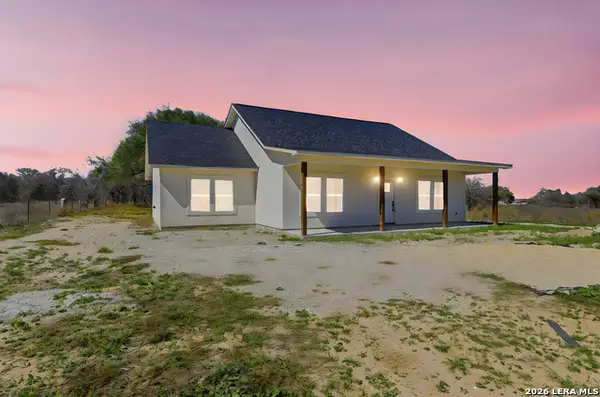 $399,000Active3 beds 2 baths1,809 sq. ft.
374 County Road 124, Floresville, TX 78114
MLS# 1943647Listed by: CAVAZOS REALTY GROUP LLC $212,000Active3 beds 1 baths1,458 sq. ft.
7924 County Road 128, Floresville, TX 78114
MLS# 1943587Listed by: PORCH SWING PROPERTIES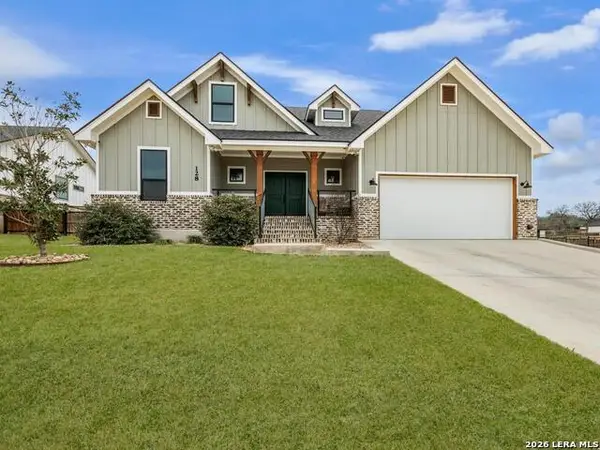 $565,000Pending3 beds 2 baths2,334 sq. ft.
128 Juniper Point, La Vernia, TX 78121
MLS# 1943531Listed by: KUPER SOTHEBY'S INT'L REALTY $468,999Active3 beds 4 baths2,560 sq. ft.
577 County Road 422 Rd, Stockdale, TX 78160
MLS# 2259800Listed by: TXHOME REALTY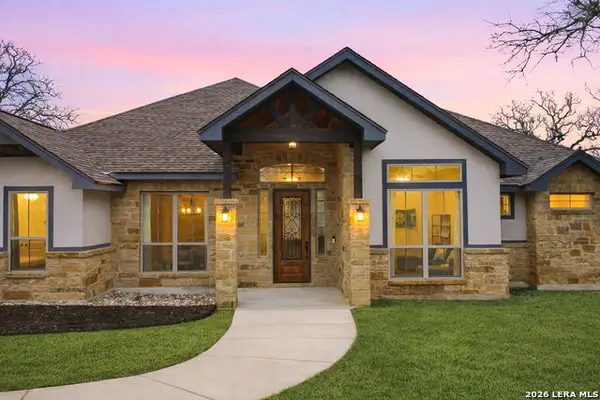 $699,000Active4 beds 3 baths2,875 sq. ft.
117 Crescent Rdg, Adkins, TX 78101
MLS# 1943324Listed by: EXP REALTY $509,000Active4 beds 3 baths1,941 sq. ft.
314 Honeysuckle Ln, La Vernia, TX 78121
MLS# 1943212Listed by: KELLER WILLIAMS HERITAGE $519,000Active4 beds 3 baths1,941 sq. ft.
201 Sendera Crossing, La Vernia, TX 78121
MLS# 1943214Listed by: KELLER WILLIAMS HERITAGE $739,900Pending4 beds 4 baths2,846 sq. ft.
176 Hondo Ridge, La Vernia, TX 78121
MLS# 1943191Listed by: FULMER REALTY, LLC $575,000Active4 beds 3 baths2,251 sq. ft.
200 Lakeview Cir, La Vernia, TX 78121
MLS# 1943184Listed by: OPTION ONE REAL ESTATE $385,000Active3 beds 3 baths2,300 sq. ft.
618 Cr 124, Floresville, TX 78114
MLS# 1943116Listed by: REAL BROKER, LLC $284,900Active5 beds 3 baths2,128 sq. ft.
934 7th, Floresville, TX 78114
MLS# 1942984Listed by: LEVI RODGERS REAL ESTATE GROUP $615,000Pending4 beds 4 baths2,650 sq. ft.
179 Hidden Ranch Ct., Floresville, TX 78114
MLS# 1929830Listed by: KELLER WILLIAMS HERITAGE $650,000Active3 beds 3 baths2,329 sq. ft.
187 Champions, La Vernia, TX 78121
MLS# 1942892Listed by: KELLER WILLIAMS HERITAGE $599,999Active4 beds 4 baths2,550 sq. ft.
999 County Road 319, La Vernia, TX 78121
MLS# 1942817Listed by: VORTEX REALTY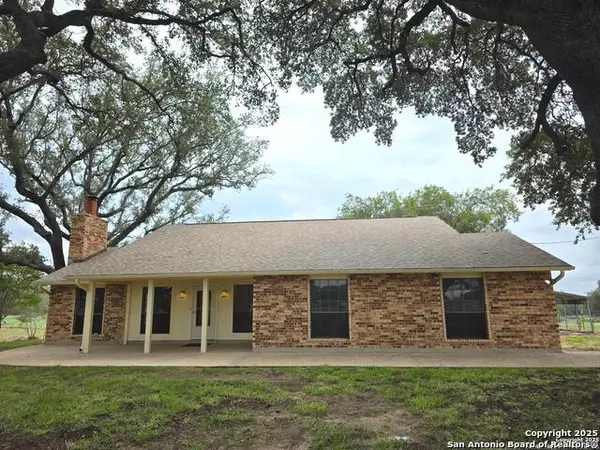 $429,000Active3 beds 2 baths1,679 sq. ft.
340 Joy Dr., San Antonio, TX 78223
MLS# 1942828Listed by: TEXAS SKY REALTY, LLC- Open Sat, 12 to 4pm
 $665,000Active4 beds 3 baths2,309 sq. ft.
113 Hondo Vista, La Vernia, TX 78121
MLS# 1942583Listed by: BETTER HOMES AND GARDENS WINANS  $259,990Pending3 beds 2 baths1,200 sq. ft.
1030 Sharpie Lane, Adkins, TX 78101
MLS# 1942459Listed by: CA & COMPANY, REALTORS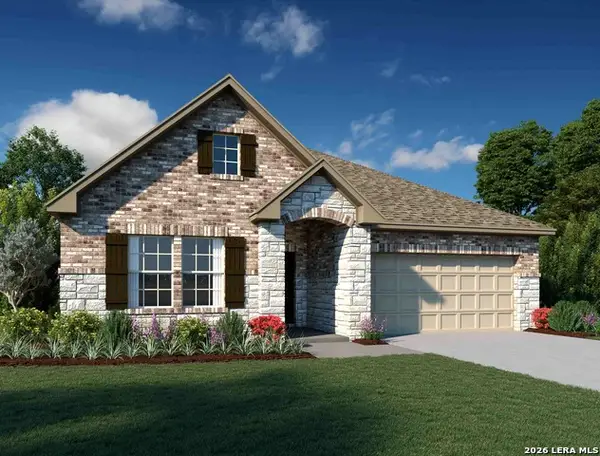 $384,990Active4 beds 3 baths1,916 sq. ft.
314 Brood Dr, Adkins, TX 78101
MLS# 1942326Listed by: EXP REALTY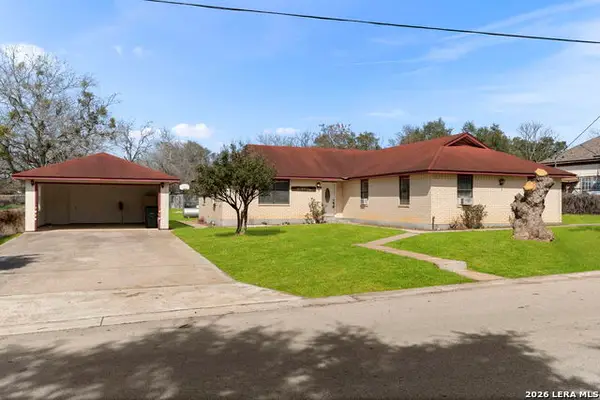 $284,900Active4 beds 2 baths1,855 sq. ft.
105 East St, Stockdale, TX 78160
MLS# 1942318Listed by: COLDWELL BANKER D'ANN HARPER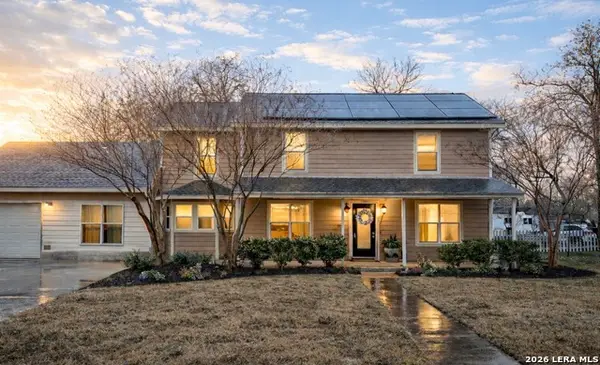 $390,000Active4 beds 2 baths1,898 sq. ft.
306 Flores Oaks, Floresville, TX 78114
MLS# 1941859Listed by: RE/MAX SOUTHERN ESTATE REALTY $220,000Active3 beds 2 baths1,603 sq. ft.
1521 B Street, Floresville, TX 78114
MLS# 1941829Listed by: REAL BROKER, LLC $299,000Active4 beds 3 baths2,453 sq. ft.
603 N Rachel St, Falls City, TX 78113
MLS# 1941506Listed by: TKO LISTINGS, LLC $620,000Active4 beds 3 baths2,757 sq. ft.
LOT 238 Crescent Ridge, Adkins, TX 78101
MLS# 1941324Listed by: FULMER REALTY, LLC $736,734Pending4 beds 4 baths2,846 sq. ft.
LOT 20 Hondo Ridge, La Vernia, TX 78121
MLS# 1917240Listed by: FULMER REALTY, LLC $219,999Pending1 beds 1 baths704 sq. ft.
1641 County Road 223, Floresville, TX 78114
MLS# 1940540Listed by: VORTEX REALTY $535,000Active4 beds 3 baths2,355 sq. ft.
108 Abrego Ridge, Floresville, TX 78114
MLS# 1940397Listed by: KELLER WILLIAMS HERITAGE $265,000Active3 beds 2 baths1,144 sq. ft.
904 W. West Street, Stockdale, TX 78160
MLS# 1940250Listed by: THE REALTY PLACE $749,900Active3 beds 2 baths2,026 sq. ft.
5476 County Road 427, Stockdale, TX 78160
MLS# 1940254Listed by: KELLER WILLIAMS HERITAGE $420,000Active4 beds 3 baths2,710 sq. ft.
201 Cimarron, Floresville, TX 78114
MLS# 1939947Listed by: 1ST CHOICE REALTY GROUP $315,000Active4 beds 3 baths2,465 sq. ft.
177 Middle Green Loop, Floresville, TX 78114
MLS# 1939831Listed by: RE/MAX SOUTHERN ESTATE REALTY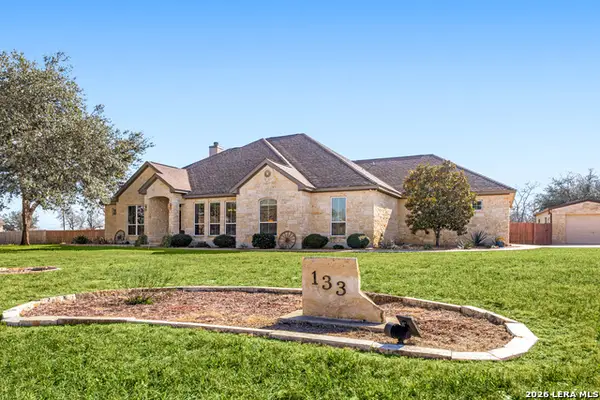 $774,998Active3 beds 4 baths3,149 sq. ft.
133 Vintage Ranch Cir, La Vernia, TX 78121
MLS# 1934496Listed by: REDFIN CORPORATION $799,000Active4 beds 3 baths3,675 sq. ft.
204 Oak Fields Dr.,, Floresville, TX 78114
MLS# 1939285Listed by: COLDWELL BANKER D'ANN HARPER $699,000Active3 beds 3 baths2,470 sq. ft.
200 Oak Fields Dr.,, Floresville, TX 78114
MLS# 1939289Listed by: COLDWELL BANKER D'ANN HARPER $465,000Active3 beds 2 baths2,846 sq. ft.
307 Se Main Street, Stockdale, TX 78160
MLS# 603656Listed by: C AKIN 4 REALTY LLC $640,000Active4 beds 3 baths2,548 sq. ft.
100 Hondo Ridge, La Vernia, TX 78121
MLS# 1938961Listed by: TKO LISTINGS, LLC $337,900Pending3 beds 2 baths1,594 sq. ft.
203 Turnberry Drive, La Vernia, TX 78121
MLS# 603494Listed by: SEPPALA REAL ESTATE GROUP $398,000Active4 beds 3 baths2,258 sq. ft.
104 Fairway, Floresville, TX 78114
MLS# 1938461Listed by: LUXURY HOME & LAND SALES, LLC $395,000Active4 beds 2 baths2,062 sq. ft.
501 Green St., Poth, TX 78147
MLS# 1938425Listed by: SOUTH TEXAS REALTY, LLC $700,000Active4 beds 3 baths2,622 sq. ft.
311 Abrego Lake, Floresville, TX 78114
MLS# 1938378Listed by: UNITED COUNTRY REAL ESTATE TEXAS RANCH AND HOME $749,999Active4 beds 3 baths2,755 sq. ft.
196 Bobby Lynn, Adkins, TX 78101
MLS# 1938361Listed by: COLDWELL BANKER D'ANN HARPER, REALTOR $469,999Active4 beds 5 baths3,036 sq. ft.
184 Fairway, Floresville, TX 78114
MLS# 1937955Listed by: LUXURY HOME & LAND SALES, LLC $439,990Pending4 beds 2 baths2,188 sq. ft.
132 Greeley Drive, Floresville, TX 78114
MLS# 1937756Listed by: ESCAPE REALTY $367,990Pending4 beds 3 baths2,308 sq. ft.
111 Peeps Ct., Adkins, TX 78101
MLS# 1937515Listed by: EXP REALTY $674,900Active3 beds 4 baths2,752 sq. ft.
197 Vintage Ranch, La Vernia, TX 78121
MLS# 1937082Listed by: KELLER WILLIAMS LEGACY $899,000Active4 beds 3 baths3,471 sq. ft.
322 Dublin, Floresville, TX 78114
MLS# 1936725Listed by: TEXAS RANCH KINGS REALTY, LLC $399,990Pending3 beds 2 baths1,926 sq. ft.
500 Wagon Train, La Vernia, TX 78121
MLS# 1936444Listed by: EXP REALTY $749,900Active4 beds 4 baths2,771 sq. ft.
148 Copper Ridge, La Vernia, TX 78121
MLS# 1936236Listed by: FULMER REALTY, LLC $435,028Active3 beds 3 baths1,953 sq. ft.
604 Elm Street, Floresville, TX 78114
MLS# 1935980Listed by: HABY REALTY $620,000Pending4 beds 3 baths2,900 sq. ft.
191 Hidden Ranch, Floresville, TX 78114
MLS# 1935878Listed by: KELLER WILLIAMS HERITAGE $699,000Active4 beds 3 baths3,375 sq. ft.
280 County Road 322, La Vernia, TX 78121
MLS# 1935660Listed by: REAL BROKER, LLC $785,000Active4 beds 4 baths2,675 sq. ft.
153 Chisum, La Vernia, TX 78121
MLS# 1935545Listed by: RELIANCE RESIDENTIAL REALTY - $548,000Active4 beds 3 baths2,173 sq. ft.
120 Summer Meadow Dr, La Vernia, TX 78121
MLS# 1935588Listed by: CAMINO REAL MANAGEMENT, LLC $719,000Active4 beds 4 baths2,766 sq. ft.
161 Hondo Ridge, La Vernia, TX 78121
MLS# 1935486Listed by: REAL BROKER, LLC $530,000Pending3 beds 3 baths2,072 sq. ft.
422 Arbor Vw, Adkins, TX 78101
MLS# 1935496Listed by: SELMA D. MARTINEZ REALTY LLC $180,000Active3 beds 2 baths1,244 sq. ft.
124 Wood Moss, Floresville, TX 78114
MLS# 1935289Listed by: LPT REALTY, LLC $499,000Active3 beds 2 baths2,404 sq. ft.
788 County Road 140, Floresville, TX 78114
MLS# 1935023Listed by: BROHILL REALTY LTD $462,500Active4 beds 3 baths2,353 sq. ft.
105 Hidden Cove, Floresville, TX 78114
MLS# 1934920Listed by: KELLER WILLIAMS HERITAGE $459,900Active3 beds 2 baths1,946 sq. ft.
192 Great Oaks Blvd, La Vernia, TX 78121
MLS# 1934876Listed by: KELLER WILLIAMS HERITAGE $274,500Active5 beds 3 baths3,075 sq. ft.
133 Middle Green, Floresville, TX 78114
MLS# 1934813Listed by: SHARON PETERS $605,000Active4 beds 3 baths2,957 sq. ft.
108 Medora Branch, Floresville, TX 78114
MLS# 1934608Listed by: SOUTH TEXAS REALTY, LLC $550,000Pending3 beds 3 baths2,487 sq. ft.
3036 State Highway 97w, Floresville, TX 78114
MLS# 1933795Listed by: EAGLE FORD REAL ESTATE $775,000Active4 beds 5 baths3,671 sq. ft.
113 Abrego Mount, Floresville, TX 78114
MLS# 1933485Listed by: RE/MAX SOUTHERN ESTATE REALTY $289,500Active3 beds 2 baths1,360 sq. ft.
140 Camino Verde, La Vernia, TX 78121
MLS# 1933352Listed by: ALL CITY SAN ANTONIO REGISTERED SERIES $639,900Active4 beds 3 baths2,506 sq. ft.
113 Ava Ridge, La Vernia, TX 78121
MLS# 1933029Listed by: REAL BROKER, LLC $319,990Active3 beds 2 baths1,736 sq. ft.
119 Peeps Ct., Adkins, TX 78101
MLS# 1932654Listed by: EXP REALTY $519,900Pending4 beds 3 baths2,278 sq. ft.
525 Enchanted Oak Dr, La Vernia, TX 78121
MLS# 1932644Listed by: EXP REALTY $472,000Active4 beds 3 baths2,088 sq. ft.
105 Hidden Haven, Floresville, TX 78114
MLS# 1932593Listed by: MOSSY OAK PROPERTIES- CROSS TI $529,000Active4 beds 2 baths2,278 sq. ft.
438 Rosewood Dr, La Vernia, TX 78121
MLS# 1932498Listed by: TEXCEN REALTY $439,900Active4 beds 3 baths2,354 sq. ft.
119 Post Oak Rd, La Vernia, TX 78121
MLS# 1932406Listed by: EXP REALTY $749,000Active4 beds 5 baths3,414 sq. ft.
140 Legacy Trail Dr, La Vernia, TX 78121
MLS# 1932264Listed by: KUPER SOTHEBY'S INT'L REALTY $599,999Active4 beds 2 baths2,506 sq. ft.
461 Fm 3432, La Vernia, TX 78121
MLS# 1931505Listed by: HOMESTEAD & RANCH REAL ESTATE $940,000Active4 beds 4 baths3,439 sq. ft.
1530 County Road 132, Floresville, TX 78114
MLS# 1935285Listed by: KUPER SOTHEBY'S INT'L REALTY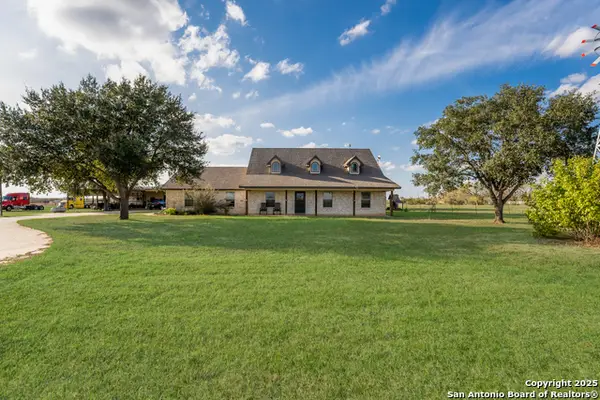 $785,000Active4 beds 3 baths2,389 sq. ft.
800 County Road 125, Elmendorf, TX 78112
MLS# 1930825Listed by: LEVI RODGERS REAL ESTATE GROUP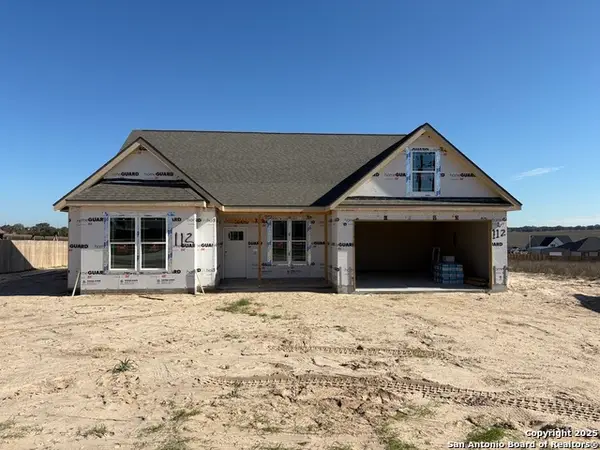 $391,900Pending3 beds 3 baths2,116 sq. ft.
112 Oakmont Lane, La Vernia, TX 78121
MLS# 1930665Listed by: SEPPALA REAL ESTATE GROUP $795,000Active4 beds 5 baths3,892 sq. ft.
108 Abrego Trail, Floresville, TX 78114
MLS# 1929427Listed by: ENGEL & VOLKERS SAN ANTONIO- Open Fri, 1 to 3pm
 $249,000Active3 beds 3 baths1,973 sq. ft.
1508 E St, Floresville, TX 78114
MLS# 1928693Listed by: KELLER WILLIAMS HERITAGE  $319,900Active3 beds 2 baths1,632 sq. ft.
164 Turnberry, La Vernia, TX 78121
MLS# 1927800Listed by: LEGACY BROKER GROUP $679,999Active4 beds 3 baths3,063 sq. ft.
226 Broken Arrow, Floresville, TX 78114
MLS# 1947775Listed by: CENTURY 21 SCOTT MYERS, REALTORS $499,000Active5 beds 4 baths3,019 sq. ft.
128 Hidden Ranch Ct., Floresville, TX 78114
MLS# 1927063Listed by: BHHS PENFED REALTY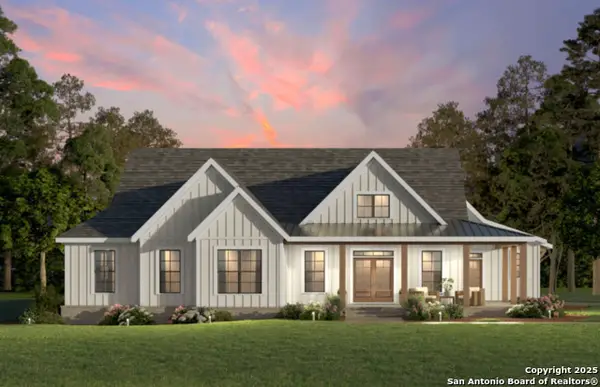 $399,000Active3 beds 2 baths
LOT I 497 County Rd 124, Floresville, TX 78112
MLS# 1927025Listed by: HOME TEAM OF AMERICA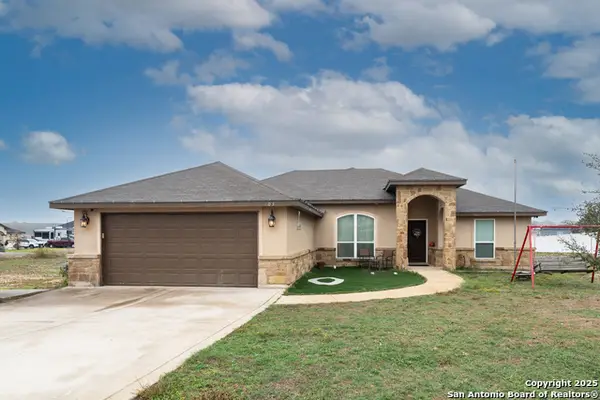 $314,999Active3 beds 2 baths1,671 sq. ft.
103 Muirfield, La Vernia, TX 78121
MLS# 1926840Listed by: KELLER WILLIAMS HERITAGE $689,900Active4 beds 3 baths2,604 sq. ft.
864 Paddy Rd, Floresville, TX 78114
MLS# 1926707Listed by: KELLER WILLIAMS HERITAGE $549,000Active4 beds 3 baths2,265 sq. ft.
109 Medora Branch, Floresville, TX 78114
MLS# 1781249Listed by: BROWN REALTY $610,000Pending4 beds 3 baths2,058 sq. ft.
112 Archer Ridge Dr, La Vernia, TX 78121
MLS# 1926342Listed by: EXP REALTY $250,000Active3 beds 2 baths1,387 sq. ft.
760 Crestview, Floresville, TX 78114
MLS# 1925726Listed by: COLDWELL BANKER D'ANN HARPER $1,150,000Active4 beds 5 baths4,200 sq. ft.
6653 Fm 539, Floresville, TX 78114
MLS# 1925692Listed by: FOSTER FAMILY REAL ESTATE $550,000Active3 beds 2 baths1,456 sq. ft.
142 Chaparral, Floresville, TX 78114
MLS# 1925374Listed by: UNITED REALTY GROUP OF TEXAS, LLC $622,999Active3 beds 3 baths2,388 sq. ft.
147 Las Palomas, La Vernia, TX 78121
MLS# 1925330Listed by: VORTEX REALTY $179,000Active4 beds 2 baths1,366 sq. ft.
1415 Longhorn, Floresville, TX 78114
MLS# 1925218Listed by: LEVI RODGERS REAL ESTATE GROUP $394,990Pending4 beds 3 baths2,130 sq. ft.
113 Greeley Drive, Floresville, TX 78114
MLS# 1924837Listed by: ESCAPE REALTY $419,990Pending4 beds 2 baths2,188 sq. ft.
109 Cheyenne Drive, Floresville, TX 78114
MLS# 1924840Listed by: ESCAPE REALTY $599,999Active4 beds 4 baths2,622 sq. ft.
171 Pradera Ridge Drive, Floresville, TX 78114
MLS# 1924703Listed by: PATRICK THOMPSON, BROKER $799,900Pending4 beds 4 baths3,048 sq. ft.
145 Bucks, La Vernia, TX 78121
MLS# 1924053Listed by: TEXAS EDGE REALTY $495,000Pending4 beds 3 baths2,698 sq. ft.
732 Lake Valley, La Vernia, TX 78121
MLS# 1923090Listed by: REAL BROKER, LLC $349,900Active3 beds 2 baths1,620 sq. ft.
171 Big Oak Drive, Adkins, TX 78101
MLS# 1922821Listed by: FULMER REALTY, LLC
Local realty services provided by:CENTURY 21 North East, CENTURY 21 Scott Myers Realtors, CENTURY 21 Lucky Money Real Estate, CENTURY 21 Judge Fite Company
Some properties that appear for sale on this web site may subsequently have been sold and may no longer be available. The data relating to real estate for sale on this web site comes in part from the FHAAR IDX INFO SHARE PROGRAM. Real estate listings held by brokerage firms other than CENTURY 21 Scott Myers Realtors include the name of the listing agent. Copyright 2026 FHAAR IDX INFO SHARE PROGRAM. Last Updated May 7, 2026
Copyright 2026, Houston Realtors Information Service, Inc. All information provided is deemed reliable but is not guaranteed and should be independently verified. IDX information is provided exclusively for consumers' personal, non-commercial use, it may not be used for any purpose other than to identify prospective properties consumers may be interested in purchasing, and the data is deemed reliable but is not guaranteed accurate by the MLS.
Popular searches near Wilson County, TX
Popular neighborhoods near Wilson County, TX
- China Grove, San Antonio homes for sale
- Elmendorf, Elmendorf homes for sale
- Foster Meadows, San Antonio homes for sale
- Highland Forest, San Antonio homes for sale
- Highland Hills, San Antonio homes for sale
- Huntleigh Park, San Antonio homes for sale
- Jupe Manor, San Antonio homes for sale
- Knox Ridge, Converse homes for sale
- Lakeside, San Antonio homes for sale
- Las Palomas Country Club, Stockdale homes for sale
- Lower Southeast Side, San Antonio homes for sale
- Mission Del Lago, San Antonio homes for sale
- Pecan Valley, San Antonio homes for sale
- Republic Oaks, San Antonio homes for sale
- Rosillo Ranch, San Antonio homes for sale
- St. Hedwig, Saint Hedwig homes for sale
- Sandy Oaks, Sandy Oaks homes for sale
- Stoneleigh / Dellcrest, San Antonio homes for sale
- Villa Coronado, San Antonio homes for sale
- Woodbridge At Monte Viejo, San Antonio homes for sale
Zip codes near Wilson County, TX
- 78101 homes for sale
- 78109 homes for sale
- 78112 homes for sale
- 78113 homes for sale
- 78114 homes for sale
- 78116 homes for sale
- 78117 homes for sale
- 78118 homes for sale
- 78121 homes for sale
- 78140 homes for sale
- 78147 homes for sale
- 78152 homes for sale
- 78160 homes for sale
- 78161 homes for sale
- 78221 homes for sale
- 78222 homes for sale
- 78223 homes for sale
- 78235 homes for sale
- 78263 homes for sale
- 78264 homes for sale
Protect your home and budget from life's surprises with an Assurant Home Warranty, backed by a partner that supports you through every step of homeownership. Explore Plans.
©2026 Century 21 Real Estate LLC. All rights reserved. CENTURY 21®, the CENTURY 21 Logo and C21® are service marks owned by Century 21 Real Estate LLC. Century 21 Real Estate LLC fully supports the principles of the Fair Housing Act and the Equal Opportunity Act. Each office is independently owned and operated. Listing information is deemed reliable but not guaranteed accurate.