- Ardmore, Ardmore homes for sale
- Bala Cynwyd, Bala Cynwyd homes for sale
- Bryn Mawr, Bryn Mawr homes for sale
- Carroll Park, Philadelphia homes for sale
- Cathedral Park, Philadelphia homes for sale
- Dearnley Park, Philadelphia homes for sale
- Gladwyne, Gladwyne homes for sale
- Haddington, Philadelphia homes for sale
- Haverford, Haverford homes for sale
- Manayunk, Philadelphia homes for sale
- Merion Station, Merion Station homes for sale
- Narberth, Narberth homes for sale
- Overbrook, Philadelphia homes for sale
- Parkside, Philadelphia homes for sale
- Penn Wynne, Wynnewood homes for sale
- West Fairmount Park, Philadelphia homes for sale
- West Philadelphia, Philadelphia homes for sale
- Wynnefield, Philadelphia homes for sale
- Wynnefield Heights, Philadelphia homes for sale
- Wynnewood, Wynnewood homes for sale
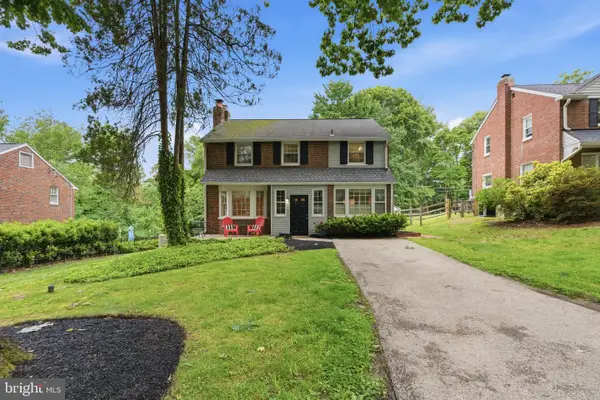
Wynnewood, PA - homes for sale
49 of 49 results displayed
- Open Wed, 3 to 4pmNew
 $1,450,000Active5 beds 4 baths4,838 sq. ft.
543 Foxglove Ln, WYNNEWOOD, PA 19096
MLS# PAMC2182828Listed by: BHHS FOX & ROACH-HAVERFORD - Coming Soon
 $439,000Coming Soon3 beds 2 baths
232 Henley Rd, WYNNEWOOD, PA 19096
MLS# PAMC2182664Listed by: COMPASS PENNSYLVANIA, LLC - Open Fri, 4 to 6pmNew
 $699,000Active3 beds 4 baths1,740 sq. ft.
102 Rock Glen Rd, WYNNEWOOD, PA 19096
MLS# PAMC2180198Listed by: COMPASS PENNSYLVANIA, LLC 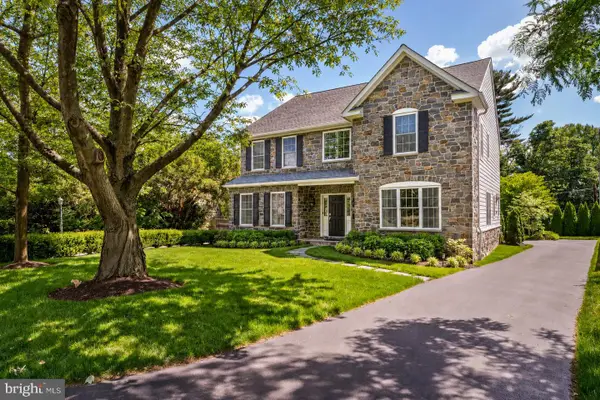 $1,725,000Pending5 beds 5 baths5,127 sq. ft.
1024 Cedar Grove Rd, WYNNEWOOD, PA 19096
MLS# PAMC2182236Listed by: COMPASS PENNSYLVANIA, LLC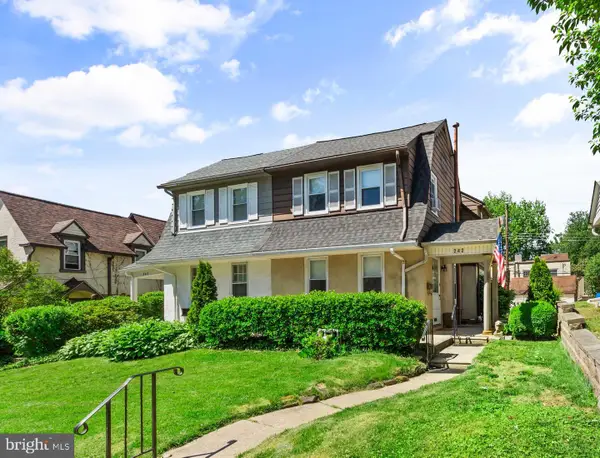 $365,000Pending3 beds 1 baths1,411 sq. ft.
242 Henley Rd, WYNNEWOOD, PA 19096
MLS# PAMC2182328Listed by: KELLER WILLIAMS MAIN LINE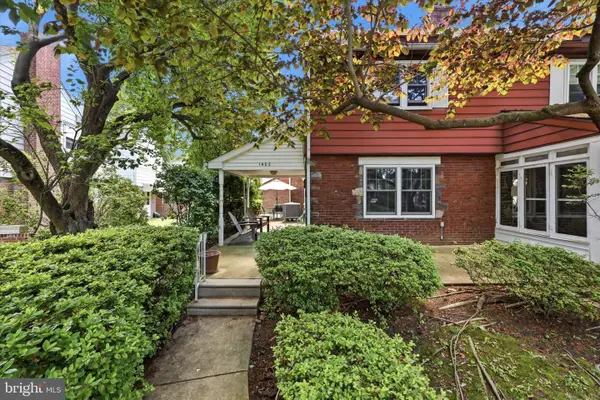 $439,900Pending3 beds 2 baths2,030 sq. ft.
1406 Westwood Ln, WYNNEWOOD, PA 19096
MLS# PAMC2182280Listed by: LONG & FOSTER REAL ESTATE, INC.- New
 $1,550,000Active4 beds 6 baths5,339 sq. ft.
228 Indian Creek Rd, WYNNEWOOD, PA 19096
MLS# PAMC2182304Listed by: MAXWELL REALTY COMPANY  $1,075,000Pending4 beds 3 baths3,251 sq. ft.
649 Sussex Rd, WYNNEWOOD, PA 19096
MLS# PAMC2181818Listed by: BHHS FOX & ROACH THE HARPER AT RITTENHOUSE SQUARE $1,250,000Pending5 beds 3 baths3,394 sq. ft.
407 Shortridge Dr, WYNNEWOOD, PA 19096
MLS# PAMC2180612Listed by: COMPASS PENNSYLVANIA, LLC $1,350,000Pending3 beds 5 baths5,477 sq. ft.
451 Mill Creek Rd, GLADWYNE, PA 19035
MLS# PAMC2180738Listed by: COMPASS PENNSYLVANIA, LLC $815,000Pending4 beds 3 baths3,065 sq. ft.
284 Trent Rd, WYNNEWOOD, PA 19096
MLS# PAMC2181448Listed by: COMPASS PENNSYLVANIA, LLC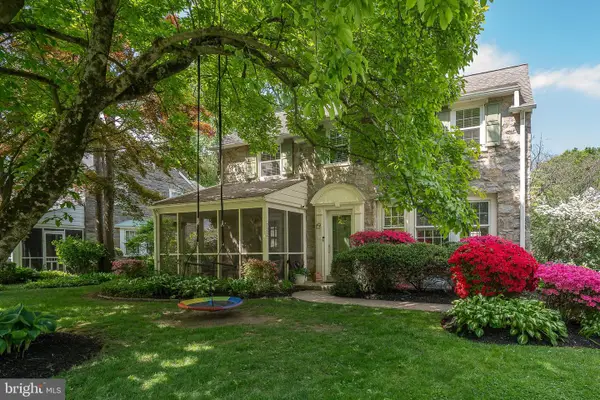 $995,000Pending4 beds 4 baths2,916 sq. ft.
722 Argyle Rd, WYNNEWOOD, PA 19096
MLS# PAMC2178322Listed by: BHHS FOX & ROACH-HAVERFORD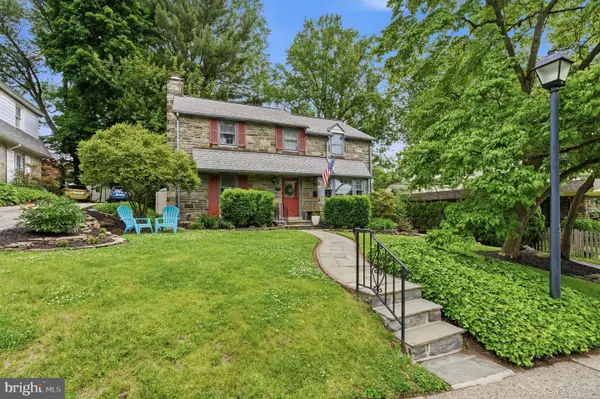 $895,000Pending4 beds 4 baths2,386 sq. ft.
103 Harrogate Rd, WYNNEWOOD, PA 19096
MLS# PAMC2180796Listed by: KELLER WILLIAMS MAIN LINE- Open Sat, 3 to 4:30pm
 $735,000Active3 beds 2 baths2,470 sq. ft.
510 Twin Oaks Dr, WYNNEWOOD, PA 19096
MLS# PAMC2180792Listed by: KELLER WILLIAMS MAIN LINE 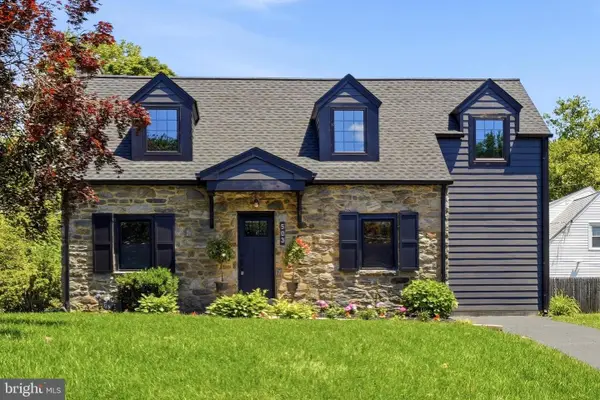 $959,000Active4 beds 4 baths2,281 sq. ft.
503 Haverford Rd, WYNNEWOOD, PA 19096
MLS# PAMC2180818Listed by: COMPASS PENNSYLVANIA, LLC $709,000Pending3 beds 2 baths1,356 sq. ft.
521 Shortridge Dr, WYNNEWOOD, PA 19096
MLS# PAMC2169924Listed by: COMPASS PENNSYLVANIA, LLC- Open Wed, 5 to 7pm
 $750,000Active4 beds 4 baths2,300 sq. ft.
1409 Edgevale Rd, WYNNEWOOD, PA 19096
MLS# PAMC2180582Listed by: KELLER WILLIAMS MAIN LINE  $1,629,000Active6 beds 4 baths4,891 sq. ft.
1436 Hillside Rd, WYNNEWOOD, PA 19096
MLS# PAMC2180122Listed by: BHHS FOX & ROACH-HAVERFORD $3,175,000Active4 beds 6 baths4,564 sq. ft.
519 Sussex Rd, WYNNEWOOD, PA 19096
MLS# PAMC2180026Listed by: KELLER WILLIAMS MAIN LINE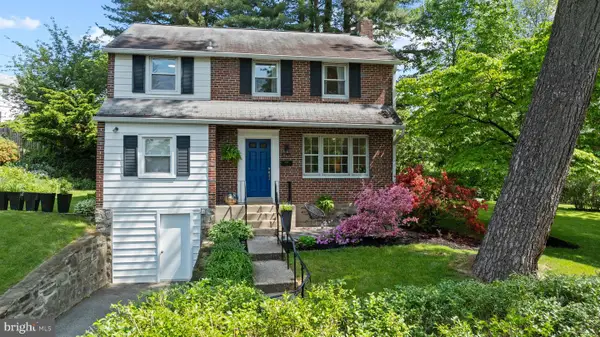 $685,000Pending4 beds 2 baths1,749 sq. ft.
501 Glen Arbor Dr, WYNNEWOOD, PA 19096
MLS# PAMC2171778Listed by: COMPASS PENNSYLVANIA, LLC $1,749,000Active4 beds 4 baths3,676 sq. ft.
1217 Medford Rd, WYNNEWOOD, PA 19096
MLS# PAMC2175682Listed by: BHHS FOX & ROACH-HAVERFORD $625,000Pending4 beds 2 baths1,634 sq. ft.
217 Rock Glen Rd, WYNNEWOOD, PA 19096
MLS# PAMC2179710Listed by: KELLER WILLIAMS MAIN LINE $550,000Pending3 beds 3 baths1,984 sq. ft.
127 Crosshill Rd, WYNNEWOOD, PA 19096
MLS# PAMC2168122Listed by: BHHS FOX & ROACH-HAVERFORD $625,000Pending3 beds 2 baths1,636 sq. ft.
259 Harrogate Rd, WYNNEWOOD, PA 19096
MLS# PAMC2179476Listed by: BHHS FOX & ROACH-HAVERFORD $379,900Pending3 beds 1 baths1,224 sq. ft.
105 Rock Glen Rd, WYNNEWOOD, PA 19096
MLS# PAMC2178838Listed by: BHHS FOX & ROACH-HAVERFORD $875,000Pending4 beds 3 baths2,488 sq. ft.
1711 Powder Mill Ln, WYNNEWOOD, PA 19096
MLS# PADE2113770Listed by: KELLER WILLIAMS MAIN LINE $1,775,000Active5 beds 5 baths4,500 sq. ft.
405 Wynmere Rd, WYNNEWOOD, PA 19096
MLS# PAMC2178262Listed by: COMPASS PENNSYLVANIA, LLC $2,599,000Active5 beds 6 baths5,000 sq. ft.
1148 Morris Rd, WYNNEWOOD, PA 19096
MLS# PAMC2169686Listed by: COMPASS PENNSYLVANIA, LLC $975,000Active5 beds 4 baths3,434 sq. ft.
6 Overbrook Pkwy, WYNNEWOOD, PA 19096
MLS# PAMC2176574Listed by: KELLER WILLIAMS REALTY GROUP $3,500,000Pending7 beds 6 baths8,039 sq. ft.
411 Wister Rd, WYNNEWOOD, PA 19096
MLS# PAMC2176584Listed by: KW MAIN LINE - NARBERTH $2,400,000Pending5 beds 6 baths5,051 sq. ft.
454 Moreno Rd, WYNNEWOOD, PA 19096
MLS# PAMC2176582Listed by: BHHS FOX & ROACH-HAVERFORD $850,000Pending3 beds 2 baths2,354 sq. ft.
266 Tomkenn Rd, WYNNEWOOD, PA 19096
MLS# PAMC2175320Listed by: RE/MAX MAIN LINE-WEST CHESTER $2,250,000Pending5 beds 7 baths5,391 sq. ft.
136 Gypsy Ln, WYNNEWOOD, PA 19096
MLS# PAMC2175852Listed by: BHHS FOX & ROACH-HAVERFORD $1,195,000Pending4 beds 4 baths2,970 sq. ft.
1 Allendale Rd #, WYNNEWOOD, PA 19096
MLS# PAMC2175676Listed by: BHHS FOX & ROACH-HAVERFORD $649,000Pending3 beds 4 baths2,322 sq. ft.
1007 Hampstead Rd, WYNNEWOOD, PA 19096
MLS# PADE2112562Listed by: KW MAIN LINE - NARBERTH $1,595,000Pending4 beds 4 baths3,985 sq. ft.
421 Wister Rd, WYNNEWOOD, PA 19096
MLS# PAMC2168578Listed by: COMPASS PENNSYLVANIA, LLC $949,000Active4 beds 4 baths2,347 sq. ft.
1022 Clover Hill Rd, WYNNEWOOD, PA 19096
MLS# PAMC2174548Listed by: COMPASS PENNSYLVANIA, LLC $1,250,000Pending5 beds 5 baths3,758 sq. ft.
401 Sabine Ave, WYNNEWOOD, PA 19096
MLS# PAMC2174226Listed by: COMPASS PENNSYLVANIA, LLC $850,000Pending3 beds 5 baths2,940 sq. ft.
1255 Montgomery Ave, WYNNEWOOD, PA 19096
MLS# PAMC2174496Listed by: EXP REALTY, LLC- Open Sun, 1 to 3pm
 $665,000Active3 beds 2 baths1,724 sq. ft.
310 Old Forest Rd, WYNNEWOOD, PA 19096
MLS# PADE2111964Listed by: COMPASS PENNSYLVANIA, LLC  $1,695,000Pending5 beds 4 baths4,052 sq. ft.
316 Mcclenaghan Mill Rd, WYNNEWOOD, PA 19096
MLS# PAMC2174276Listed by: KELLER WILLIAMS MAIN LINE $1,250,000Pending5 beds 4 baths2,814 sq. ft.
46 Rosedale Rd, WYNNEWOOD, PA 19096
MLS# PAMC2170272Listed by: RE/MAX MAIN LINE-WEST CHESTER $2,195,000Pending5 beds 5 baths5,001 sq. ft.
305 Wister Road, WYNNEWOOD, PA 19096
MLS# PAMC2171742Listed by: BHHS FOX & ROACH-HAVERFORD $2,975,000Active8 beds 6 baths8,361 sq. ft.
1319 Remington Rd, WYNNEWOOD, PA 19096
MLS# PAMC2171220Listed by: THE GREENE REALTY GROUP $1,375,000Pending6 beds 5 baths4,259 sq. ft.
210 Kent Rd, ARDMORE, PA 19003
MLS# PAMC2170652Listed by: BHHS FOX & ROACH-ROSEMONT $972,000Pending4 beds 3 baths3,018 sq. ft.
259 Tomkenn Rd, WYNNEWOOD, PA 19096
MLS# PAMC2168564Listed by: BHHS FOX & ROACH THE HARPER AT RITTENHOUSE SQUARE $1,995,000Pending5 beds 5 baths4,790 sq. ft.
404 Wynmere Rd, WYNNEWOOD, PA 19096
MLS# PAMC2170032Listed by: VANGUARD REALTY ASSOCIATES $1,275,000Pending6 beds 4 baths3,100 sq. ft.
214 Kent Rd, ARDMORE, PA 19003
MLS# PAMC2166280Listed by: BHHS FOX & ROACH-ROSEMONT $2,596,000Active10 beds 8 baths9,852 sq. ft.
1118 Indian Creek Rd, WYNNEWOOD, PA 19096
MLS# PAMC2166046Listed by: COMPASS PENNSYLVANIA, LLC
Local realty services provided by:CENTURY 21 Ryon Real Estate
Neighborhoods near Wynnewood, PA
Zip codes near Wynnewood, PA
- 19003 homes for sale
- 19004 homes for sale
- 19010 homes for sale
- 19026 homes for sale
- 19035 homes for sale
- 19041 homes for sale
- 19050 homes for sale
- 19066 homes for sale
- 19072 homes for sale
- 19082 homes for sale
- 19083 homes for sale
- 19085 homes for sale
- 19096 homes for sale
- 19104 homes for sale
- 19127 homes for sale
- 19128 homes for sale
- 19129 homes for sale
- 19131 homes for sale
- 19139 homes for sale
- 19151 homes for sale
Popular searches near Wynnewood, PA
- Ardmore homes for sale
- Bala Cynwyd homes for sale
- Broomall homes for sale
- Bryn Mawr homes for sale
- Bryn Mawr homes for sale
- Drexel Hill homes for sale
- East Lansdowne homes for sale
- Gladwyne homes for sale
- Haverford homes for sale
- Havertown homes for sale
- Lansdowne homes for sale
- Lower Merion Township homes for sale
- Merion Station homes for sale
- Narberth homes for sale
- Penn Valley homes for sale
- Penn Wynne homes for sale
- Rosemont homes for sale
- Upper Darby homes for sale
- Villanova homes for sale
- Villanova homes for sale
Protect your home and budget from life's surprises with an Assurant Home Warranty, backed by a partner that supports you through every step of homeownership. Explore Plans.
©2026 Century 21 Real Estate LLC. All rights reserved. CENTURY 21®, the CENTURY 21 Logo and C21® are service marks owned by Century 21 Real Estate LLC. Century 21 Real Estate LLC fully supports the principles of the Fair Housing Act and the Equal Opportunity Act. Each office is independently owned and operated. Listing information is deemed reliable but not guaranteed accurate.