- Boonesborough-White Hall homes for sale
- Cottonburg-Valley View homes for sale
- Ford-Boonesborough homes for sale
- Georgetown homes for sale
- Lexington homes for sale
- Lexington-Fayette homes for sale
- Lexington-Fayette Central homes for sale
- Lexington-Fayette Northeast homes for sale
- Lexington-Fayette Northwest homes for sale
- Lexington-Fayette Southeast homes for sale
- Lexington-Fayette Southwest homes for sale
- Midway homes for sale
- Nicholasville homes for sale
- Paris homes for sale
- Salvisa homes for sale
- South Woodford homes for sale
- Stamping Ground homes for sale
- Versailles homes for sale
- Wilmore homes for sale
- Winchester homes for sale
Fayette County, KY - homes for sale
38 of 38 results displayed
 $1,995,000Pending2.1 Acres
1717 Clays Spring Lane, Lexington, KY 40502
MLS# 26005772Listed by: DIY FLAT FEE.COM $750,000Active0.58 Acres
216 Southland Drive, Lexington, KY 40503
MLS# 26004702Listed by: BLOCK + LOT REAL ESTATE $315,000Active10.2 Acres
4248 Ambergy Court, Lexington, KY 40516
MLS# 26004282Listed by: REAL BROKER, LLC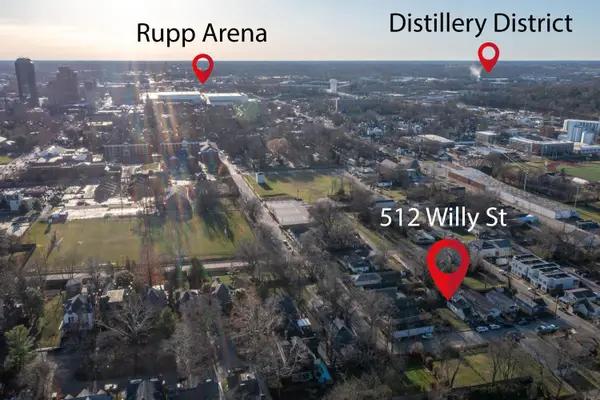 $49,900Active0.05 Acres
512 Willy Street, Lexington, KY 40508
MLS# 26003926Listed by: KELLER WILLIAMS BLUEGRASS REALTY $949,900Active0.4 Acres
1209 Winchester Road, Lexington, KY 40505
MLS# 26003676Listed by: LEGACY REAL ESTATE FIRM $49,900Pending0.17 Acres
1030 Meadow Lane, Lexington, KY 40505
MLS# 26003533Listed by: RE/MAX CREATIVE REALTY $55,000Active0.32 Acres
1745 Old Paris Road, Lexington, KY 40505
MLS# 26003320Listed by: RE/MAX CREATIVE REALTY $100,000Active0.49 Acres
2339 Pierson Drive, Lexington, KY 40505
MLS# 26002399Listed by: RED 1 REALTY $100,000Active1.3 Acres
2887 Richmond Road, Lexington, KY 40509
MLS# 26001205Listed by: KELLER WILLIAMS COMMONWEALTH $275,000Active0.38 Acres
563 Gingermill Lane, Lexington, KY 40509
MLS# 26000210Listed by: BLUEGRASS SOTHEBY'S INTERNATIONAL REALTY $299,000Active10 Acres
7390 Russell Cave Road, Lexington, KY 40511
MLS# 25507599Listed by: THE BROKERAGE $370,000Active14.3 Acres
7350 Russell Cave Road, Lexington, KY 40511
MLS# 25507600Listed by: THE BROKERAGE $310,000Active10 Acres
7300 Russell Cave Road, Lexington, KY 40511
MLS# 25507601Listed by: THE BROKERAGE $349,900Active10.3 Acres
4175 Ambergy Court, Lexington, KY 40516
MLS# 25507753Listed by: THE BROKERAGE $1,950,000Active10 Acres
2821 Winchester Road, Lexington, KY 40509
MLS# 25507337Listed by: THE GIBSON COMPANY $79,999Active0.21 Acres
123 Henton Road, Lexington, KY 40508
MLS# 25506797Listed by: THE BROKERAGE $395,000Pending2.91 Acres
2275 N Broadway, Lexington, KY 40505
MLS# 25505693Listed by: SOUTHERN CHARM REALTY
 $179,000Pending1.02 Acres
6311 Jacks Creek Pike, Lexington, KY 40515
MLS# 25505441Listed by: CENTURY 21 ADVANTAGE REALTY $421,999Active10.03 Acres
5651 Canebrake Court, Lexington, KY 40509
MLS# 25504704Listed by: RE/MAX CREATIVE REALTY $138,000Active1.38 Acres
5540 Athens Boonesboro Road, Lexington, KY 40509
MLS# 25502613Listed by: LIFSTYL REAL ESTATE $3,900,000Active7.71 Acres
2324 Paris Pike, Lexington, KY 40505
MLS# 25501785Listed by: KELLER WILLIAMS COMMONWEALTH $365,000Active10 Acres
4322 Ambergy Court, Lexington, KY 40516
MLS# 25500609Listed by: BLUEGRASS PROPERTIES GROUP $1,375,000Pending214 Acres
4700 Haley Downs Drive, Lexington, KY 40516
MLS# 20108361Listed by: RECTOR HAYDEN REALTORS $325,000Active10.8 Acres
4300 Oscar Drive #6, Lexington, KY 40516
MLS# 25015081Listed by: BLUEGRASS SOTHEBY'S INTERNATIONAL REALTY $325,000Active10.1 Acres
4400 Oscar Drive #4, Lexington, KY 40516
MLS# 25015082Listed by: BLUEGRASS SOTHEBY'S INTERNATIONAL REALTY $325,000Active10.2 Acres
3948 Wilson Lake Lane #25, Lexington, KY 40516
MLS# 25015083Listed by: BLUEGRASS SOTHEBY'S INTERNATIONAL REALTY $325,000Active10.2 Acres
4022 Wilson Lake Lane #24, Lexington, KY 40516
MLS# 25015084Listed by: BLUEGRASS SOTHEBY'S INTERNATIONAL REALTY $360,000Active10.1 Acres
2248 Garner Lane, Lexington, KY 40516
MLS# 25015390Listed by: BLUEGRASS PROPERTIES GROUP $575,000Pending10.04 Acres
2541 Northwind Lane, Lexington, KY 40511
MLS# 25016029Listed by: BLUEGRASS SOTHEBY'S INTERNATIONAL REALTY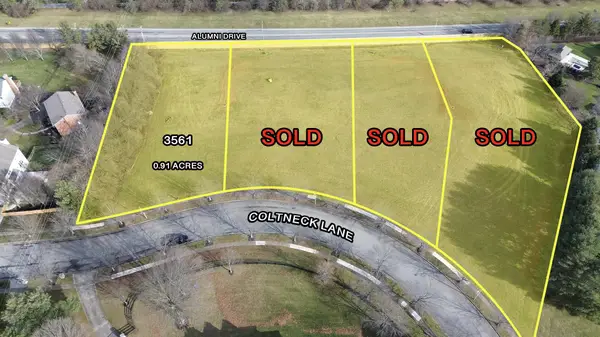 $649,000Active0.91 Acres
3561 Coltneck Lane, Lexington, KY 40502
MLS# 24000208Listed by: BLOCK + LOT REAL ESTATE $179,500Active10.69 Acres
4136 Kentucky River Parkway, Lexington, KY 40515
MLS# 24003562Listed by: RE/MAX ELITE REALTY $385,000Active10.3 Acres
4575 Wilson Lake Lane, Lexington, KY 40516
MLS# 24022284Listed by: RECTOR HAYDEN REALTORS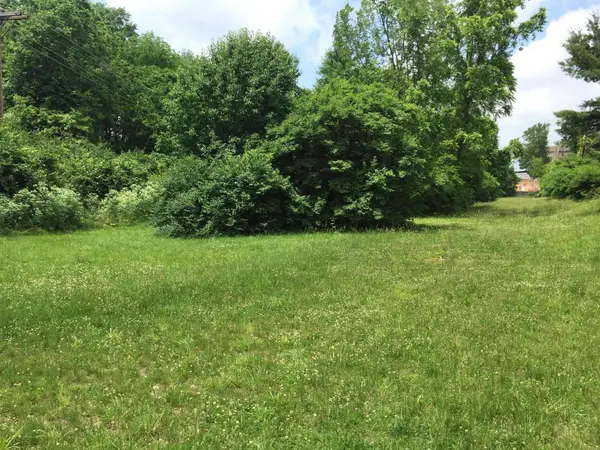 $195,000Active2.86 Acres
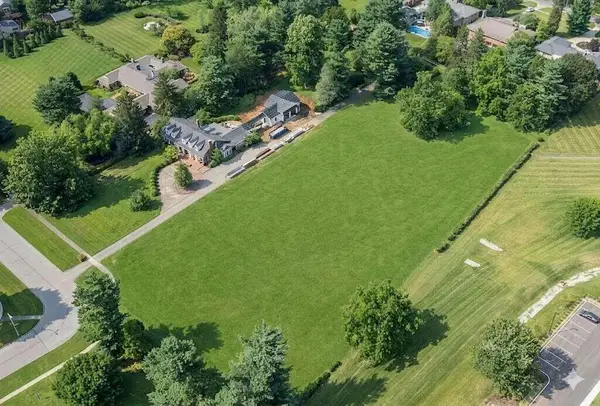
500 Bob-o-link Drive, Lexington, KY 40503
MLS# 25010087Listed by: KELLER WILLIAMS BLUEGRASS REALTY $1,100,000Active1.01 Acres
1311 Winchester Road, Lexington, KY 40505
MLS# 26000147Listed by: KELLER WILLIAMS BLUEGRASS REALTY $4,150,000Pending0.74 Acres
221-239 W Short Street, Lexington, KY 40507
MLS# 25018584Listed by: BLOCK + LOT REAL ESTATE $1,200,000Pending0.12 Acres
102-112 W Short Street, Lexington, KY 40507
MLS# 25018559Listed by: BLOCK + LOT REAL ESTATE $889,000Active40 Acres
1601 Berea Road, Lexington, KY 40511
MLS# 26001994Listed by: BLUEGRASS SOTHEBY'S INTERNATIONAL REALTY $349,000Active10 Acres
4540 Wilson Lake Lane, Lexington, KY 40516
MLS# 26004044Listed by: LIFSTYL REAL ESTATE
Local realty services provided by:CENTURY 21 Advantage Realty
Popular searches near Fayette County, KY
Popular neighborhoods near Fayette County, KY
- Ashland, Lexington homes for sale
- Ashland Park, Lexington homes for sale
- Aylesford Place, Lexington homes for sale
- Bryan Station, Lexington homes for sale
- Chevy Chase, Lexington homes for sale
- District 3, Lexington homes for sale
- District 5, Lexington homes for sale
- District 6, Lexington homes for sale
- Fairway, Lexington homes for sale
- Historic South Hill, Lexington homes for sale
- Idle Hour, Lexington homes for sale
- Kenwick, Lexington homes for sale
- Lansdowne Merrick, Lexington homes for sale
- Liberty Area, Lexington homes for sale
- Martin Luther King, Lexington homes for sale
- Meadows/Loudon, Lexington homes for sale
- Mentelle, Lexington homes for sale
- North Upper Street, Lexington homes for sale
- Northside, Lexington homes for sale
- William Wells Brown, Lexington homes for sale
Zip codes near Fayette County, KY
- 40324 homes for sale
- 40347 homes for sale
- 40356 homes for sale
- 40361 homes for sale
- 40383 homes for sale
- 40390 homes for sale
- 40391 homes for sale
- 40502 homes for sale
- 40503 homes for sale
- 40504 homes for sale
- 40505 homes for sale
- 40507 homes for sale
- 40508 homes for sale
- 40509 homes for sale
- 40511 homes for sale
- 40513 homes for sale
- 40514 homes for sale
- 40515 homes for sale
- 40516 homes for sale
- 40517 homes for sale
Protect your home and budget from life's surprises with an Assurant Home Warranty, backed by a partner that supports you through every step of homeownership. Explore Plans.
©2026 Century 21 Real Estate LLC. All rights reserved. CENTURY 21®, the CENTURY 21 Logo and C21® are service marks owned by Century 21 Real Estate LLC. Century 21 Real Estate LLC fully supports the principles of the Fair Housing Act and the Equal Opportunity Act. Each office is independently owned and operated. Listing information is deemed reliable but not guaranteed accurate.