- Arcadia, Columbia homes for sale
- Auburn Hills, Columbia homes for sale
- Bourn Avenue, Columbia homes for sale
- Douglass Park, Columbia homes for sale
- Grindstone, Columbia homes for sale
- Hominy Branch, Columbia homes for sale
- King's Meadow, Columbia homes for sale
- Lake Saint Louis, Lake Saint Louis homes for sale
- Meadowvale, Columbia homes for sale
- North Central, Columbia homes for sale
- Old Hawthorne, Columbia homes for sale
- Old Southwest, Columbia homes for sale
- Parkdale, Columbia homes for sale
- Shepard Boulevard, Columbia homes for sale
- Southwest Hills, Columbia homes for sale
- The Highlands, Columbia homes for sale
- Thornbrook, Columbia homes for sale
- University Park, Columbia homes for sale
- Valley View Gardens, Columbia homes for sale
- White Gate, Columbia homes for sale
Montgomery City, MO - homes for sale
7 of 7 results displayed
- Coming Soon
 $219,500Coming Soon3 beds 2 baths
1063 Ravenwood Drive, Montgomery City, MO 63361
MLS# 26017457Listed by: MILNER AGENCY - New
 $139,900Active2 beds 1 baths936 sq. ft.
559 W Bell Street, Montgomery City, MO 63361
MLS# 26017426Listed by: MILNER AGENCY  $179,900Pending2 beds 2 baths1,505 sq. ft.
718 N Sturgeon Street, Montgomery City, MO 63361
MLS# 26015531Listed by: MILNER AGENCY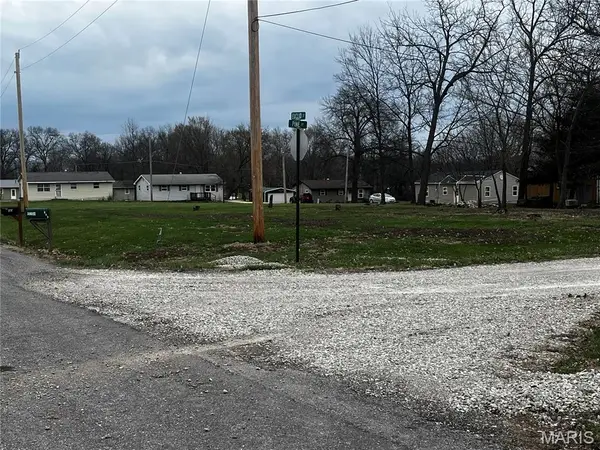 $15,000Pending0.22 Acres
0 Pine, Montgomery City, MO 63361
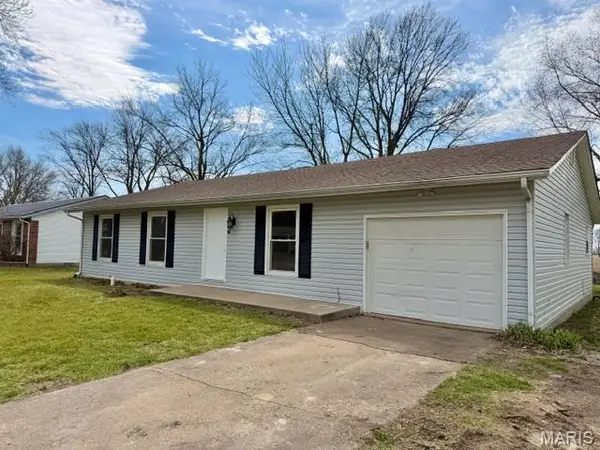
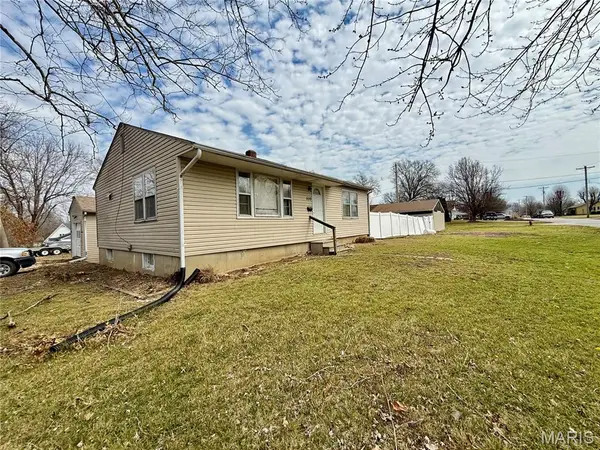
MLS# 26014562Listed by: WORTH CLARK REALTY $219,000Active3 beds 2 baths1,684 sq. ft.
505 W Walsh Street, Montgomery City, MO 63361
MLS# 26013888Listed by: MILNER AGENCY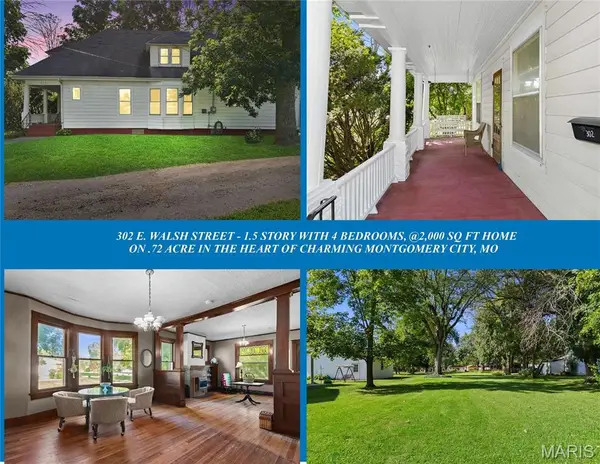 $125,000Active4 beds 1 baths2,025 sq. ft.
302 E Walsh Street, Montgomery City, MO 63361
MLS# 26005548Listed by: RE/MAX EDGE $35,000Pending1 Acres
O Rose, Montgomery City, MO 63361
MLS# 25064777Listed by: WORTH CLARK REALTY
Local realty services provided by:CENTURY 21 Community
Copyright 2026 Mid-America Regional Information Systems. All rights reserved. Listings courtesy of Mid-America Regional Information Systems as distributed by MLS GRID <Last Updated March 25, 2026. Mid-America Regional Information Systems provides content displayed here (“provided content”) on an “as is” basis and makes no representations or warranties regarding the provided content, including, but not limited to those of non-infringement, timeliness, accuracy, or completeness. Individuals and companies using information presented are responsible for verification and validation of information they utilize and present to their customers and clients. Mid-America Regional Information Systems will not be liable for any damage or loss resulting from use of the provided content or the products available through Portals, IDX, VOW, and/or Syndication. Recipients of this information shall not resell, redistribute, reproduce, modify, or otherwise copy any portion thereof without the expressed written consent of Mid-America Regional Information Systems.
Neighborhoods near Montgomery City, MO
Zip codes near Montgomery City, MO
- 63333 homes for sale
- 63339 homes for sale
- 63349 homes for sale
- 63350 homes for sale
- 63351 homes for sale
- 63352 homes for sale
- 63359 homes for sale
- 63361 homes for sale
- 63363 homes for sale
- 63377 homes for sale
- 63380 homes for sale
- 63382 homes for sale
- 63383 homes for sale
- 63384 homes for sale
- 63388 homes for sale
- 65041 homes for sale
- 65067 homes for sale
- 65069 homes for sale
- 65231 homes for sale
- 65262 homes for sale
Popular searches near Montgomery City, MO
- Bear Creek homes for sale
- Bellflower homes for sale
- Bridgeport homes for sale
- Camp Branch homes for sale
- Cuivre homes for sale
- Danville Township homes for sale
- High Hill homes for sale
- Jonesburg homes for sale
- Linn homes for sale
- Loutre homes for sale
- Middletown homes for sale
- Montgomery homes for sale
- New Florence homes for sale
- Nine Mile Prairie homes for sale
- Prairie homes for sale
- Prairie homes for sale
- Rhineland homes for sale
- Upper Loutre homes for sale
- Wellsville homes for sale
- Williamsburg homes for sale
Protect your home and budget from life's surprises with an Assurant Home Warranty, backed by a partner that supports you through every step of homeownership. Explore Plans.
©2026 Century 21 Real Estate LLC. All rights reserved. CENTURY 21®, the CENTURY 21 Logo and C21® are service marks owned by Century 21 Real Estate LLC. Century 21 Real Estate LLC fully supports the principles of the Fair Housing Act and the Equal Opportunity Act. Each office is independently owned and operated. Listing information is deemed reliable but not guaranteed accurate.