- Ashfield homes for sale
- Bernardston homes for sale
- Buckland homes for sale
- Charlemont homes for sale
- Conway homes for sale
- Deerfield homes for sale
- Greenfield homes for sale
- Guilford homes for sale
- Halifax homes for sale
- Heath homes for sale
- Monroe homes for sale
- Monroe Bridge homes for sale
- Readsboro homes for sale
- Rowe homes for sale
- Shelburne homes for sale
- Shelburne Falls homes for sale
- Turners Falls homes for sale
- Vernon homes for sale
- Whitingham homes for sale
- Whitingham town homes for sale
01340, MA - homes for sale
6 of 6 results displayed
- New
 $79,900Active0.49 Acres
32 Navaho Ln, Heath, MA 01346
MLS# 73551624Listed by: Keller Williams Realty North Central - New
 $125,000Active3.23 Acres
38 Ed Clark Rd, Colrain, MA 01340
MLS# 73548623Listed by: REMAX Connections - Greenfield  $15,000Active0.35 Acres
30 W Brook Dr, Heath, MA 01346
MLS# 73534934Listed by: REMAX Connections - Greenfield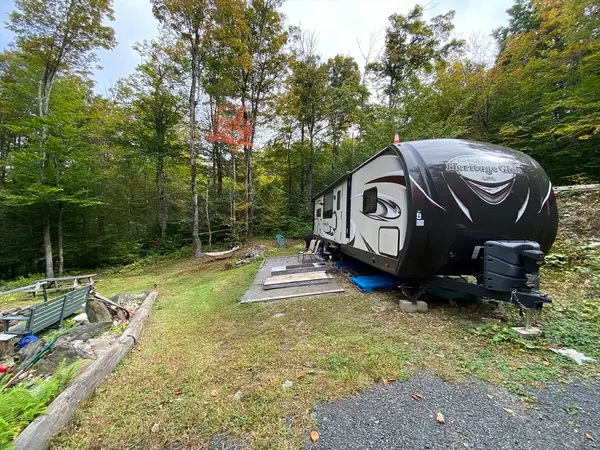 $55,000Active0.65 Acres
35 Cheyenne St, Heath, MA 01346
MLS# 73519713Listed by: Cohn & Company $305,000Active91 Acres
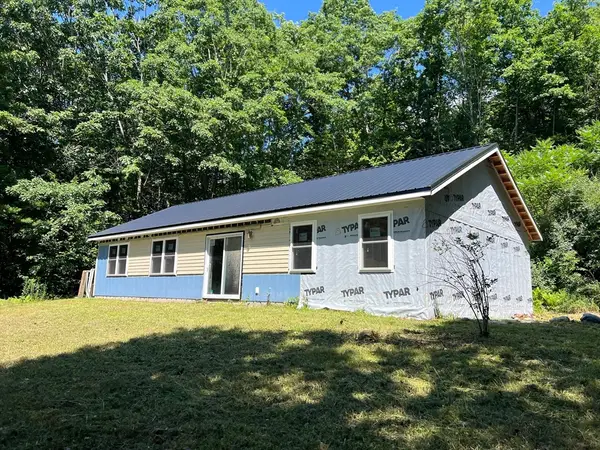
0 Number 9 Rd, Heath, MA 01340
MLS# 73506891Listed by: Cohn & Company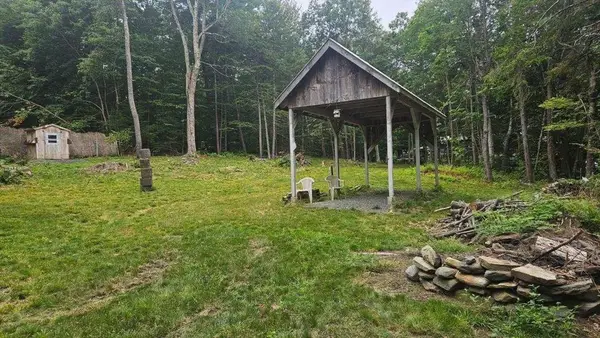 $55,000Active1.3 Acres
8 Deer Run Path, Heath, MA 01346
MLS# 73475758Listed by: Cohn & Company
Local realty services provided by:CENTURY 21 McLennan & Company
Popular searches near 01340
Popular neighborhoods near 01340
- Bay, Springfield homes for sale
- Boston Road, Springfield homes for sale
- East Forest Park, Springfield homes for sale
- East Springfield, Springfield homes for sale
- Eastside, Troy homes for sale
- Forest Park, Springfield homes for sale
- Frear Park, Troy homes for sale
- Hungry Hill, Springfield homes for sale
- Indian Orchard, Indian Orchard homes for sale
- Liberty Heights, Springfield homes for sale
- McKnight, Springfield homes for sale
- Memorial Square, Springfield homes for sale
- Metro Center, Springfield homes for sale
- Old Hill, Springfield homes for sale
- Pine Point, Springfield homes for sale
- Six Corners, Springfield homes for sale
- Sixteen Acres, Springfield homes for sale
- South End, Springfield homes for sale
- Sycaway, Troy homes for sale
- Upper Hill, Springfield homes for sale
Counties near Colrain, 01340
- Albany County homes for sale
- Bennington County homes for sale
- Berkshire County homes for sale
- Capitol County homes for sale
- Cheshire County homes for sale
- Columbia County homes for sale
- Franklin County homes for sale
- Hampden County homes for sale
- Hampshire County homes for sale
- Hartford County homes for sale
- Hillsborough County homes for sale
- Rensselaer County homes for sale
- Rutland County homes for sale
- Saratoga County homes for sale
- Sullivan County homes for sale
- Tolland County homes for sale
- Washington County homes for sale
- Windham County homes for sale
- Windsor County homes for sale
- Worcester County homes for sale
Protect your home and budget from life's surprises with an Assurant Home Warranty, backed by a partner that supports you through every step of homeownership. Explore Plans.
©2026 Century 21 Real Estate LLC. All rights reserved. CENTURY 21®, the CENTURY 21 Logo and C21® are service marks owned by Century 21 Real Estate LLC. Century 21 Real Estate LLC fully supports the principles of the Fair Housing Act and the Equal Opportunity Act. Each office is independently owned and operated. Listing information is deemed reliable but not guaranteed accurate.