- Almira homes for sale
- Colville Reservation homes for sale
- Coulee City homes for sale
- Coulee City homes for sale
- Coulee Dam homes for sale
- Creston homes for sale
- Davenport homes for sale
- Deer Meadows homes for sale
- Electric City homes for sale
- Fruitland homes for sale
- Grand Coulee homes for sale
- Grand Coulee homes for sale
- Harrington homes for sale
- Lincoln homes for sale
- Marlin homes for sale
- Odessa homes for sale
- Seven Bays homes for sale
- Spokane Reservation homes for sale
- Wilbur homes for sale
- Wilson Creek homes for sale
99185, WA - homes for sale
24 of 24 results displayed
- New
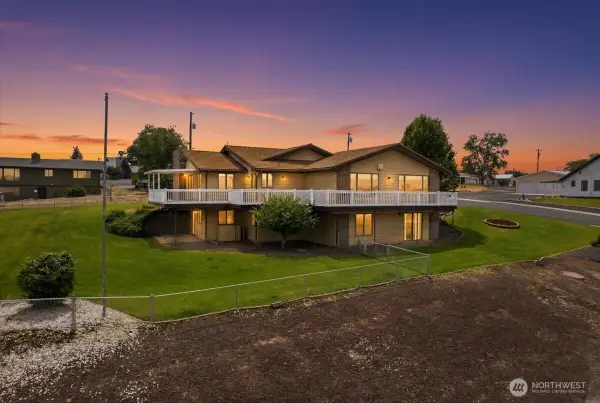 $699,000Active4 beds 3 baths2,436 sq. ft.
607 Brace Se, Wilbur, WA 99185
MLS# 2548012Listed by: EXP REALTY
- New
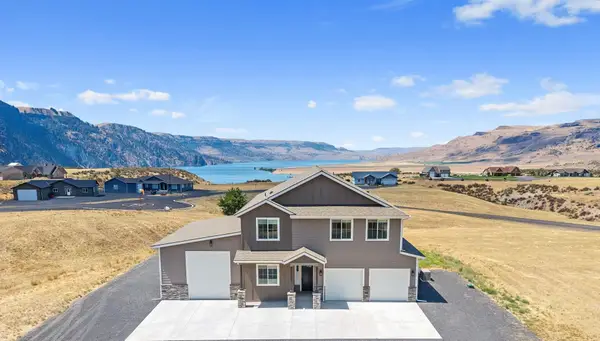 $798,000Active4 beds 3 baths2,970 sq. ft.
44205 N Tyax Ln, Wilbur, WA 99185
MLS# 202620631Listed by: KATZ REALTY, INC. 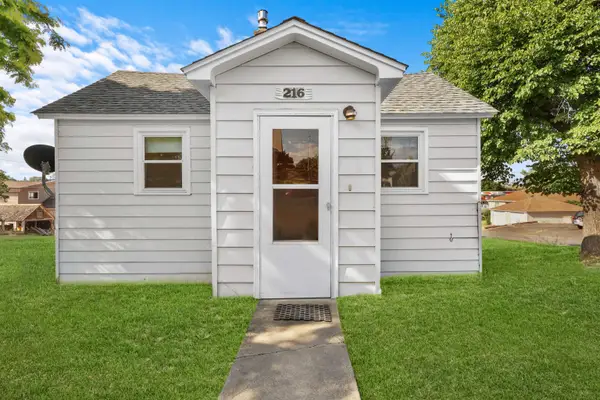 $199,900Active2 beds 1 baths1,308 sq. ft.
216 W Cole Ave, Wilbur, WA 99185
MLS# 202619877Listed by: EXP REALTY, LLC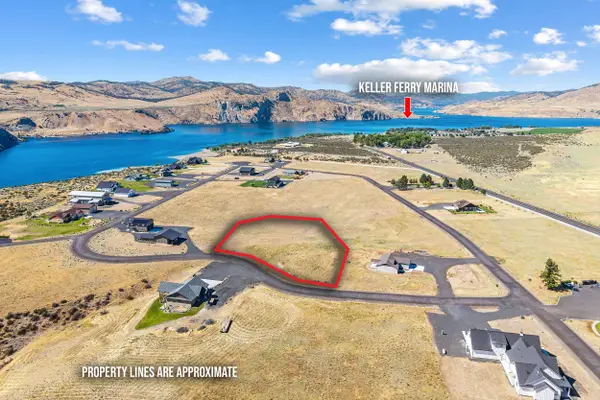 $135,000Active1.03 Acres
44290 N Sanpoil Rd, Wilbur, WA 99185
MLS# 202619716Listed by: KATZ REALTY, INC.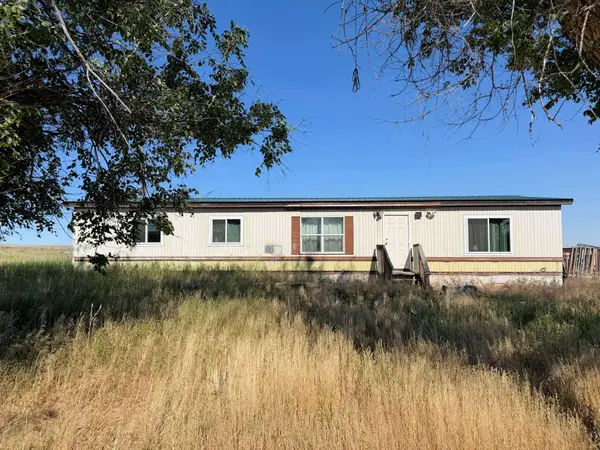 $174,900Active3 beds 2 baths1,344 sq. ft.
32498 N Crick Rd, Wilbur, WA 99185
MLS# 202619564Listed by: KATZ REALTY, INC. $1,800,000Active1122 Acres
45000 Hanson Harbor Road N, Wilbur, WA 99185
MLS# 2534610Listed by: COFFMAN PROPERTIES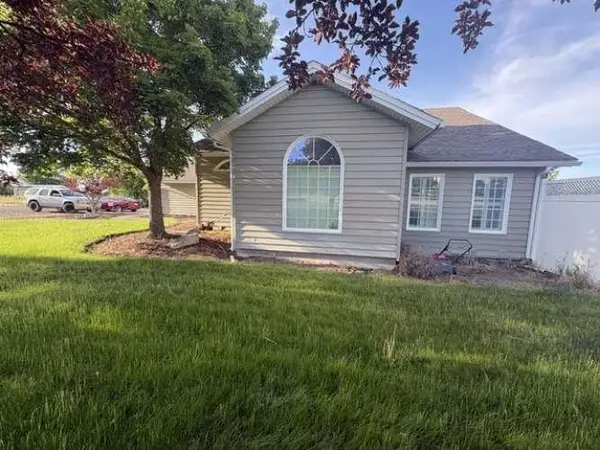 $294,500Active3 beds 2 baths2,517 sq. ft.
515 SW Broadway St, Wilbur, WA 99185
MLS# 202618496Listed by: CONGRESS REALTY, INC. $599,000Active4 beds 3 baths2,224 sq. ft.
301 SW West Street, Wilbur, WA 99185
MLS# 2528337Listed by: EXP REALTY $99,000Active1.01 Acres
44110 Covey Lane N #3, Wilbur, WA 99185
MLS# 2522864Listed by: COFFMAN PROPERTIES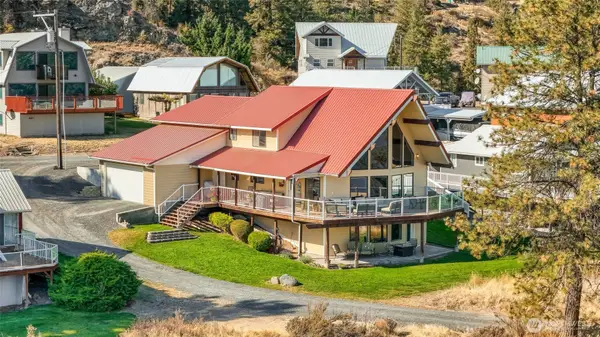 $897,000Active3 beds 3 baths2,184 sq. ft.
45220 Rantz Park Lane N, Wilbur, WA 99185
MLS# 2513941Listed by: BHGRE GARY MANN REALTY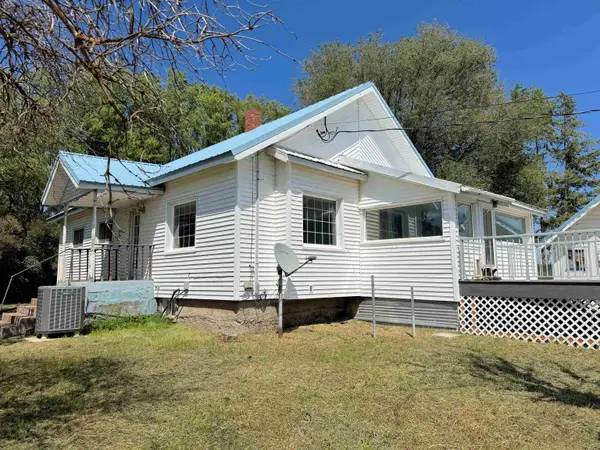 $535,000Active2 beds 2 baths2,240 sq. ft.
39500 N Sr 21 Hwy, Wilbur, WA 99185
MLS# 202615734Listed by: KATZ REALTY, INC.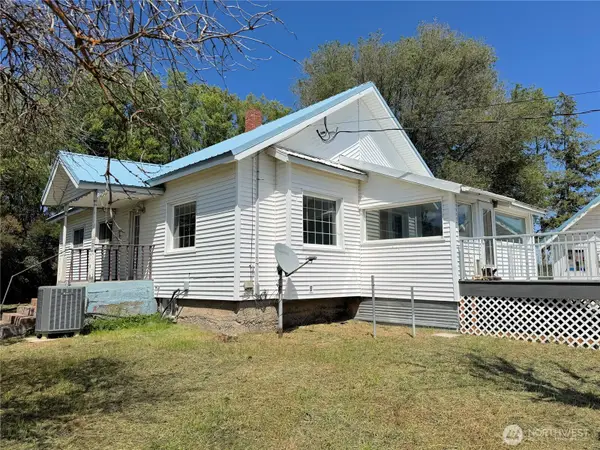 $535,000Active2 beds 2 baths2,240 sq. ft.
39500 Sr 21 N, Wilbur, WA 99185
MLS# 2505256Listed by: KATZ REALTY, INC.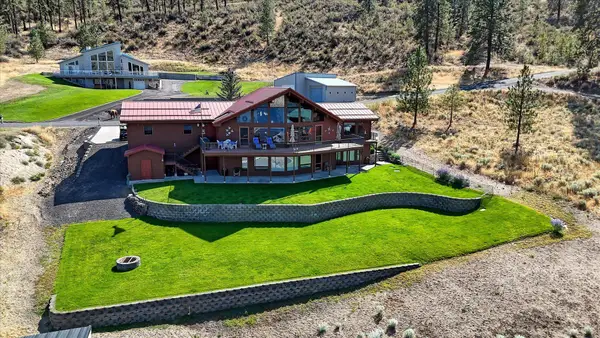 $799,000Active4 beds 4 baths3,600 sq. ft.
16547 Whitelaw Rd. E, Wilbur, WA 99185
MLS# 202614871Listed by: WINDERMERE CITY GROUP $476,000Active4 beds 4 baths4,628 sq. ft.
313 SE Trinity Avenue, Wilbur, WA 99185
MLS# 2502255Listed by: EXP REALTY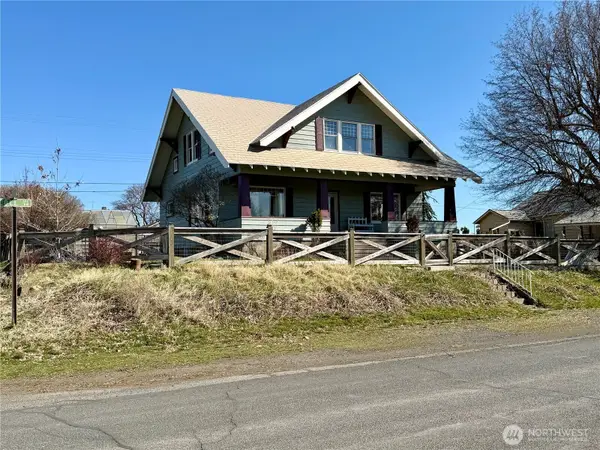 $339,000Active4 beds 2 baths3,302 sq. ft.
215 NW Cole Avenue, Wilbur, WA 99185
MLS# 2499724Listed by: COFFMAN PROPERTIES $335,000Active3 beds 2 baths1,960 sq. ft.
505 NW Portland Street, Wilbur, WA 99185
MLS# 2488324Listed by: COFFMAN PROPERTIES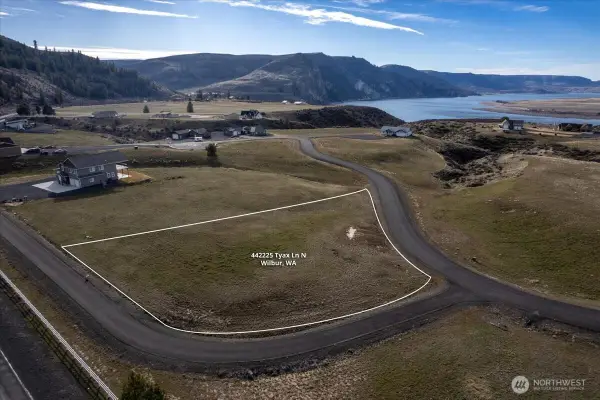 $129,999Active1.03 Acres
44225 Tyax Lane N, Wilbur, WA 99185
MLS# 2486323Listed by: EXP REALTY $475,000Active4 beds 3 baths2,365 sq. ft.
413 NW Dellah Ave, Wilbur, WA 99185
MLS# 202611117Listed by: EXP REALTY, LLC $170,000Active2 beds 2 baths1,458 sq. ft.
405 NW Dellah Avenue, Wilbur, WA 99185
MLS# 2438424Listed by: COFFMAN PROPERTIES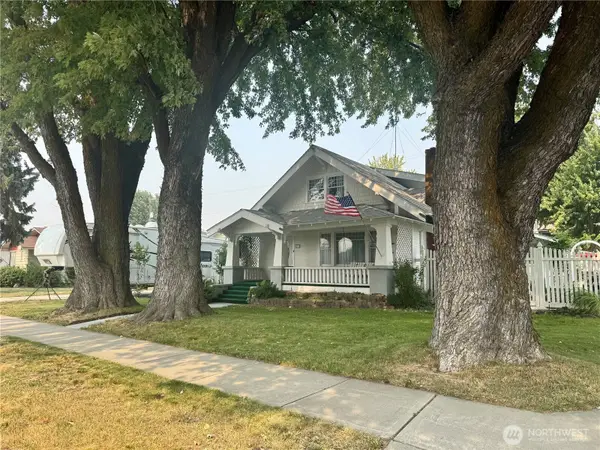 $324,000Active4 beds 2 baths2,796 sq. ft.
403 NW Main Avenue, Wilbur, WA 99185
MLS# 2430182Listed by: COFFMAN PROPERTIES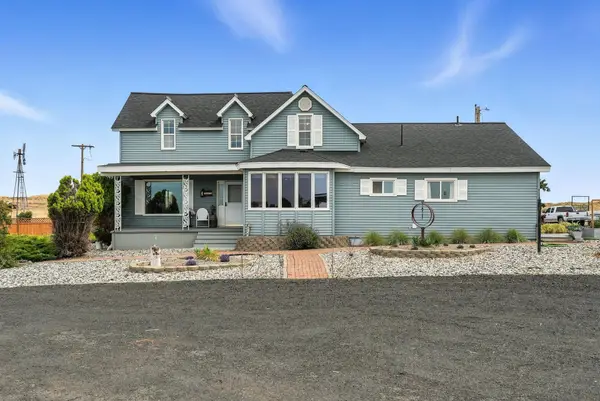 $1,795,000Active4 beds 2 baths2,275 sq. ft.
13550 State Route 2 E, Wilbur, WA 99185
MLS# 202522275Listed by: PRIME REAL ESTATE GROUP $47,500Active0.77 Acres
NNA State Route 2 E, Wilbur, WA 99185
MLS# 202613321Listed by: REALTY ONE GROUP ECLIPSE $28,500Active0.51 Acres
1 NW Blake Avenue #Lot 1,2,9&10, Wilbur, WA 99185
MLS# 1975618Listed by: COFFMAN PROPERTIES $16,000Active0.22 Acres
0 SW Trinity Avenue, Wilbur, WA 99185
MLS# 1990391Listed by: COFFMAN PROPERTIES
Local realty services provided by:CENTURY 21 Real Estate Center, CENTURY 21 Beutler & Associates
Listings courtesy of Northwest MLS as distributed by MLS GRID. Based on information submitted to the MLS GRID as of July 17, 2026. All data is obtained from various sources and may not have been verified by broker or MLS GRID. Supplied Open House Information is subject to change without notice. All information should be independently reviewed and verified for accuracy. Properties may or may not be listed by the office/agent presenting the information. Listing information is provided for consumers' personal, non-commercial use, solely to identify prospective properties for potential purchase; all other use is strictly prohibited and may violate relevant federal and state law. Information deemed reliable but not guaranteed. Copyright © 2026 MLS GRID. All Rights Reserved.
Popular searches near 99185
Popular neighborhoods near 99185
- Airway Heights, Airway Heights homes for sale
- Browne's Addition, Spokane homes for sale
- Cliff/Cannon, Spokane homes for sale
- Comstock, Spokane homes for sale
- Emerson, Spokane homes for sale
- Five Mile, Spokane homes for sale
- Grandview, Spokane homes for sale
- Latah Valley, Spokane homes for sale
- Lidgerwood Park, Spokane homes for sale
- Logan, Spokane homes for sale
- Manito, Spokane homes for sale
- Nevada / Lidgerwood, Spokane homes for sale
- North Hill, Spokane homes for sale
- North Indian Trail, Spokane homes for sale
- Northwest, Spokane homes for sale
- Riverside, Spokane homes for sale
- Shiloh Hills, Spokane homes for sale
- South Indian Trail, Spokane homes for sale
- West Central, Spokane homes for sale
- West Hills, Spokane homes for sale
Counties near Wilbur, 99185
- Adams County homes for sale
- Chelan County homes for sale
- Douglas County homes for sale
- Ferry County homes for sale
- Franklin County homes for sale
- Grant County homes for sale
- Kittitas County homes for sale
- Kootenai County homes for sale
- Lincoln County homes for sale
- Okanogan County homes for sale
- Pend Oreille County homes for sale
- Spokane County homes for sale
- Stevens County homes for sale
- Walla Walla County homes for sale
- Whitman County homes for sale
Protect your home and budget from life's surprises with an Assurant Home Warranty, backed by a partner that supports you through every step of homeownership. Explore Plans.
©2026 Century 21 Real Estate LLC. All rights reserved. CENTURY 21®, the CENTURY 21 Logo and C21® are service marks owned by Century 21 Real Estate LLC. Century 21 Real Estate LLC fully supports the principles of the Fair Housing Act and the Equal Opportunity Act. Each office is independently owned and operated. Listing information is deemed reliable but not guaranteed accurate.