- Alhambra homes for sale
- Commerce homes for sale
- Eagle Rock homes for sale
- East Los Angeles homes for sale
- East Pasadena homes for sale
- East San Gabriel homes for sale
- Glassell Park homes for sale
- Highland Park homes for sale
- Lincoln Heights homes for sale
- Montebello homes for sale
- Monterey Park homes for sale
- Rosemead homes for sale
- San Gabriel homes for sale
- San Marino homes for sale
- San Pasqual homes for sale
- South El Monte homes for sale
- South Pasadena homes for sale
- South San Gabriel homes for sale
- Southwest San Gabriel Valley homes for sale
- Temple City homes for sale
91803, CA - homes for sale
43 of 43 results displayed
- New
 $1,100,000Active3 beds 2 baths1,372 sq. ft.
1817 Elm Street, Alhambra, CA 91803
MLS# SR26065273Listed by: REPRESENTED BY - New
 $999,999Active3 beds 2 baths1,748 sq. ft.
1705 S Fremont, Alhambra, CA 91803
MLS# WS26061529Listed by: RE/MAX CHAMPIONS - Open Sat, 2 to 5pmNew
 $988,000Active3 beds 2 baths1,332 sq. ft.
2925 West Shorb Street, Alhambra, CA 91803
MLS# AR26048820Listed by: PINNACLE REAL ESTATE GROUP  $1,275,000Pending7 beds 6 baths
2802 W Ramona Rd, Alhambra, CA 91803
MLS# 260006338Listed by: KAM FINANCIAL REALTY- New
 $538,000Active2 beds 3 baths1,194 sq. ft.
1814 W Garvey Avenue #D, Alhambra, CA 91803
MLS# CRP1-26308Listed by: KELLER WILLIAMS REALTY  $599,000Active2 beds 3 baths1,210 sq. ft.
1014 S Marengo #7, Alhambra, CA 91803
MLS# WS26024888Listed by: RE/MAX PREMIER/ARCADIA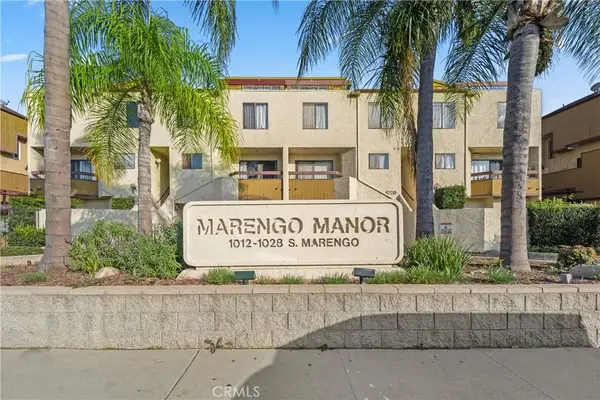 $599,000Active2 beds 3 baths1,210 sq. ft.
1014 S Marengo #7, Alhambra, CA 91803
MLS# WS26024888Listed by: RE/MAX PREMIER/ARCADIA $1,325,000Active6 beds 3 baths
1837 S 7th Street, Alhambra, CA 91803
MLS# AR26046942Listed by: RE/MAX PREMIER PROP ARCADIA $1,580,000Pending-- beds -- baths2,750 sq. ft.
805 S Olive Avenue, Alhambra, CA 91803
MLS# SR26041884Listed by: COLDWELL BANKER REALTY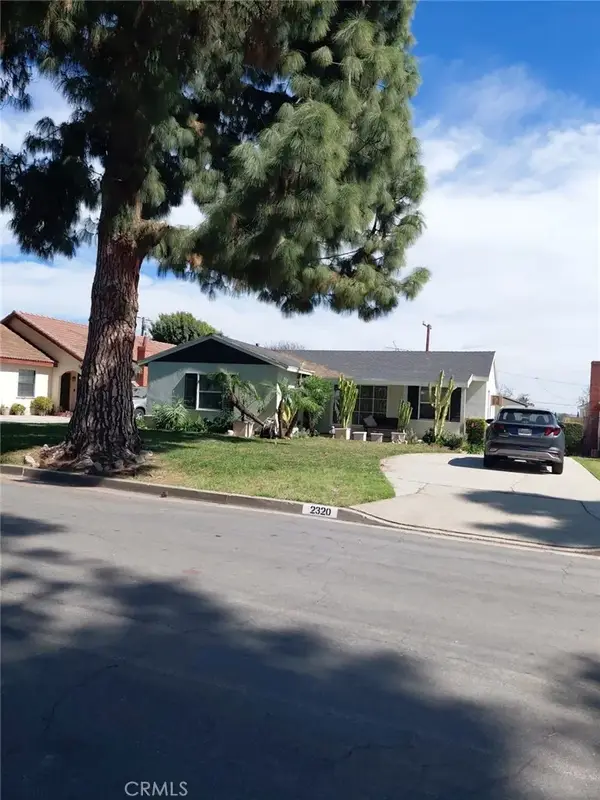 $860,000Pending2 beds 1 baths1,193 sq. ft.
2320 Hagen, Alhambra, CA 91803
MLS# TR26049726Listed by: TOP PRODUCERS REALTY PARTNERS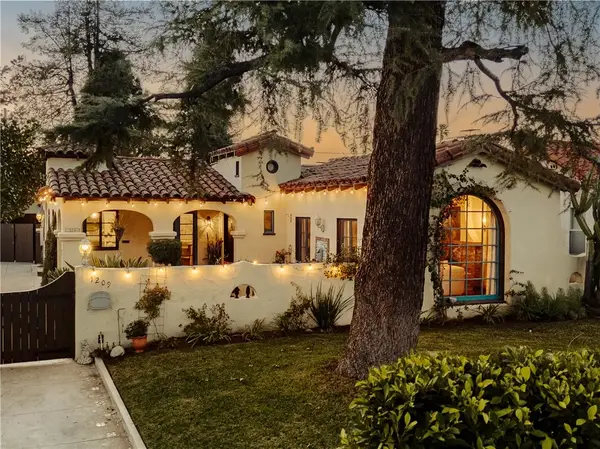 $1,199,888Pending3 beds 4 baths1,770 sq. ft.
1209 S 9th Street, Alhambra, CA 91801
MLS# CV26040989Listed by: RE/MAX TOP PRODUCERS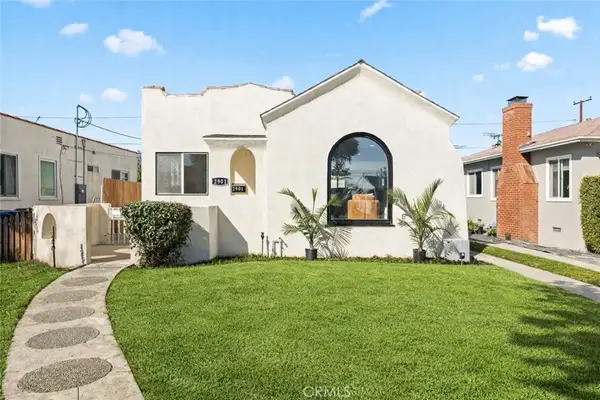 $988,000Active3 beds 2 baths1,335 sq. ft.
2901 Front St, Alhambra, CA 91803
MLS# WS26040542Listed by: COLDWELL BANKER NEW CENTURY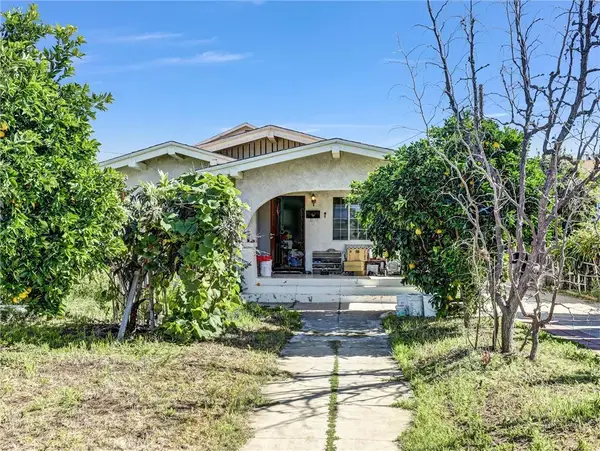 $1,200,000Pending6 beds 4 baths2,773 sq. ft.
1836 S 3rd, Alhambra, CA 91803
MLS# AR26040109Listed by: PINNACLE REAL ESTATE GROUP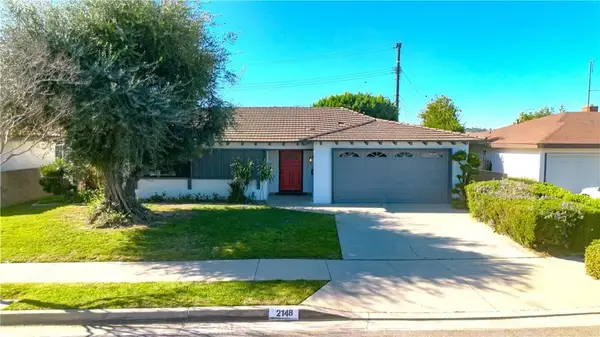 $1,388,000Active3 beds 2 baths1,751 sq. ft.
2148 Edgewood Drive, Alhambra, CA 91803
MLS# RS26037248Listed by: RE/MAX DYNASTY $949,999Active3 beds 1 baths1,301 sq. ft.
3212 Poplar, Alhambra, CA 91803
MLS# IG26037058Listed by: ONYX HOMES $850,000Pending3 beds 1 baths1,481 sq. ft.
319 Westmont Drive, Alhambra, CA 91803
MLS# OC26037403Listed by: FIRST TEAM REAL ESTATE $750,000Active2 beds 1 baths1,474 sq. ft.
611 S Marguerita Ave, Alhambra, CA 91803
MLS# WS26035088Listed by: RE/MAX ELITE REALTY $2,500,000Active3 beds 2 baths
1515 W Commonwealth Avenue, Alhambra, CA 91803
MLS# AR26030880Listed by: EXP REALTY $1,488,000Active6 beds 4 baths
2734 W Ramona Road, Alhambra, CA 91803
MLS# P1-25812Listed by: COMPASS $798,000Pending2 beds 2 baths1,371 sq. ft.
2617 Westminster, Alhambra, CA 91803
MLS# WS26030270Listed by: COMPASS $6,000,000Active40 beds 20 baths19,612 sq. ft.
1010 S Atlantic Boulevard, Alhambra, CA 91803
MLS# 26649001Listed by: REALTY INVESTMENT ADVISORS, INC.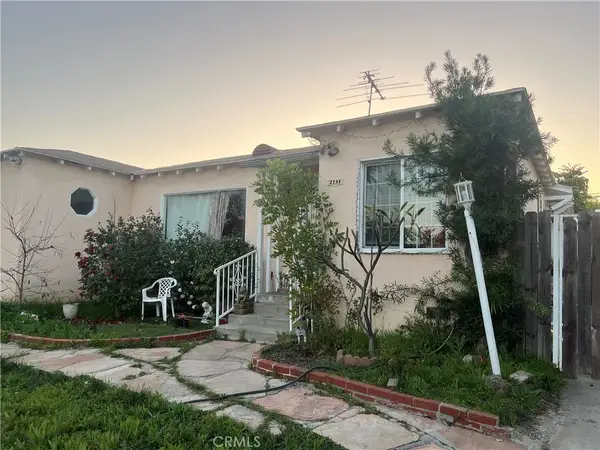 $850,000Pending2 beds 2 baths1,565 sq. ft.
2133 Westminster, Alhambra, CA 91803
MLS# CV26024707Listed by: REALTY ONE GROUP WEST $1,160,000Pending4 beds 3 baths1,616 sq. ft.
1652 La Golondrina, Alhambra, CA 91803
MLS# WS26018105Listed by: UNICAL REALTY MART $630,000Active3 beds 3 baths1,220 sq. ft.
1024 S Marengo Avenue #6, Alhambra, CA 91803
MLS# WS26017729Listed by: RE/MAX CHAMPIONS $835,000Pending4 beds 2 baths
813 W Ramona Road, Alhambra, CA 91803
MLS# WS26016200Listed by: EXP REALTY OF CALIFORNIA INC $699,000Active2 beds 3 baths1,273 sq. ft.
1097 S Marguerita Avenue #D, Alhambra, CA 91803
MLS# AR26017305Listed by: RE/MAX PREMIER PROPERTIES- Open Sun, 1 to 4pm
 $570,000Active2 beds 3 baths1,194 sq. ft.
1814 Garvey #B, Alhambra, CA 91803
MLS# CV26010221Listed by: RE/MAX TOP PRODUCERS 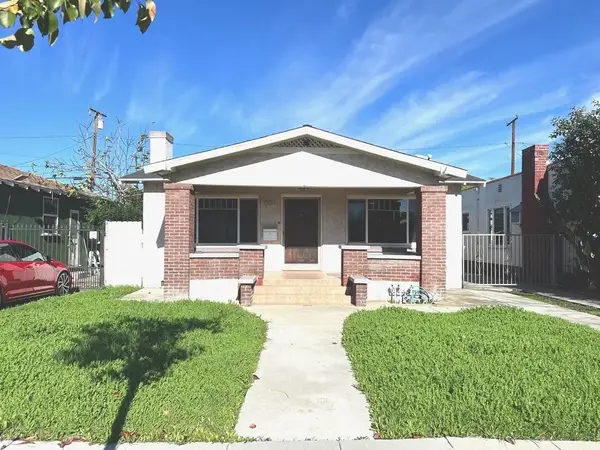 $889,000Pending3 beds 3 baths1,452 sq. ft.
2909 Front, Alhambra, CA 91803
MLS# WS26007239Listed by: KELLER WILLIAMS REALTY/PASADENA $1,180,000Active3 beds 2 baths2,174 sq. ft.
2917 W Hellman Avenue, Alhambra, CA 91803
MLS# WS26002666Listed by: PACIFIC STERLING REALTY/IRVINE $2,895,000Active7 beds 5 baths
1501 S 4th Street, Alhambra, CA 91803
MLS# WS26001274Listed by: RICHTOWN REALTY $1,580,000Pending7 beds 4 baths
2204 Orange Grove, Alhambra, CA 91803
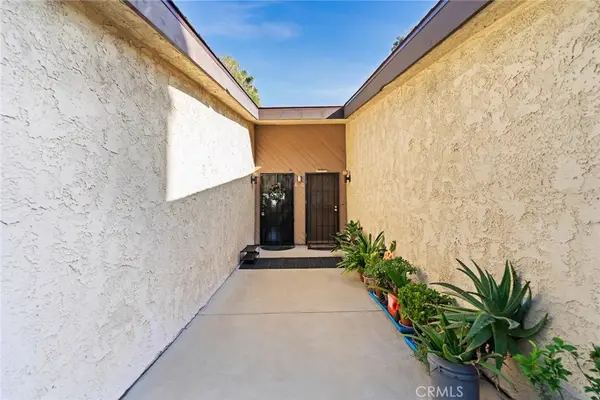
MLS# OC26000397Listed by: REAL BROKER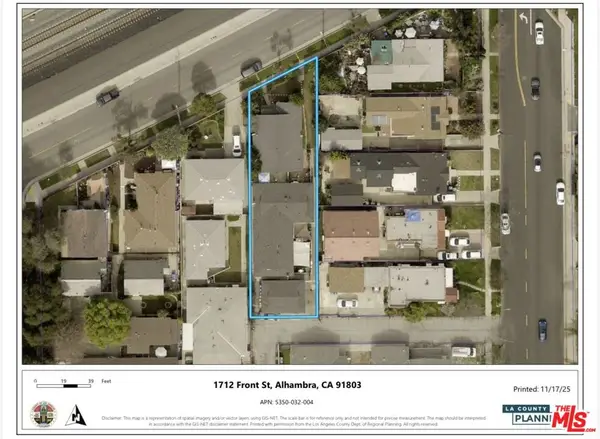 $1,350,000Active9 beds 4 baths3,332 sq. ft.
1712 Front Street, Alhambra, CA 91803
MLS# 25619697Listed by: BERKSHIRE HATHAWAY HOMESERVICES CALIFORNIA PROPERTIES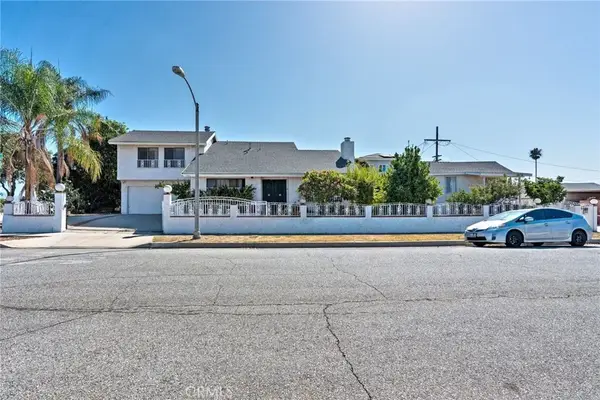 $1,399,999Active6 beds 4 baths
1100 S Ethel Avenue, Alhambra, CA 91803
MLS# AR25254459Listed by: COLDWELL BANKER NEW CENTURY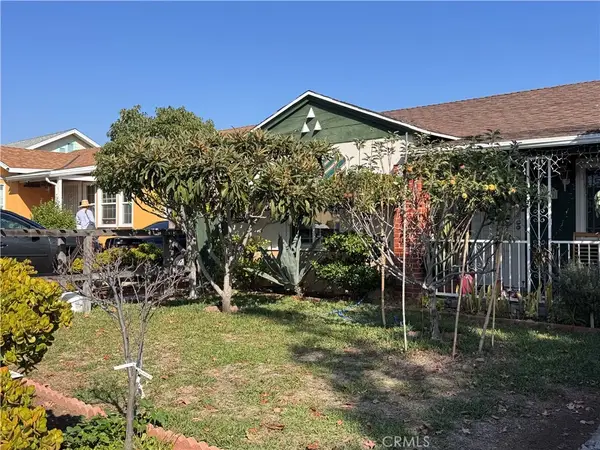 $1,280,000Active5 beds 3 baths2,122 sq. ft.
1300 S Date, Alhambra, CA 91803
MLS# OC25252145Listed by: AMERIWAY REALTY $1,799,000Active8 beds 8 baths
1342 Edgewood, Alhambra, CA 91803
MLS# CV25241240Listed by: KALEO REAL ESTATE COMPANY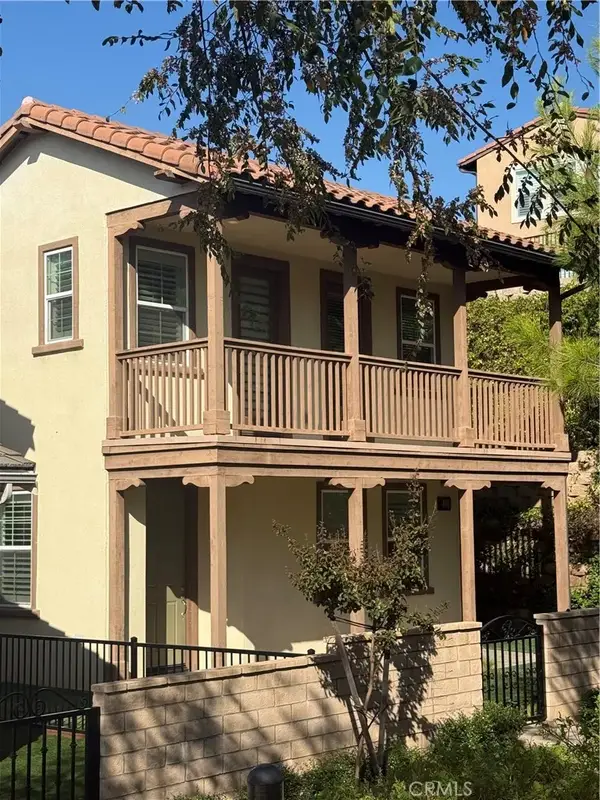 $1,298,000Active3 beds 3 baths2,029 sq. ft.
2029 Tracy Ln, Alhambra, CA 91803
MLS# TR25244566Listed by: JC PACIFIC CAPITAL INC. $959,000Active2 beds 1 baths
1213 W Ramona, Alhambra, CA 91803
MLS# WS25224544Listed by: WETRUST REALTY $65,000Active3.22 Acres
V/L McKinley RD, EastChina, MI 48054
MLS# 58050184035Listed by: J. A. BACHLER REALTOR
 $3,280,000Active5 beds 4 baths
2121 El Paseo, Alhambra, CA 91803
MLS# AR25183409Listed by: BOULDER REALTY INC $850,000Active2 beds 2 baths973 sq. ft.
601 Orange Grove Avenue, Alhambra, CA 91803
MLS# WS25159753Listed by: REAL BROKERAGE TECHNOLOGIES $699,999Pending2 beds 2 baths1,201 sq. ft.
1625 S Curtis Avenue, Alhambra, CA 91803
MLS# AR19034708Listed by: RE/MAX PREMIER PROP ARCADIA $3,500,000Active8 beds 5 baths
1518 S 4th Street, Alhambra, CA 91803
MLS# TR25073311Listed by: HOME FOCUS REALTY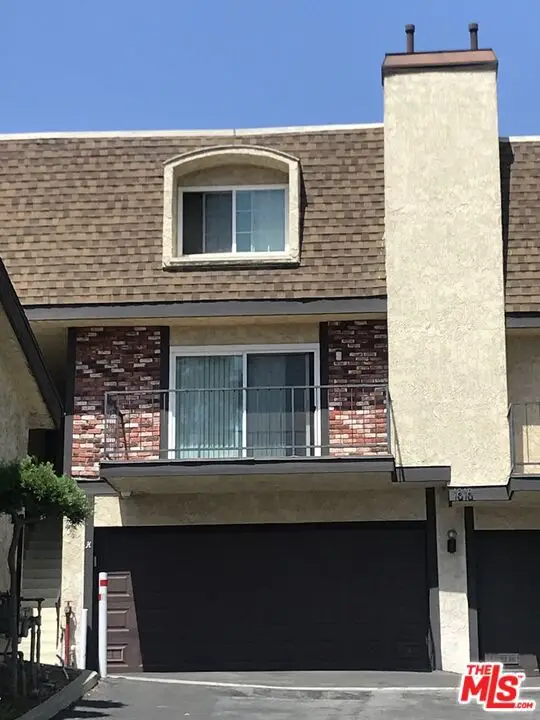 $799,000Active3 beds 3 baths1,442 sq. ft.
1818 Garvey Avenue #H, Alhambra, CA 91803
MLS# CL23339085Listed by: CITY COMMERCIAL PROPERTIES
Local realty services provided by:CENTURY 21 Affiliated, CENTURY 21 Wildwood Properties, Inc., CENTURY 21 Select Real Estate, Inc., CENTURY 21 Signature Realty
This information is deemed reliable but not guaranteed. You should rely on this information only to decide whether or not to further investigate a particular property. BEFORE MAKING ANY OTHER DECISION, YOU SHOULD PERSONALLY INVESTIGATE THE FACTS (e.g. square footage and lot size) with the assistance of an appropriate professional. You may use this information only to identify properties you may be interested in investigating further. All uses except for personal, non-commercial use in accordance with the foregoing purpose are prohibited. Redistribution or copying of this information, any photographs or video tours is strictly prohibited. This information is derived from the Internet Data Exchange (IDX) service provided by San Diego MLS®. Displayed property listings may be held by a brokerage firm other than the broker and/or agent responsible for this display. The information and any photographs and video tours and the compilation from which they are derived is protected by copyright. Compilation © 2020 San Diego MLS®, Inc.
The information being provided by California Regional MLS (Southern California) is for the consumer's personal, non-commercial use and may not be used for any purpose other than to identify prospective properties consumer may be interested in purchasing. Any information relating to real estate for sale referenced on this web site comes from the Internet Data Exchange (IDX) program of the California Regional MLS (Southern California). CENTURY 21 Select Real Estate, Inc. is not a Multiple Listing Service (MLS), nor does it offer MLS access. This website is a service of CENTURY 21 Select Real Estate, Inc., a broker participant of California Regional MLS (Southern California). This web site may reference real estate listing(s) held by a brokerage firm other than the broker and/or agent who owns this web site.
The accuracy of all information, regardless of source, including but not limited to open house information, square footages and lot sizes, is deemed reliable but not guaranteed and should be personally verified through personal inspection by and/or with the appropriate professionals. The data contained herein is copyrighted by California Regional MLS (Southern California) and is protected by all applicable copyright laws. Any unauthorized dissemination of this information is in violation of copyright laws and is strictly prohibited.
Copyright 2021 California Regional MLS (Southern California). All rights reserved.
Popular searches near 91803
Popular neighborhoods near 91803
- Annandale, Pasadena homes for sale
- Bellefontaine, Pasadena homes for sale
- Boyle Heights, Los Angeles homes for sale
- City Terrace, Los Angeles homes for sale
- East Shorb, Alhambra homes for sale
- Eastmont, Los Angeles homes for sale
- El Sereno, Los Angeles homes for sale
- Emery Park, Alhambra homes for sale
- Emery Park Hills, Alhambra homes for sale
- Granada Park, Alhambra homes for sale
- Highland Park, Los Angeles homes for sale
- Lower Arroyo, Pasadena homes for sale
- Madison Heights, Pasadena homes for sale
- Maravilla, Los Angeles homes for sale
- Marceline, Pasadena homes for sale
- Montecito Heights, Los Angeles homes for sale
- Oak Knoll, San Marino homes for sale
- Playhouse District, Pasadena homes for sale
- South Lake, Pasadena homes for sale
- The Eastside, Los Angeles homes for sale
Counties near Alhambra, 91803
Protect your home and budget from life's surprises with an Assurant Home Warranty, backed by a partner that supports you through every step of homeownership. Explore Plans.
©2026 Century 21 Real Estate LLC. All rights reserved. CENTURY 21®, the CENTURY 21 Logo and C21® are service marks owned by Century 21 Real Estate LLC. Century 21 Real Estate LLC fully supports the principles of the Fair Housing Act and the Equal Opportunity Act. Each office is independently owned and operated. Listing information is deemed reliable but not guaranteed accurate.