- Amarillo homes for sale
- Amarillo homes for sale
- Borger homes for sale
- Canadian River Breaks homes for sale
- Canyon homes for sale
- Claude homes for sale
- Farwell-Bovina homes for sale
- Fritch homes for sale
- Hale Center homes for sale
- Hereford homes for sale
- Hereford East homes for sale
- Howardwick homes for sale
- Lockney homes for sale
- Logan-Nara Visa homes for sale
- Memphis homes for sale
- Olton homes for sale
- Pampa homes for sale
- Plainview homes for sale
- Tulia homes for sale
- Turkey homes for sale
79107, TX - homes for sale
10 of 10 results displayed
- New
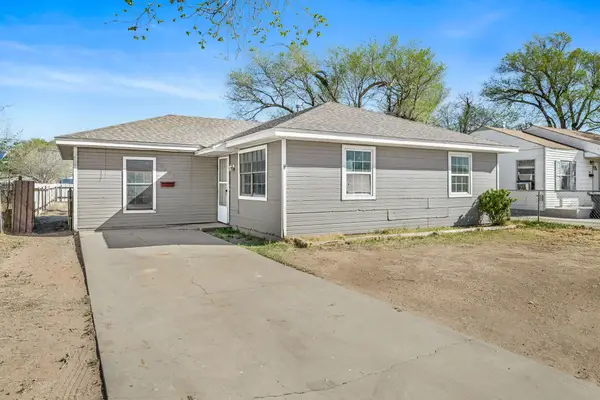 $119,950Active3 beds 2 baths1,378 sq. ft.
3605 NE 23rd Avenue, Amarillo, TX 79107
MLS# 21218406Listed by: WILLIAM WIARD 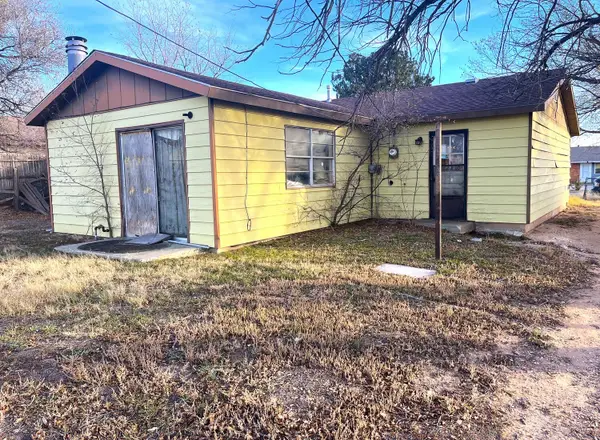 $49,999Pending4 beds 3 baths1,570 sq. ft.
1225 Pecan Street, Amarillo, TX 79107
MLS# 21137065Listed by: KAREN DAVIS PROPERTIES $135,999Active3 beds 1 baths1,006 sq. ft.
2045 14th Avenue, Amarillo, TX 79107
MLS# 7568221Listed by: 1ST TEXAS REALTY SERVICES $24,999Active0.16 Acres
1207 N Tyler Street, Amarillo, TX 79107
MLS# 92933342Listed by: 1ST TEXAS REALTY SERVICES $155,000Pending4 beds 3 baths1,012 sq. ft.
1500 Heather Street, Amarillo, TX 79107-8015
MLS# 25-8486Listed by: KELLER WILLIAMS REALTY AMARILLO $95,000Pending6 beds 2 baths1,813 sq. ft.
2415 N Hughes Street, Amarillo, TX 79107-1832
MLS# 25-7772Listed by: ROCKONE REALTY, LLC $149,900Pending3 beds 2 baths1,270 sq. ft.
2500 Bolton N Street, Amarillo, TX 79107-7312
MLS# 25-8085Listed by: LARRY BROWN, REALTORS $39,000Pending2 beds 1 baths744 sq. ft.
1113 Bluebell Street, Amarillo, TX 79107-7669
MLS# 25-6900Listed by: KELLER WILLIAMS REALTY AMARILLO $406,990Pending4 beds 3 baths2,193 sq. ft.
2418 Verano Street, Montgomery, TX 77316
MLS# 12946744Listed by: WEEKLEY PROPERTIES BEVERLY BRADLEY $412,990Active4 beds 3 baths2,354 sq. ft.
2406 Verano Street, Montgomery, TX 77316
MLS# 67512947Listed by: WEEKLEY PROPERTIES BEVERLY BRADLEY
Local realty services provided by:CENTURY 21 Judge Fite Company, CENTURY 21 Tevas,
Information provided, in part, by North Texas Real Estate Information Systems, Inc. Last Updated April 1, 2026 Listings with the NTREIS logo are listed by brokerages other than CENTURY 21 Judge Fite Company.
Copyright 2026, Houston Realtors Information Service, Inc. All information provided is deemed reliable but is not guaranteed and should be independently verified. IDX information is provided exclusively for consumers' personal, non-commercial use, it may not be used for any purpose other than to identify prospective properties consumers may be interested in purchasing, and the data is deemed reliable but is not guaranteed accurate by the MLS.
Popular searches near 79107
Popular neighborhoods near 79107
Counties near Amarillo, 79107
- Armstrong County homes for sale
- Bailey County homes for sale
- Briscoe County homes for sale
- Carson County homes for sale
- Curry County homes for sale
- Deaf Smith County homes for sale
- Donley County homes for sale
- Floyd County homes for sale
- Gray County homes for sale
- Hale County homes for sale
- Hall County homes for sale
- Hutchinson County homes for sale
- Lamb County homes for sale
- Moore County homes for sale
- Parmer County homes for sale
- Potter County homes for sale
- Quay County homes for sale
- Randall County homes for sale
- Swisher County homes for sale
- Wheeler County homes for sale
Protect your home and budget from life's surprises with an Assurant Home Warranty, backed by a partner that supports you through every step of homeownership. Explore Plans.
©2026 Century 21 Real Estate LLC. All rights reserved. CENTURY 21®, the CENTURY 21 Logo and C21® are service marks owned by Century 21 Real Estate LLC. Century 21 Real Estate LLC fully supports the principles of the Fair Housing Act and the Equal Opportunity Act. Each office is independently owned and operated. Listing information is deemed reliable but not guaranteed accurate.