- Adair Park, Atlanta homes for sale
- Atlanta University Center, Atlanta homes for sale
- Bush Mountain, Atlanta homes for sale
- Castleberry Hill, Atlanta homes for sale
- Downtown Atlanta, Atlanta homes for sale
- English Avenue, Atlanta homes for sale
- Hunter Hills, Atlanta homes for sale
- Marietta Street Artery, Atlanta homes for sale
- Mechanicsville, Atlanta homes for sale
- Mozley Park, Atlanta homes for sale
- Oakland City, Atlanta homes for sale
- Penelope Neighbors, Atlanta homes for sale
- Pittsburgh, Atlanta homes for sale
- Vine City, Atlanta homes for sale
- Washington Park, Atlanta homes for sale
- West End, Atlanta homes for sale
- West Lake, Atlanta homes for sale
- Westside, Atlanta homes for sale
- Westview, Atlanta homes for sale
- Westwood Terrace, Atlanta homes for sale
Ashview Heights, Atlanta, GA - homes for sale
27 of 27 results displayed
- New
 $219,000Active4 beds 3 baths
978 Parsons Street Sw, Atlanta, GA 30314
MLS# 10719827Listed by: Atlanta Communities
 $619,900Active4 beds 4 baths2,124 sq. ft.
969 Parsons Street Sw, Atlanta, GA 30314
MLS# 10712223Listed by: Beycome Brokerage Realty LLC $539,000Active4 beds 3 baths1,978 sq. ft.
987 Fair Street Sw, Atlanta, GA 30314
MLS# 7734336Listed by: KELLER WMS RE ATL MIDTOWN $189,500Active2 beds 1 baths800 sq. ft.
154 Lawton Street Sw, Atlanta, GA 30314
MLS# 7732791Listed by: KELLER WILLIAMS REALTY WEST ATLANTA $289,500Active2 beds 1 baths800 sq. ft.
154 Lawton Street Sw, Atlanta, GA 30314
MLS# 10707546Listed by: Keller Williams West Atlanta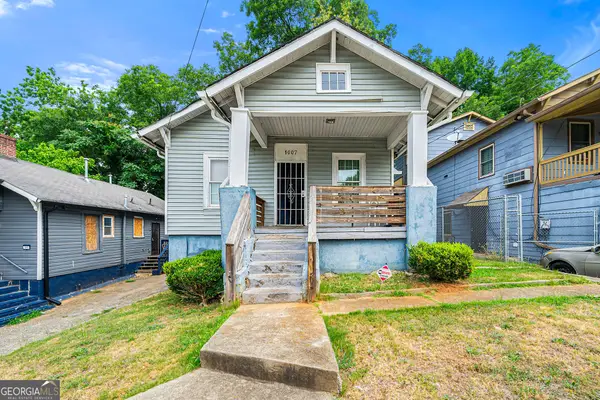 $270,000Active5 beds 3 baths1,193 sq. ft.
1007 Fair Street Sw, Atlanta, GA 30314
MLS# 10703136Listed by: Sell Your Home Services LLC $350,000Active4 beds 2 baths1,392 sq. ft.
1181 Westview Drive Sw, Atlanta, GA 30310
MLS# 7721908Listed by: ENGEL & VOLKERS ATLANTA $79,900Active0.12 Acres
1131 Fair Street Sw, Atlanta, GA 30314
MLS# 10696512Listed by: Realty Associates of Atlanta $475,000Active3 beds 3 baths1,728 sq. ft.
1012 Parsons Street Sw, Atlanta, GA 30314
MLS# 10696038Listed by: Keller Knapp, Inc $559,000Active4 beds 4 baths2,500 sq. ft.
60 Newcastle Street Sw, Atlanta, GA 30314
MLS# 7717901Listed by: KELLER WILLIAMS REALTY INTOWN ATL $599,990Active-- beds -- baths
969 Palmetto Avenue Sw, Atlanta, GA 30314
MLS# 7715908Listed by: FLEUR DE LEE REALTY, LLC $159,900Active2 beds 2 baths882 sq. ft.
1070 Camilla Street Sw, Atlanta, GA 30314
MLS# 7716313Listed by: KELLER WILLIAMS REALTY ATL PART $285,000Active4 beds 4 baths1,500 sq. ft.
1128 Fair Street Sw, Atlanta, GA 30314
MLS# 7712075Listed by: KELLER WILLIAMS REALTY ATL PARTNERS $575,000Active4 beds 4 baths2,520 sq. ft.
992 Beckwith Street Sw, Atlanta, GA 30314
MLS# 7709467Listed by: KELLER WILLIAMS BUCKHEAD $208,000Active2 beds 2 baths1,044 sq. ft.
225 1st Street Sw, Atlanta, GA 30314
MLS# 7703733Listed by: KELLER WILLIAMS REALTY ATL PERIMETER $212,000Active0.1 Acres
953 Fair Street Sw, Atlanta, GA 30314
MLS# 10668091Listed by: The Thomas Agency of Georgia $340,000Active3 beds 2 baths1,250 sq. ft.
1173 Fenwood Street Sw, Atlanta, GA 30314
MLS# 7690089Listed by: EXP REALTY, LLC. $410,000Active7 beds 2 baths1,152 sq. ft.
1033 Palmetto Ave Sw, Atlanta, GA 30314
MLS# 7687134Listed by: SIMPLY HOMES ATL, LLC $234,900Active0.16 Acres
67 Joseph E Lowery Boulevard, Atlanta, GA 30314
MLS# 7684359Listed by: ATLANTA COMMUNITIES $300,000Active-- beds -- baths
253 Lawton Street Sw, Atlanta, GA 30314
MLS# 10618596Listed by: Miller Realty LLC $169,000Active0.14 Acres
1053 M L King Jr Drive Nw, Atlanta, GA 30314
MLS# 10546989Listed by: Keller Williams Atlanta Perimeter $399,000Active3 beds 2 baths1,305 sq. ft.
973 Parsons Street Sw, Atlanta, GA 30314
MLS# 10711401Listed by: Keller Williams Realty $175,000Active2 beds 1 baths5 sq. ft.
253 1st Street Sw, Atlanta, GA 30314
MLS# 10302799Listed by: Bingham Realty $185,000Active3 beds 2 baths1,318 sq. ft.
961 Fair Street Sw, Atlanta, GA 30314
MLS# 7319467Listed by: LANTERN REAL ESTATE GROUP $290,000Active3 beds 2 baths1,392 sq. ft.
1181 Westview Drive Sw, Atlanta, GA 30310
MLS# 7302179Listed by: RE/MAX CENTER $425,000Active3 beds 2 baths1,885 sq. ft.
1003 Parsons Street Sw, Atlanta, GA 30314
MLS# 7277369Listed by: SOUTHERN CLASSIC REALTORS $322,000Active3 beds 2 baths1,728 sq. ft.
135 Lawton Street Sw, Atlanta, GA 30314
MLS# 7269414Listed by: COMPASS
Local realty services provided by:CENTURY 21 North East, CENTURY 21 Novus
2026 Georgia MLS. All rights reserved. Information Deem Reliable But Not Guaranteed March 29, 2026
Popular neighborhoods near Ashview Heights, Atlanta, GA
Zip codes near Ashview Heights, Atlanta, GA
- 30303 homes for sale
- 30305 homes for sale
- 30306 homes for sale
- 30307 homes for sale
- 30308 homes for sale
- 30309 homes for sale
- 30310 homes for sale
- 30311 homes for sale
- 30312 homes for sale
- 30313 homes for sale
- 30314 homes for sale
- 30315 homes for sale
- 30316 homes for sale
- 30317 homes for sale
- 30318 homes for sale
- 30324 homes for sale
- 30332 homes for sale
- 30344 homes for sale
- 30354 homes for sale
- 30363 homes for sale
Counties near Ashview Heights, Atlanta, GA
- Barrow County homes for sale
- Bartow County homes for sale
- Butts County homes for sale
- Carroll County homes for sale
- Cherokee County homes for sale
- Clayton County homes for sale
- Cobb County homes for sale
- Coweta County homes for sale
- DeKalb County homes for sale
- Douglas County homes for sale
- Fayette County homes for sale
- Forsyth County homes for sale
- Fulton County homes for sale
- Gwinnett County homes for sale
- Henry County homes for sale
- Newton County homes for sale
- Paulding County homes for sale
- Rockdale County homes for sale
- Spalding County homes for sale
- Walton County homes for sale
Protect your home and budget from life's surprises with an Assurant Home Warranty, backed by a partner that supports you through every step of homeownership. Explore Plans.
©2026 Century 21 Real Estate LLC. All rights reserved. CENTURY 21®, the CENTURY 21 Logo and C21® are service marks owned by Century 21 Real Estate LLC. Century 21 Real Estate LLC fully supports the principles of the Fair Housing Act and the Equal Opportunity Act. Each office is independently owned and operated. Listing information is deemed reliable but not guaranteed accurate.