- Christie Ranch, Frisco homes for sale
- Eldorado Estates, Little Elm homes for sale
- Emerald Sound at Lake Lewisville, Little Elm homes for sale
- Frisco Ranch, Little Elm homes for sale
- Glen Cove, Little Elm homes for sale
- Grayhawk, Frisco homes for sale
- Lakewood Estates, Little Elm homes for sale
- Marina Vista Estates, Little Elm homes for sale
- Newman Village, Frisco homes for sale
- Northridge Estates, Frisco homes for sale
- Paloma Creek, Little Elm homes for sale
- Providence Village, Aubrey homes for sale
- Savannah, Aubrey homes for sale
- Stardust Ranch, Little Elm homes for sale
- Sunset Pointe, Little Elm homes for sale
- Union Park, Little Elm homes for sale
- Villages of Woodlake, Little Elm homes for sale
- Wildridge, Little Elm homes for sale
- Windsong Ranch, Prosper homes for sale
- Wynfield Farms, Little Elm homes for sale
Aubrey, TX - homes for sale
21 of 21 results displayed
- Open Tue, 11am to 5pmNew
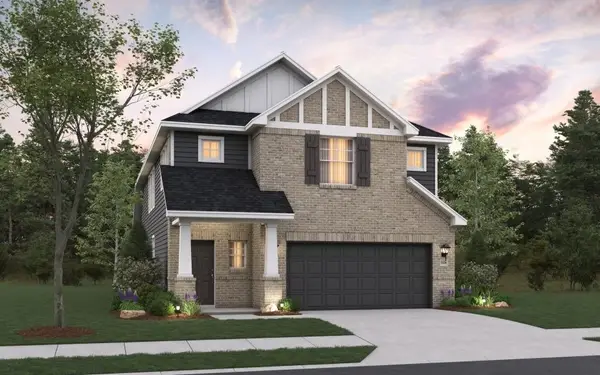
 $429,990Active4 beds 3 baths2,186 sq. ft.
8716 Preakness Street, Aubrey, TX 76227
MLS# 21221590Listed by: HISTORYMAKER HOMES - Open Tue, 11am to 5pmNew
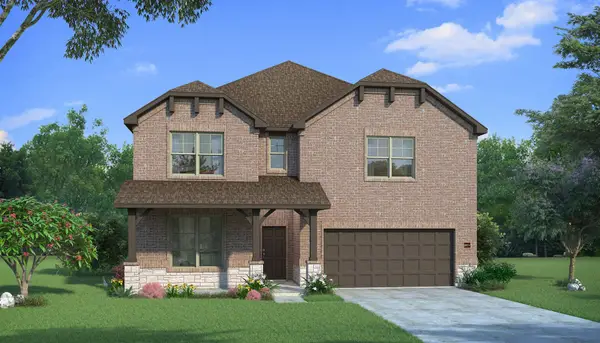
 $424,990Active4 beds 4 baths2,105 sq. ft.
8720 Preakness Street, Aubrey, TX 76227
MLS# 21221617Listed by: HISTORYMAKER HOMES - Open Tue, 11am to 5pmNew
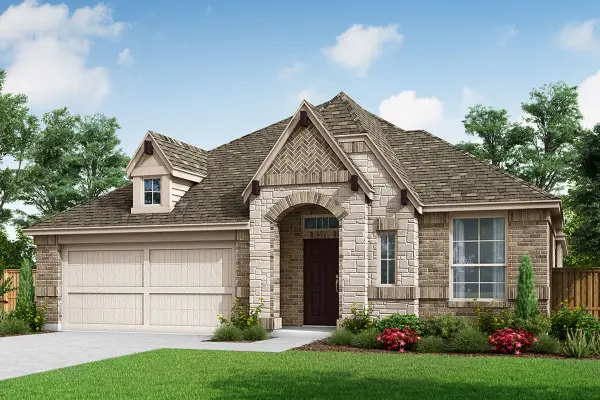
 $489,990Active4 beds 4 baths2,887 sq. ft.
8809 Preakness Street, Aubrey, TX 76227
MLS# 21221635Listed by: HISTORYMAKER HOMES - Open Sun, 10am to 12pmNew
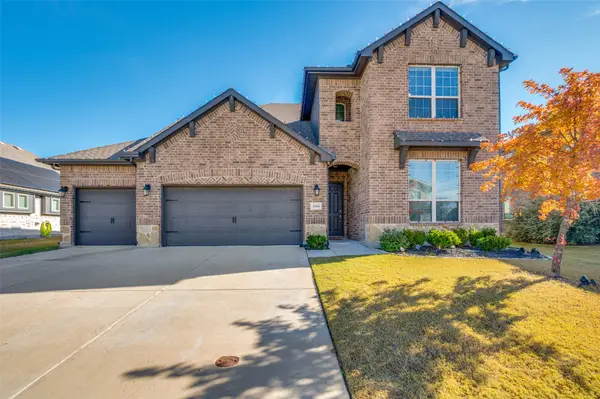
 $439,900Active3 beds 2 baths2,148 sq. ft.
1612 Millican Lane, Aubrey, TX 76227
MLS# 21175475Listed by: KELLER WILLIAMS PROSPER CELINA - Open Sat, 1 to 5pmNew
 $323,999Active4 beds 2 baths1,850 sq. ft.
3303 Brady Starr Drive, Aubrey, TX 76227
MLS# 21212938Listed by: CENTURY 21 JUDGE FITE CO. - Open Sat, 1 to 3pm
 $325,000Active3 beds 2 baths1,634 sq. ft.
10929 Gold Pan Trail, Aubrey, TX 76227
MLS# 21206017Listed by: EXP REALTY LLC - Open Tue, 9am to 7pm
 $328,000Active3 beds 2 baths1,684 sq. ft.
1308 Morning Ridge Trail, Aubrey, TX 76227
MLS# 21195309Listed by: OPENDOOR BROKERAGE, LLC - Open Tue, 10am to 6pm
 $374,990Active3 beds 3 baths2,229 sq. ft.
1716 Edgeway Drive, Aubrey, TX 76227
MLS# 21187018Listed by: HISTORYMAKER HOMES - Open Tue, 10am to 6pm
 $469,990Active4 beds 4 baths2,966 sq. ft.
1412 Elle Lane, Aubrey, TX 76227
MLS# 21186978Listed by: HISTORYMAKER HOMES - Open Sat, 12 to 5pm
 $542,272Active5 beds 4 baths3,209 sq. ft.
4204 Palomino Road, Aubrey, TX 76227
MLS# 21155323Listed by: DAVID M. WEEKLEY - Open Tue, 11am to 5pm
 $429,970Active4 beds 3 baths2,393 sq. ft.
2013 Hickory Lane, Aubrey, TX 76227
MLS# 21154390Listed by: RANDOL J. VICK, BROKER - Open Sat, 12 to 5pm
 $539,990Active4 beds 3 baths3,328 sq. ft.
4416 Silver Spur Court, Aubrey, TX 76227
MLS# 21148554Listed by: DAVID M. WEEKLEY - Open Tue, 10am to 6pm
 $652,379Active4 beds 5 baths3,458 sq. ft.
1412 Buttercup Avenue, Aubrey, TX 76227
MLS# 21133424Listed by: HOMESUSA.COM - Open Sat, 2 to 4pm
 $450,000Active4 beds 3 baths2,698 sq. ft.
2604 Upland Trail Lane, Aubrey, TX 76227
MLS# 21131416Listed by: PARAGON, REALTORS - Open Sat, 12 to 2pm
 $549,990Active4 beds 4 baths3,115 sq. ft.
5004 Clotho Road, Aubrey, TX 76227
MLS# 21120332Listed by: ESCAPE REALTY - Open Sun, 2 to 4pm
 $529,900Active4 beds 4 baths3,678 sq. ft.
1609 Quentin Drive, Aubrey, TX 76227
MLS# 21104230Listed by: KELLER WILLIAMS PROSPER CELINA - Open Tue, 12 to 2pm
 $384,990Active4 beds 3 baths2,426 sq. ft.
7624 Kingfisher Road, Aubrey, TX 76227
MLS# 21099111Listed by: HOMESUSA.COM - Open Tue, 12 to 2pm
 $349,990Active3 beds 2 baths1,965 sq. ft.
7620 Kingfisher Road, Aubrey, TX 76227
MLS# 21099123Listed by: HOMESUSA.COM - Open Sat, 2 to 5pm
 $649,995Active5 beds 4 baths3,541 sq. ft.
728 Bridle Path, Aubrey, TX 76227
MLS# 21031849Listed by: HOMESUSA.COM - Open Sat, 12 to 4pm
 $424,990Active4 beds 3 baths2,721 sq. ft.
1520 Edgeway Drive, Aubrey, TX 76227
MLS# 20947493Listed by: HISTORYMAKER HOMES - Open Sat, 12 to 4pm
 $300,231Active3 beds 2 baths1,498 sq. ft.
1641 Meadow Crest Drive, Aubrey, TX 76227
MLS# 20920223Listed by: IMP REALTY
Local realty services provided by:CENTURY 21 Gold Coat Realtors
Information provided, in part, by North Texas Real Estate Information Systems, Inc. Last Updated March 29, 2026 Listings with the NTREIS logo are listed by brokerages other than CENTURY 21 Gold Coat Realtors.
Neighborhoods near Aubrey, TX
Zip codes near Aubrey, TX
- 75009 homes for sale
- 75024 homes for sale
- 75033 homes for sale
- 75034 homes for sale
- 75035 homes for sale
- 75036 homes for sale
- 75056 homes for sale
- 75065 homes for sale
- 75068 homes for sale
- 75070 homes for sale
- 75071 homes for sale
- 75072 homes for sale
- 75078 homes for sale
- 76201 homes for sale
- 76205 homes for sale
- 76208 homes for sale
- 76209 homes for sale
- 76210 homes for sale
- 76227 homes for sale
- 76258 homes for sale
Popular searches near Aubrey, TX
- Celina homes for sale
- Corinth homes for sale
- Cross Roads homes for sale
- Frisco homes for sale
- Hackberry homes for sale
- Krugerville homes for sale
- Lake Dallas homes for sale
- Lakewood Village homes for sale
- Lewisville-Flower Mound homes for sale
- Little Elm homes for sale
- Oak Point homes for sale
- Paloma Creek homes for sale
- Paloma Creek South homes for sale
- Pilot Point homes for sale
- Pilot Point-Aubrey homes for sale
- Prosper homes for sale
- Providence Village homes for sale
- Savannah homes for sale
- Shady Shores homes for sale
- The Colony homes for sale
Protect your home and budget from life's surprises with an Assurant Home Warranty, backed by a partner that supports you through every step of homeownership. Explore Plans.
©2026 Century 21 Real Estate LLC. All rights reserved. CENTURY 21®, the CENTURY 21 Logo and C21® are service marks owned by Century 21 Real Estate LLC. Century 21 Real Estate LLC fully supports the principles of the Fair Housing Act and the Equal Opportunity Act. Each office is independently owned and operated. Listing information is deemed reliable but not guaranteed accurate.