- Antelope Park, Lincoln homes for sale
- Arnold Heights, Lincoln homes for sale
- Belmont, Lincoln homes for sale
- Capitol Beach, Lincoln homes for sale
- Capitol View, Lincoln homes for sale
- Clinton, Lincoln homes for sale
- Country Club, Lincoln homes for sale
- Downtown Lincoln, Lincoln homes for sale
- Everett, Lincoln homes for sale
- Hawley, Lincoln homes for sale
- Highlands, Lincoln homes for sale
- Indian Village, Lincoln homes for sale
- Irvingdale, Lincoln homes for sale
- Near South, Lincoln homes for sale
- North Bottoms, Lincoln homes for sale
- Oak Hills, Lincoln homes for sale
- South Salt Creek, Lincoln homes for sale
- West A, Lincoln homes for sale
- Woods Park, Lincoln homes for sale
- Yankee Hill, Lincoln homes for sale
Aurora, NE - homes for sale
3 of 3 results displayed
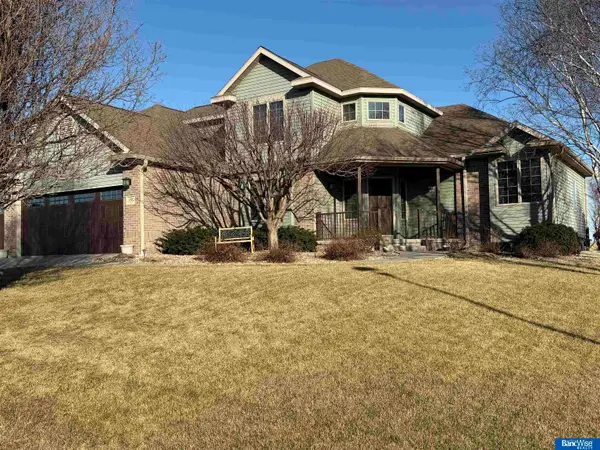 $579,000Pending6 beds 4 baths2,914 sq. ft.
2002 Tipperary Road, Aurora, NE 68818
MLS# 22602392Listed by: BANCWISE REALTY $129,500Pending2 beds 1 baths1,020 sq. ft.
1113 6th Street, Aurora, NE 68818
MLS# 22532284Listed by: EXIT REALTY PROFESSIONALS $227,000Active3 beds 2 baths1,568 sq. ft.
709 N Street, Aurora, NE 68818
MLS# 22531514Listed by: BANCWISE REALTY
Local realty services provided by:CENTURY 21 Century Real Estate
Neighborhoods near Aurora, NE
Zip codes near Aurora, NE
- 68322 homes for sale
- 68343 homes for sale
- 68354 homes for sale
- 68359 homes for sale
- 68361 homes for sale
- 68371 homes for sale
- 68401 homes for sale
- 68434 homes for sale
- 68467 homes for sale
- 68634 homes for sale
- 68640 homes for sale
- 68651 homes for sale
- 68662 homes for sale
- 68663 homes for sale
- 68666 homes for sale
- 68818 homes for sale
- 68827 homes for sale
- 68843 homes for sale
- 68854 homes for sale
- 68979 homes for sale
Popular searches near Aurora, NE
- Chapman Township homes for sale
- Chapman homes for sale
- Exeter-Fairmont Consolidated Township homes for sale
- Fairmont homes for sale
- Geneva homes for sale
- Geneva Township homes for sale
- Grand Island homes for sale
- Hampton homes for sale
- Hays homes for sale
- Henderson homes for sale
- Henderson Precinct homes for sale
- Marquette homes for sale
- McCool Junction homes for sale
- Osceola homes for sale
- South Osceola homes for sale
- Stanton homes for sale
- Stromsburg homes for sale
- Sutton Township homes for sale
- Sutton homes for sale
- York homes for sale
Protect your home and budget from life's surprises with an Assurant Home Warranty, backed by a partner that supports you through every step of homeownership. Explore Plans.
©2026 Century 21 Real Estate LLC. All rights reserved. CENTURY 21®, the CENTURY 21 Logo and C21® are service marks owned by Century 21 Real Estate LLC. Century 21 Real Estate LLC fully supports the principles of the Fair Housing Act and the Equal Opportunity Act. Each office is independently owned and operated. Listing information is deemed reliable but not guaranteed accurate.