- Albany Park, Chicago homes for sale
- Bucktown, Chicago homes for sale
- Hermosa, Chicago homes for sale
- Humboldt Park, Chicago homes for sale
- Irving Park, Chicago homes for sale
- Kosciuszko Park, Chicago homes for sale
- Lake View, Chicago homes for sale
- Lincoln Square, Chicago homes for sale
- Little Cassubia, Chicago homes for sale
- Logan Square, Chicago homes for sale
- North Center, Chicago homes for sale
- North Side, Chicago homes for sale
- Old Irving Park, Chicago homes for sale
- Palmer Square, Chicago homes for sale
- Ravenswood, Chicago homes for sale
- Ravenswood Gardens, Chicago homes for sale
- Roscoe Village, Chicago homes for sale
- Southport Corridor, Chicago homes for sale
- Wicker Park, Chicago homes for sale
- Wrigleyville, Chicago homes for sale
Avondale, Chicago, IL - homes for sale
77 of 77 results displayed
- New
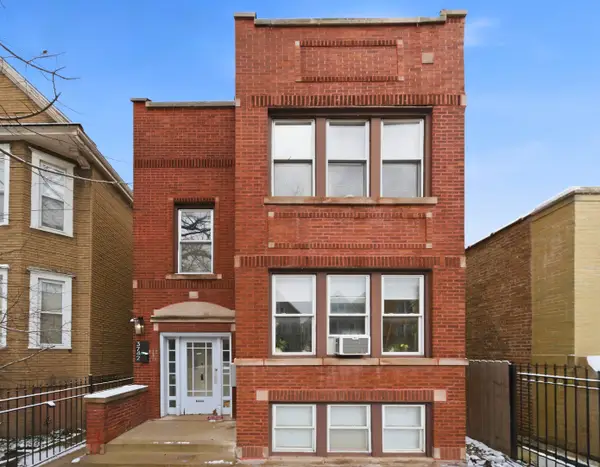
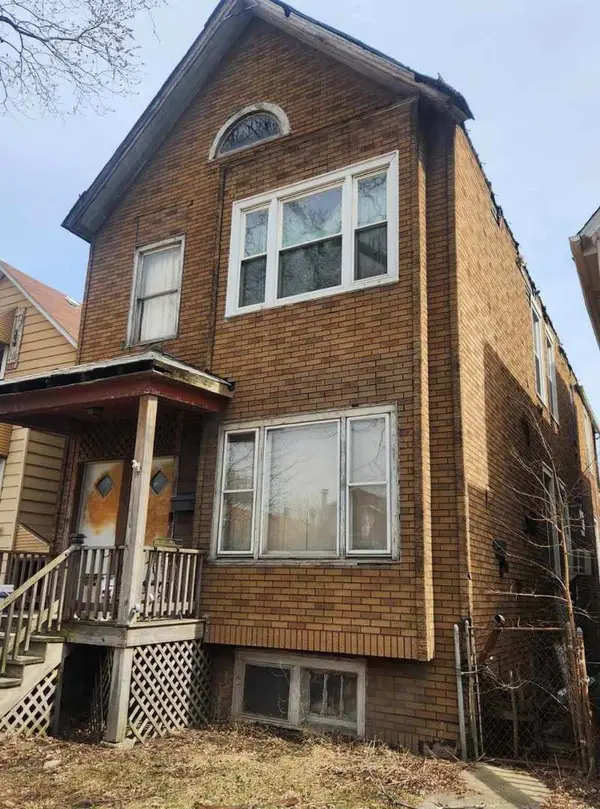 $379,900Active6 beds 2 baths
3009 N Whipple Street, Chicago, IL 60618
MLS# 12581388Listed by: REALTY EXECUTIVES PREMIER ILLINOIS
- Open Fri, 4:30 to 6:30pmNew
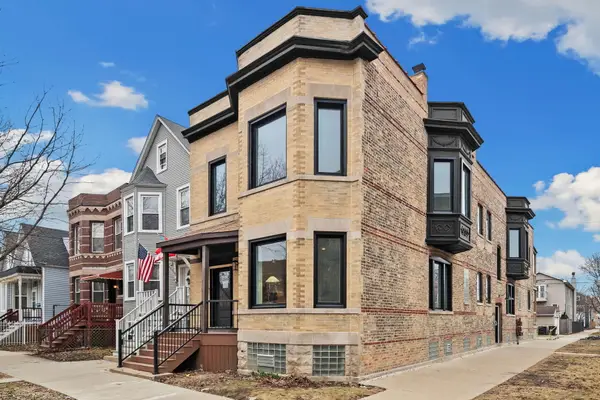
 $479,000Active3 beds 1 baths
3354 N Whipple Street #2F, Chicago, IL 60618
MLS# 12588984Listed by: CROSS STREET REAL ESTATE - Open Sat, 2 to 4pmNew
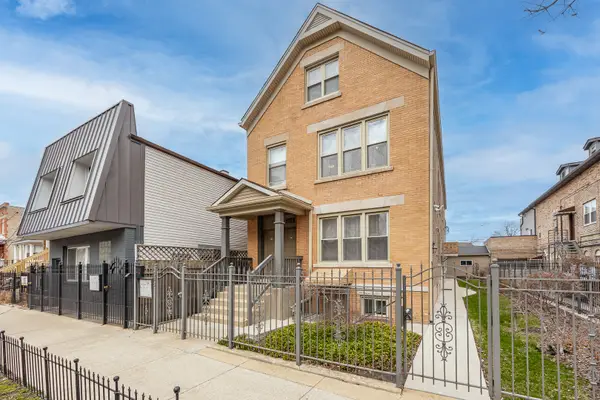 $1,490,000Active9 beds 8 baths
3648 W George Street, Chicago, IL 60618
MLS# 12601792Listed by: COLDWELL BANKER REALTY - Open Fri, 4:30 to 6:30pmNew
 $429,000Active2 beds 1 baths
3354 N Whipple Street #2R, Chicago, IL 60618
MLS# 12586625Listed by: CROSS STREET REAL ESTATE - Open Sat, 11am to 1pmNew
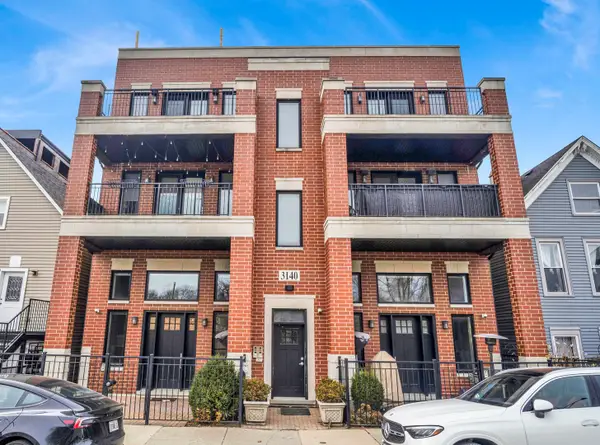 $675,000Active3 beds 2 baths1,500 sq. ft.
3140 N Elston Avenue #3S, Chicago, IL 60618
MLS# 12597843Listed by: @PROPERTIES CHRISTIE'S INTERNATIONAL REAL ESTATE - New
 $630,000Active6 beds 3 baths
3742 W Diversey Avenue, Chicago, IL 60647
MLS# 12599531Listed by: ESSEX 312, LLC - Open Sun, 11am to 2pmNew
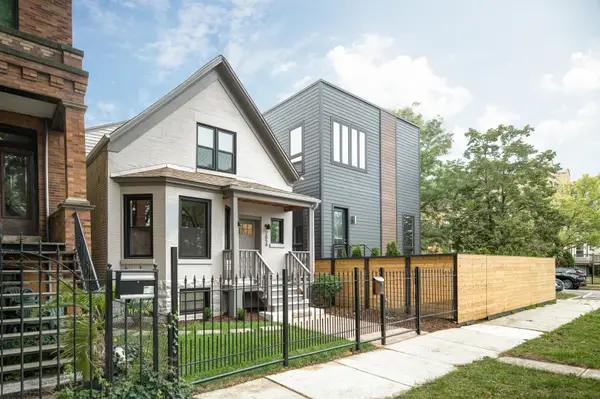 $1,150,000Active4 beds 4 baths3,050 sq. ft.
2854 N Francisco Avenue, Chicago, IL 60618
MLS# 12599333Listed by: NEW ERA CHICAGO, LLC  $350,000Pending5 beds 3 baths
3011 N Kimball Avenue, Chicago, IL 60618
MLS# 12598752Listed by: NET REALTY CORP- Open Sat, 1 to 3pmNew
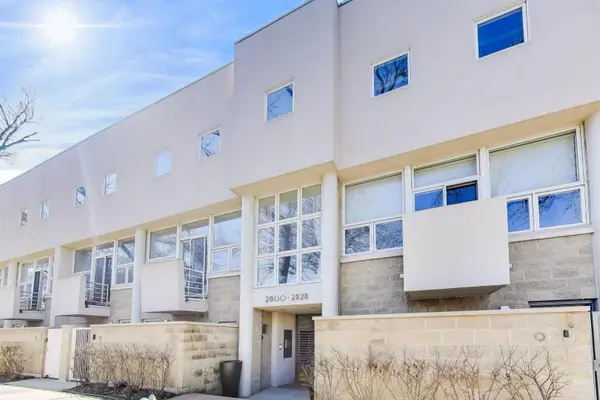 $675,000Active4 beds 3 baths3,009 sq. ft.
2826 N Talman Avenue #A, Chicago, IL 60618
MLS# 12594444Listed by: @PROPERTIES CHRISTIE'S INTERNATIONAL REAL ESTATE  $930,000Pending6 beds 5 baths
3432 W Melrose Street, Chicago, IL 60618
MLS# 12553773Listed by: @PROPERTIES CHRISTIE'S INTERNATIONAL REAL ESTATE $609,999Pending6 beds 3 baths
Address Withheld By Seller, Chicago, IL 60618
MLS# 12594107Listed by: GOLDEN CITY REALTY, INC.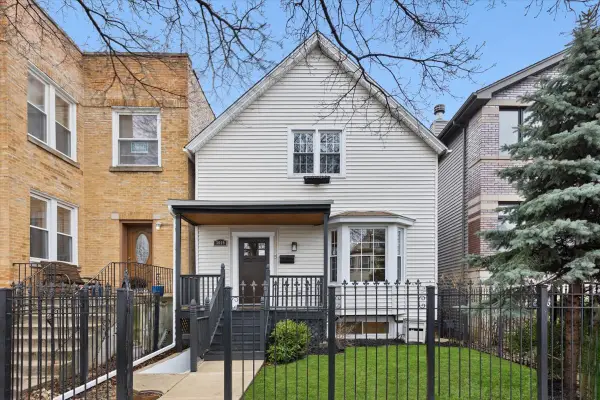 $830,000Pending6 beds 3 baths
3059 N Gresham Avenue, Chicago, IL 60618
MLS# 12534632Listed by: @PROPERTIES CHRISTIE'S INTERNATIONAL REAL ESTATE- New
 $739,000Active4 beds 3 baths
3039 N Haussen Court, Chicago, IL 60618
MLS# 12592619Listed by: ARHOME REALTY - New
 $375,000Active2 beds 2 baths1,102 sq. ft.
4131 W Belmont Avenue #402, Chicago, IL 60641
MLS# 12585599Listed by: COLDWELL BANKER REALTY  $154,900Active-- beds 1 baths500 sq. ft.
3149 W Wellington Avenue #1, Chicago, IL 60618
MLS# 12592661Listed by: DEVON REALTY, INC. $550,000Pending4 beds 3 baths
3411 N Springfield Avenue, Chicago, IL 60618
MLS# 12574090Listed by: EXP REALTY $415,000Pending3 beds 2 baths2,220 sq. ft.
3358 N Monticello Avenue #3E, Chicago, IL 60618
MLS# 12591012Listed by: BAIRD & WARNER $799,999Active6 beds 3 baths
3975 W Barry Avenue, Chicago, IL 60618
MLS# 12591163Listed by: FULTON GRACE REALTY $525,000Pending3 beds 3 baths1,650 sq. ft.
3044 W Roscoe Street #2E, Chicago, IL 60618
MLS# 12583966Listed by: COMPASS $749,000Pending3 beds 3 baths
2862 N Woodard Street, Chicago, IL 60618
MLS# 12586902Listed by: NORTH CLYBOURN GROUP, INC. $445,000Pending2 beds 1 baths
3354 N Whipple Street #1F, Chicago, IL 60618
MLS# 12586618Listed by: CROSS STREET REAL ESTATE- Open Fri, 4:30 to 6:30pm
 $415,000Active2 beds 1 baths
3354 N Whipple Street #1R, Chicago, IL 60618
MLS# 12584649Listed by: CROSS STREET REAL ESTATE  $774,900Pending3 beds 4 baths2,400 sq. ft.
3024 W Newport Avenue, Chicago, IL 60618
MLS# 12590314Listed by: BAIRD & WARNER $624,500Pending5 beds 3 baths
3355 N Hamlin Avenue, Chicago, IL 60618
MLS# 12587940Listed by: RE/MAX 10 LINCOLN PARK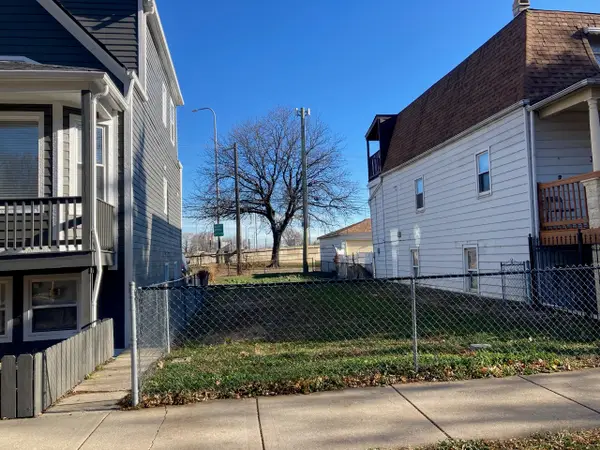 $299,000Active0.06 Acres
3329 N Drake Avenue, Chicago, IL 60618
MLS# 12590144Listed by: COLDWELL BANKER REALTY $850,000Active5 beds 4 baths
3036 N Kedzie Avenue, Chicago, IL 60618
MLS# 12588357Listed by: REDFIN CORPORATION $640,000Pending4 beds 3 baths
3051 N Drake Avenue, Chicago, IL 60618
MLS# 12585432Listed by: @PROPERTIES CHRISTIE'S INTERNATIONAL REAL ESTATE $539,900Pending3 beds 2 baths1,500 sq. ft.
3035 W Belmont Avenue #2E, Chicago, IL 60618
MLS# 12581422Listed by: COMPASS $910,000Pending4 beds 4 baths2,913 sq. ft.
3324 N Albany Avenue, Chicago, IL 60618
MLS# 12577593Listed by: EXP REALTY $785,000Active6 beds 3 baths
2958 W Nelson Street, Chicago, IL 60618
MLS# 12584229Listed by: HOMESMART CONNECT LLC $975,000Pending4 beds 4 baths
2852 W Fletcher Street, Chicago, IL 60618
MLS# 12580952Listed by: COMPASS $249,999Pending2 beds 1 baths
3522 N Lawndale Avenue #2, Chicago, IL 60618
MLS# 12582394Listed by: KELLER WILLIAMS ONECHICAGO $1,199,000Pending4 beds 4 baths3,600 sq. ft.
3137 N Spaulding Avenue, Chicago, IL 60618
MLS# 12583777Listed by: REDFIN CORPORATION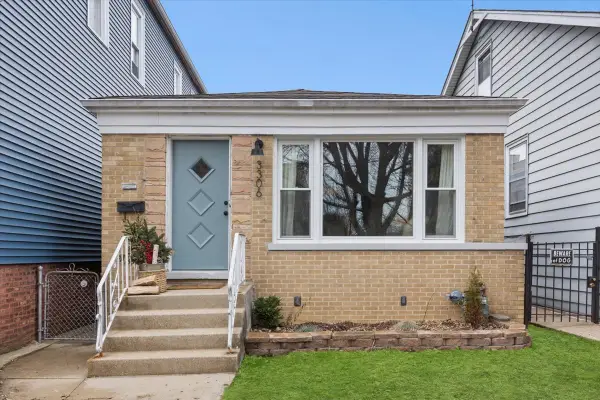 $530,000Pending2 beds 1 baths
3306 N Lawndale Avenue, Chicago, IL 60618
MLS# 12550978Listed by: @PROPERTIES CHRISTIE'S INTERNATIONAL REAL ESTATE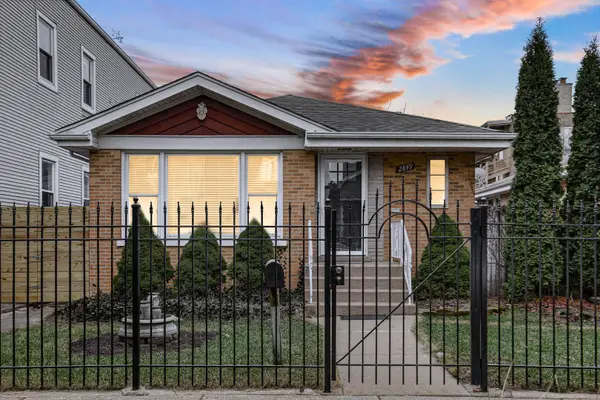 $665,000Pending3 beds 2 baths1,200 sq. ft.
2849 W Fletcher Street, Chicago, IL 60618
MLS# 12578944Listed by: CITY GATE REAL ESTATE INC. $699,000Pending6 beds 3 baths
4055 W Nelson Street, Chicago, IL 60641
MLS# 12580594Listed by: CHICAGOLAND BROKERS, INC.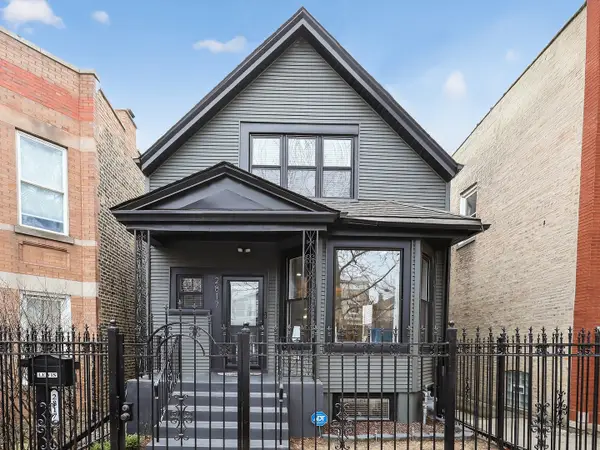 $950,000Pending5 beds 4 baths2,815 sq. ft.
2817 N Sacramento Avenue, Chicago, IL 60618
MLS# 12577797Listed by: @PROPERTIES CHRISTIE'S INTERNATIONAL REAL ESTATE $385,000Pending2 beds 2 baths1,300 sq. ft.
3037 N Troy Street #1E, Chicago, IL 60618
MLS# 12578293Listed by: @PROPERTIES CHRISTIE'S INTERNATIONAL REAL ESTATE $1,449,900Pending5 beds 4 baths3,400 sq. ft.
3057 N Christiana Avenue, Chicago, IL 60618
MLS# 12580209Listed by: @PROPERTIES CHRISTIE'S INTERNATIONAL REAL ESTATE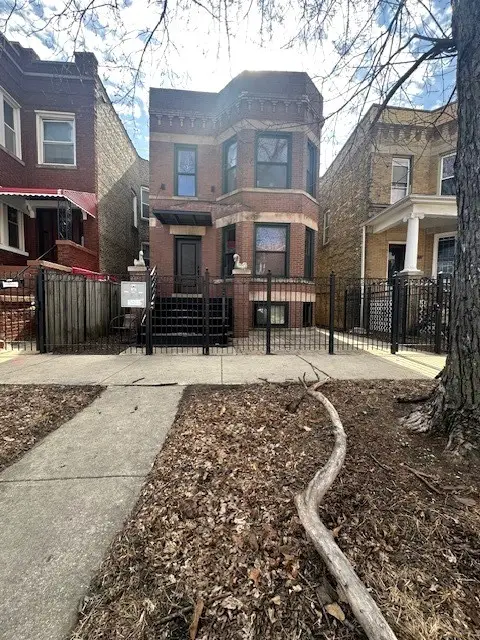 $725,000Pending5 beds 3 baths
3023 W Wellington Avenue, Chicago, IL 60618
MLS# 12579479Listed by: PROSALES REALTY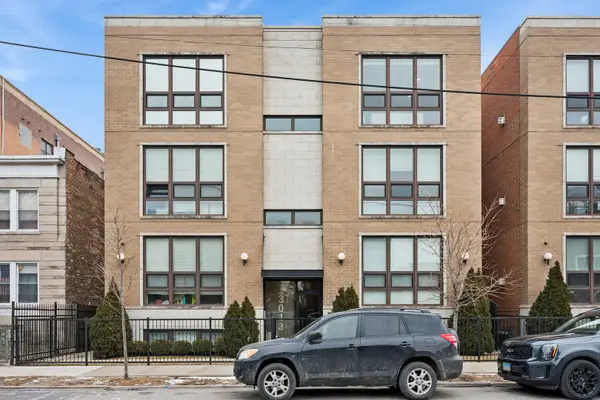 $485,000Pending2 beds 2 baths1,219 sq. ft.
3013 N California Avenue #3S, Chicago, IL 60618
MLS# 12573680Listed by: BAIRD & WARNER $1,250,000Pending4 beds 4 baths
2840 N Christiana Avenue, Chicago, IL 60618
MLS# 12578987Listed by: COMPASS $619,000Pending3 beds 2 baths1,700 sq. ft.
2970 W Nelson Street, Chicago, IL 60618
MLS# 12576952Listed by: PEARSON REALTY GROUP $649,000Pending3 beds 2 baths
2913 W Belmont Avenue #3A, Chicago, IL 60618
MLS# 12566548Listed by: @PROPERTIES CHRISTIE'S INTERNATIONAL REAL ESTATE $620,000Pending2 beds 2 baths
2942 N Elston Avenue #2, Chicago, IL 60618
MLS# 12576258Listed by: LANDMARK REALTORS $1,449,900Pending5 beds 4 baths3,400 sq. ft.
3055 N Christiana Avenue, Chicago, IL 60618
MLS# 12575379Listed by: @PROPERTIES CHRISTIE'S INTERNATIONAL REAL ESTATE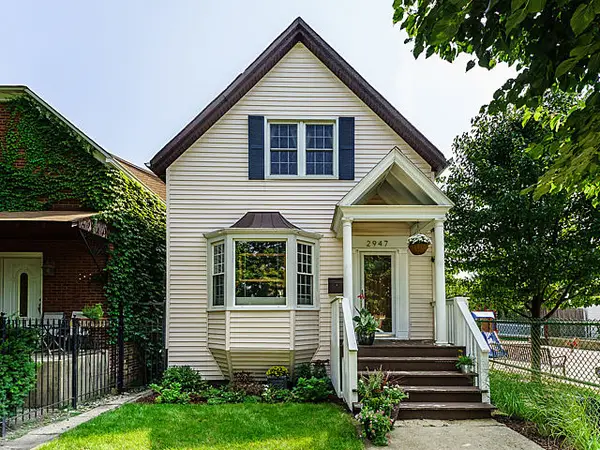 $600,000Pending3 beds 2 baths1,800 sq. ft.
2947 N Washtenaw Avenue, Chicago, IL 60618
MLS# 12560792Listed by: BAIRD & WARNER $599,000Pending3 beds 2 baths1,601 sq. ft.
3215 N Elston Avenue #3N, Chicago, IL 60618
MLS# 12565590Listed by: COMPASS $540,000Pending5 beds 4 baths
3120 N Saint Louis Avenue, Chicago, IL 60618
MLS# 12571168Listed by: REALTY OF AMERICA, LLC $365,000Pending2 beds 1 baths
3107 W George Street #3, Chicago, IL 60618
MLS# 12566395Listed by: BAIRD & WARNER $649,900Pending4 beds 2 baths
4045 W Nelson Street, Chicago, IL 60641
MLS# 12590555Listed by: GREYSTONE REALTY $1,099,999Pending6 beds 3 baths
Address Withheld By Seller, Chicago, IL 60618
MLS# 12501355Listed by: JAMESON SOTHEBY'S INTL REALTY $700,000Pending3 beds 2 baths
3139 N Central Park Avenue #3, Chicago, IL 60618
MLS# 12555461Listed by: BAIRD & WARNER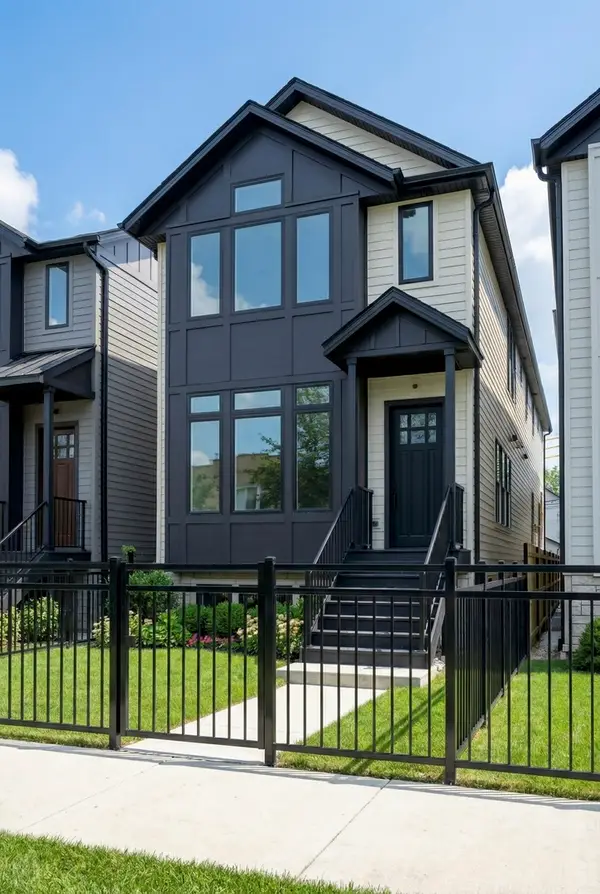 $1,429,900Pending5 beds 4 baths3,400 sq. ft.
3051 N Christiana Avenue, Chicago, IL 60618
MLS# 12564926Listed by: @PROPERTIES CHRISTIE'S INTERNATIONAL REAL ESTATE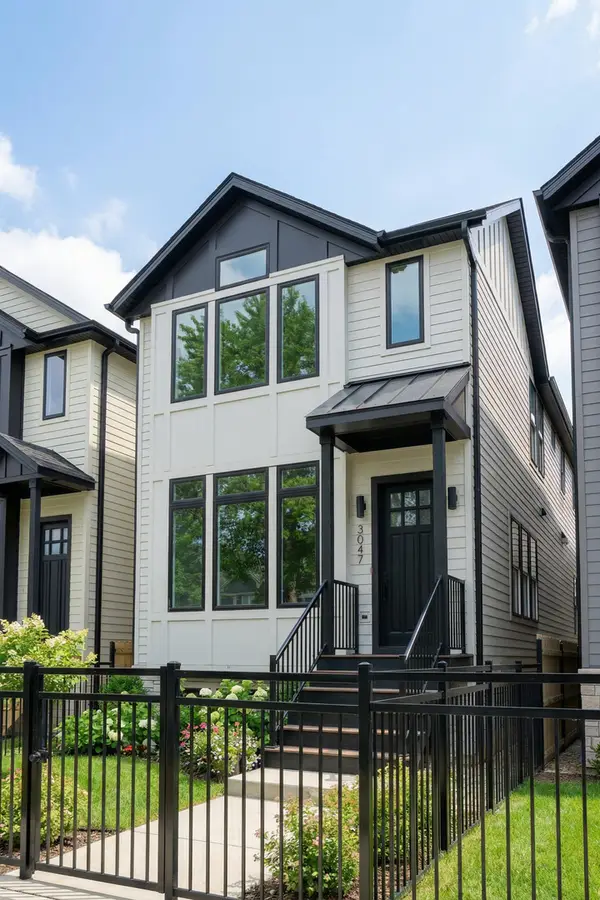 $1,429,900Pending5 beds 4 baths3,400 sq. ft.
3047 N Christiana Avenue, Chicago, IL 60618
MLS# 12561789Listed by: @PROPERTIES CHRISTIE'S INTERNATIONAL REAL ESTATE $1,099,900Active3 beds 3 baths3,100 sq. ft.
3843 W Addison Street, Chicago, IL 60618
MLS# 12556619Listed by: PROCASA REALTY, LTD. $1,399,900Pending5 beds 4 baths3,400 sq. ft.
3045 N Christiana Avenue, Chicago, IL 60618
MLS# 12559935Listed by: @PROPERTIES CHRISTIE'S INTERNATIONAL REAL ESTATE $399,900Pending4 beds 2 baths
3348 N Albany Avenue, Chicago, IL 60618
MLS# 12574176Listed by: EXP REALTY $925,000Pending5 beds 2 baths
3404 N Albany Avenue, Chicago, IL 60618
MLS# 12555401Listed by: BAIRD & WARNER $799,900Pending7 beds 2 baths
Address Withheld By Seller, Chicago, IL 60618
MLS# 12523250Listed by: COMPASS $524,900Active2 beds 1 baths
2814 N Maplewood Avenue, Chicago, IL 60618
MLS# 12535957Listed by: EXP REALTY- $470,000Active4 beds 2 baths
3035 N Monticello Avenue, Chicago, IL 60618
MLS# 12553744Listed by: PETER DROSSOS REAL ESTATE  $725,000Active6 beds 3 baths
3103 N Kedzie Avenue, Chicago, IL 60618
MLS# 12540069Listed by: REALTY OF AMERICA, LLC $650,000Pending4 beds 4 baths
2941 N Harding Avenue, Chicago, IL 60618
MLS# 12541834Listed by: ARHOME REALTY $879,000Pending3 beds 4 baths2,500 sq. ft.
3143 N Sawyer Avenue, Chicago, IL 60618
MLS# 12531161Listed by: ALINA PREDOLYAK $849,900Active5 beds 2 baths
Address Withheld By Seller, Chicago, IL 60618
MLS# 12513691Listed by: KALE REALTY $599,900Pending3 beds 2 baths1,550 sq. ft.
3101 N Ridgeway Avenue #2A, Chicago, IL 60618
MLS# 12517904Listed by: PEARSON REALTY GROUP $495,000Pending6 beds 4 baths
3244 N Drake Avenue, Chicago, IL 60618
MLS# 12561274Listed by: REALTY OF AMERICA, LLC $865,000Active2 beds 1 baths
3222 N Drake Avenue, Chicago, IL 60618
MLS# 12506439Listed by: SAV-MORE REALTY, INC. $400,000Pending4 beds 1 baths1,100 sq. ft.
2925 N Troy Street, Chicago, IL 60618
MLS# 12501543Listed by: COLDWELL BANKER REALTY $370,000Pending4 beds 2 baths
3037 N Central Park Avenue, Chicago, IL 60618
MLS# 12481476Listed by: REALTY OF AMERICA, LLC $1,250,000Pending4 beds 4 baths3,200 sq. ft.
3027 N Elbridge Avenue, Chicago, IL 60618
MLS# 12416868Listed by: KALE REALTY $880,000Pending9 beds 6 baths
3453 N Harding Avenue, Chicago, IL 60618
MLS# 12434495Listed by: IDREAM REALTY INC $539,900Pending2 beds 2 baths
3100 N Saint Louis Avenue, Chicago, IL 60618
MLS# 12423695Listed by: MO2 BROKERAGE LLC $1,295,000Active8 beds 4 baths
2832 N Mozart Street, Chicago, IL 60618
MLS# 12577700Listed by: REALTY OF AMERICA, LLC $270,000Active1 beds 1 baths
2612 W Diversey Avenue #101, Chicago, IL 60647
MLS# 12376851Listed by: FULTON GRACE REALTY $18,000,000Active3.28 Acres
3278 N Milwaukee Avenue, Chicago, IL 60618
MLS# 12369091Listed by: STRAUSS REALTY LTD
Local realty services provided by:CENTURY 21 All Pro Real Estate
Copyright 2026 Midwest Real Estate Data LLC. All rights reserved. The data relating to real estate for sale on this web site comes in part from the Broker Reciprocity Program of the Midwest Real Estate Data LLC. Listing information is deemed reliable but not guaranteed.
Popular neighborhoods near Avondale, Chicago, IL
Zip codes near Avondale, Chicago, IL
- 60610 homes for sale
- 60612 homes for sale
- 60613 homes for sale
- 60614 homes for sale
- 60618 homes for sale
- 60622 homes for sale
- 60624 homes for sale
- 60625 homes for sale
- 60630 homes for sale
- 60639 homes for sale
- 60640 homes for sale
- 60641 homes for sale
- 60642 homes for sale
- 60646 homes for sale
- 60647 homes for sale
- 60651 homes for sale
- 60657 homes for sale
- 60659 homes for sale
- 60660 homes for sale
- 60712 homes for sale
Counties near Avondale, Chicago, IL
- Berrien County homes for sale
- Boone County homes for sale
- Cook County homes for sale
- DeKalb County homes for sale
- DuPage County homes for sale
- Grundy County homes for sale
- Kane County homes for sale
- Kankakee County homes for sale
- Kendall County homes for sale
- Kenosha County homes for sale
- Lake County homes for sale
- Lake County homes for sale
- LaPorte County homes for sale
- McHenry County homes for sale
- Newton County homes for sale
- Porter County homes for sale
- Racine County homes for sale
- Van Buren County homes for sale
- Walworth County homes for sale
- Will County homes for sale
Protect your home and budget from life's surprises with an Assurant Home Warranty, backed by a partner that supports you through every step of homeownership. Explore Plans.
©2026 Century 21 Real Estate LLC. All rights reserved. CENTURY 21®, the CENTURY 21 Logo and C21® are service marks owned by Century 21 Real Estate LLC. Century 21 Real Estate LLC fully supports the principles of the Fair Housing Act and the Equal Opportunity Act. Each office is independently owned and operated. Listing information is deemed reliable but not guaranteed accurate.