- Barrington homes for sale
- Barrington homes for sale
- Barrington Township homes for sale
- Barrington Hills homes for sale
- Cary homes for sale
- Cuba homes for sale
- Deer Park homes for sale
- Ela homes for sale
- Forest Lake homes for sale
- Fox River Grove homes for sale
- Hawthorn Woods homes for sale
- Hoffman Estates homes for sale
- Inverness homes for sale
- Kildeer homes for sale
- Lake Barrington homes for sale
- Lake Zurich homes for sale
- North Barrington homes for sale
- Palatine Township homes for sale
- Port Barrington homes for sale
- South Barrington homes for sale
60010, IL - homes for sale
11 of 11 results displayed
- Open Sat, 11am to 1pmNew
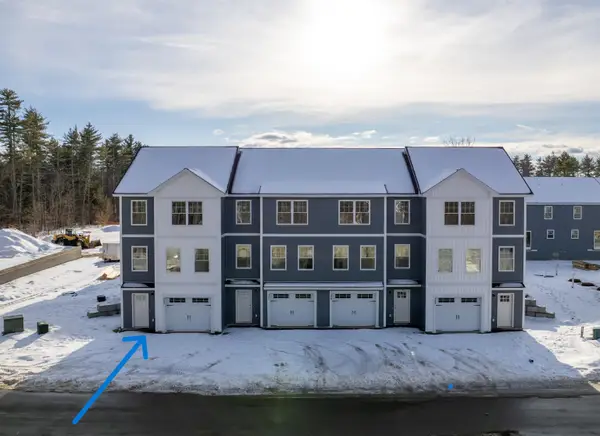 $424,900Active2 beds 2 baths1,250 sq. ft.
10D Lucky Lane The Crossings at Village Center #10 D, Barrington, NH 03825
MLS# 5080813Listed by: THE GOVE GROUP REAL ESTATE, LLC
- Open Sat, 11am to 1pmNew
 $779,900Active4 beds 4 baths3,297 sq. ft.
505 Rue Chamonix, Deer Park, IL 60010
MLS# 12601612Listed by: RE/MAX TOP PERFORMERS - Open Sat, 12 to 3pmNew
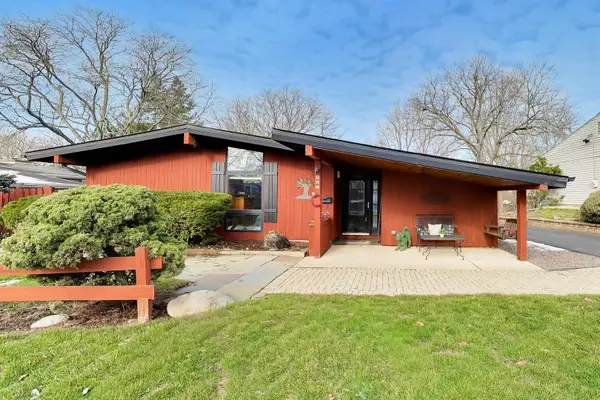 $573,000Active4 beds 2 baths1,897 sq. ft.
802 Lill Street, Barrington, IL 60010
MLS# 12583482Listed by: @PROPERTIES CHRISTIES INTERNATIONAL REAL ESTATE - Open Sun, 1:30 to 4pm
 $469,890Active3 beds 4 baths
890 Shoreline Road, Lake Barrington, IL 60010
MLS# 12592622Listed by: RE/MAX PLAZA - Open Sat, 2 to 4pm
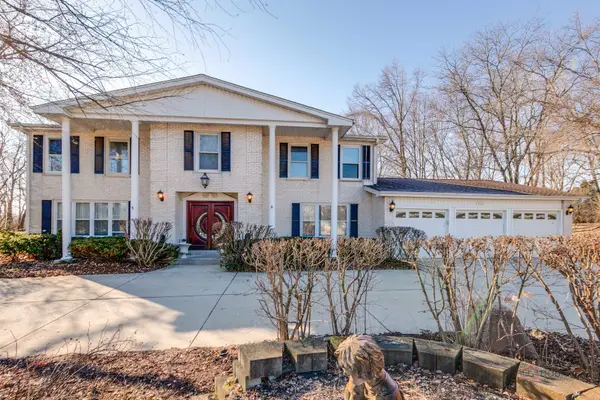
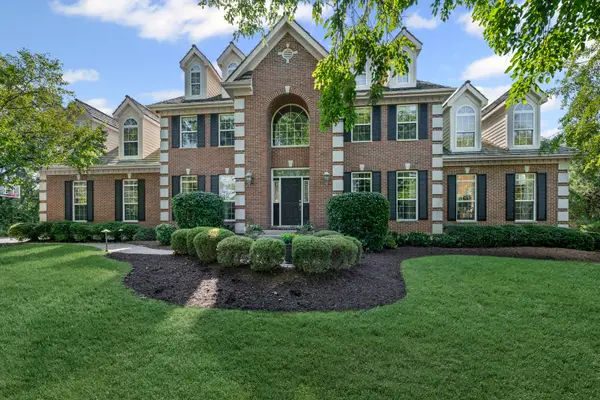
 $1,250,000Active4 beds 5 baths5,490 sq. ft.
26012 W Il Route 22, Barrington, IL 60010
MLS# 12552375Listed by: RE/MAX TOP PERFORMERS - Open Sun, 1 to 4pm
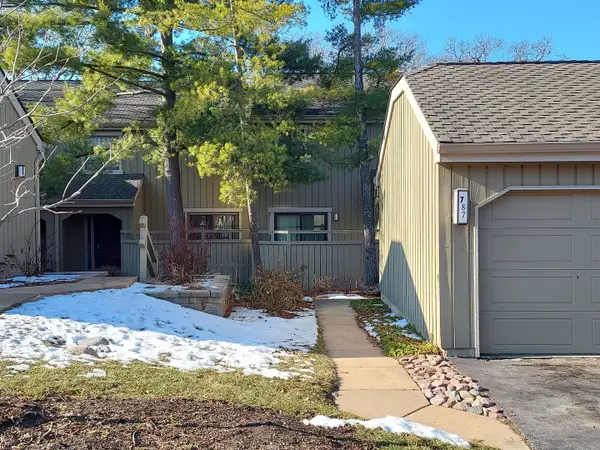 $423,900Active2 beds 4 baths2,100 sq. ft.
787 Oak Hill Road #467, Lake Barrington, IL 60010
MLS# 12569120Listed by: RE/MAX PROPERTIES NORTHWEST - Open Sat, 2 to 4pm
 $1,150,000Pending4 beds 5 baths6,312 sq. ft.
25605 Blackhawk Lane, Barrington, IL 60010
MLS# 12554182Listed by: BAIRD & WARNER - Open Sun, 12 to 2pm
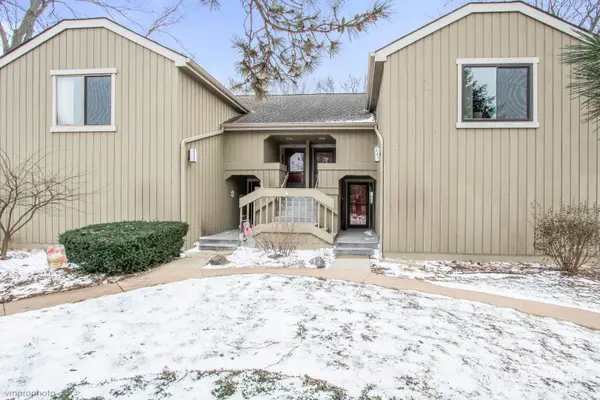 $339,900Active2 beds 2 baths1,286 sq. ft.
347 Hickory Lane #A, Lake Barrington, IL 60010
MLS# 12538563Listed by: BAIRD & WARNER - Open Sat, 12 to 2pm
 $1,089,000Active5 beds 6 baths4,539 sq. ft.
12 Riderwood Road, North Barrington, IL 60010
MLS# 12527551Listed by: COMPASS - Open Sun, 1 to 4pm
 $739,000Active3 beds 4 baths3,296 sq. ft.
660 Old Barn Road #F-24, Lake Barrington, IL 60010
MLS# 12456944Listed by: RE/MAX PROPERTIES NORTHWEST 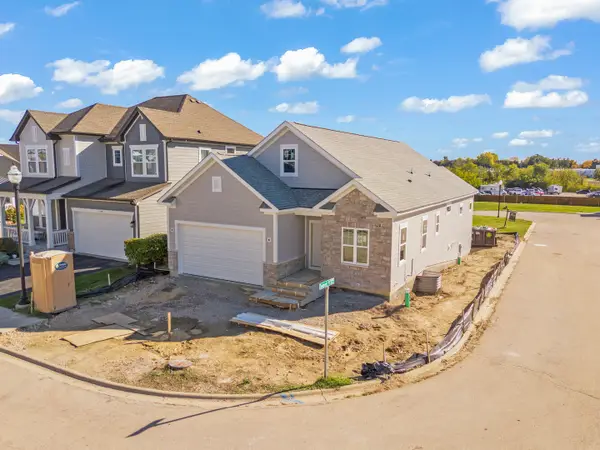 $749,990Active2 beds 2 baths1,787 sq. ft.
1431 Somerset Place, Barrington, IL 60010
MLS# 12470061Listed by: JOHN GREENE, REALTOR
Local realty services provided by:CENTURY 21 Barbara Patterson, CENTURY 21 Circle
Copyright 2026 Prime MLS, Inc. All rights reserved. This information is deemed reliable, but not guaranteed. The data relating to real estate displayed on this Site comes in part from the IDX Program of Prime MLS. The information being provided is for consumers’ personal, noncommercial use and may not be used for any purpose other than to identify prospective properties consumers may be interested in purchasing. Data last updated March 27, 2026
Copyright 2026 Midwest Real Estate Data LLC. All rights reserved. The data relating to real estate for sale on this web site comes in part from the Broker Reciprocity Program of the Midwest Real Estate Data LLC. Listing information is deemed reliable but not guaranteed.
Popular searches near 60010
Popular neighborhoods near 60010
- Cambridge Country, Mundelein homes for sale
- Cobblers Crossing, Elgin homes for sale
- Coventry, Crystal Lake homes for sale
- Dundee, Carpentersville homes for sale
- Fox River Valley Gardens, Port Barrington homes for sale
- Hawthorn Woods Country Club, Lake Zurich homes for sale
- High Hill Farms, Algonquin homes for sale
- Ivy Hill, Arlington Heights homes for sale
- Lake Barrington Shores, Lake Barrington homes for sale
- Lake in the Hills Estates, Lake In The Hills homes for sale
- Ridgewood, Buffalo Grove homes for sale
- Streamwood Green, Streamwood homes for sale
- The Crossings, Buffalo Grove homes for sale
- The Villages, Crystal Lake homes for sale
- The Villas of Gleneagle Farm, Carpentersville homes for sale
- The Woodlands at Fiore, Buffalo Grove homes for sale
- White Oak Estates, Long Grove homes for sale
- Winston Park Northwest, Palatine homes for sale
- Woodland Heights, Streamwood homes for sale
- Wynstone, North Barrington homes for sale
Counties near Barrington, 60010
- Boone County homes for sale
- Cook County homes for sale
- DeKalb County homes for sale
- DuPage County homes for sale
- Grundy County homes for sale
- Kane County homes for sale
- Kendall County homes for sale
- Kenosha County homes for sale
- Lake County homes for sale
- Lake County homes for sale
- Lee County homes for sale
- McHenry County homes for sale
- Milwaukee County homes for sale
- Ogle County homes for sale
- Racine County homes for sale
- Rock County homes for sale
- Walworth County homes for sale
- Waukesha County homes for sale
- Will County homes for sale
- Winnebago County homes for sale
Protect your home and budget from life's surprises with an Assurant Home Warranty, backed by a partner that supports you through every step of homeownership. Explore Plans.
©2026 Century 21 Real Estate LLC. All rights reserved. CENTURY 21®, the CENTURY 21 Logo and C21® are service marks owned by Century 21 Real Estate LLC. Century 21 Real Estate LLC fully supports the principles of the Fair Housing Act and the Equal Opportunity Act. Each office is independently owned and operated. Listing information is deemed reliable but not guaranteed accurate.