- Arnould Heights, Lafayette homes for sale
- Baker, Baker homes for sale
- Bendel Gardens, Lafayette homes for sale
- Beverly Hills, Sulphur homes for sale
- Downtown Baton Rouge, Baton Rouge homes for sale
- Downtown East, Baton Rouge homes for sale
- Graywood, Lake Charles homes for sale
- Louisiana State University, Baton Rouge homes for sale
- Magnolia Park, Lafayette homes for sale
- Maplewood, Sulphur homes for sale
- Oaklawn Heights, Lafayette homes for sale
- Old South Baton Rouge, Baton Rouge homes for sale
- Port Hudson, Zachary homes for sale
- River Ranch, Lafayette homes for sale
- South Campus, Baton Rouge homes for sale
- Souvenir Heights, Lafayette homes for sale
- Sugar Mill Pond, Youngsville homes for sale
- The Avenues, Baton Rouge homes for sale
- Westwood, Westlake homes for sale
- Whittington Oaks, Lafayette homes for sale
Basile, LA - homes for sale
8 of 8 results displayed
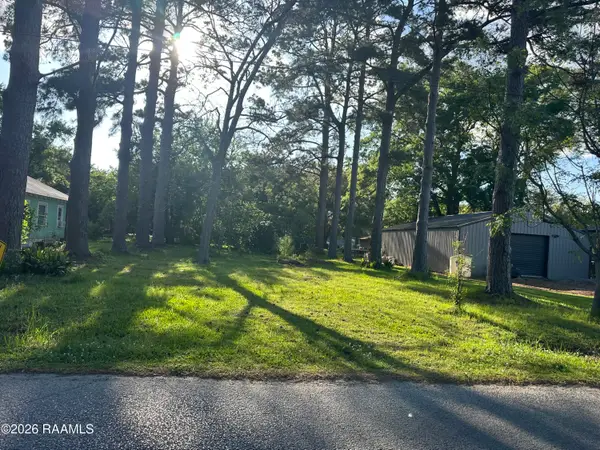 $9,500Pending0.14 Acres
1224 S Lewis Avenue, Basile, LA 70515
MLS# 2600002474Listed by: EXIT BAYOU REALTY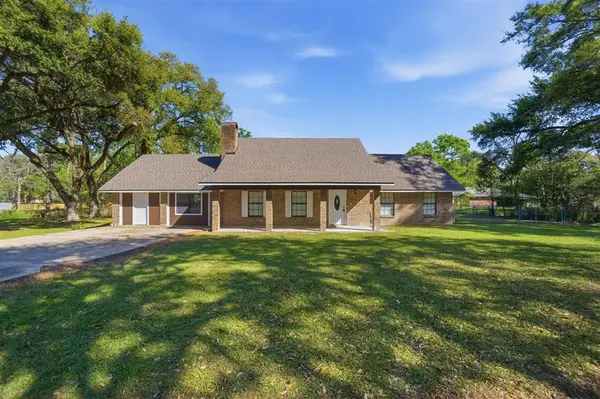 $293,000Active4 beds 3 baths2,928 sq. ft.
2627 Mcgee Johnson Street, Basile, LA 70515
MLS# SWL26001206Listed by: EXP REALTY, LLC
 $169,900Active2 beds 2 baths2,064 sq. ft.
2718 Railroad Street, Basile, LA 70515
MLS# SWL26001173Listed by: CENTURY 21 BONO REALTY $199,000Active3 beds 2 baths1,680 sq. ft.
2403 W Schambers Street, Basile, LA 70515
MLS# 2600002060Listed by: REAL BROKER, LLC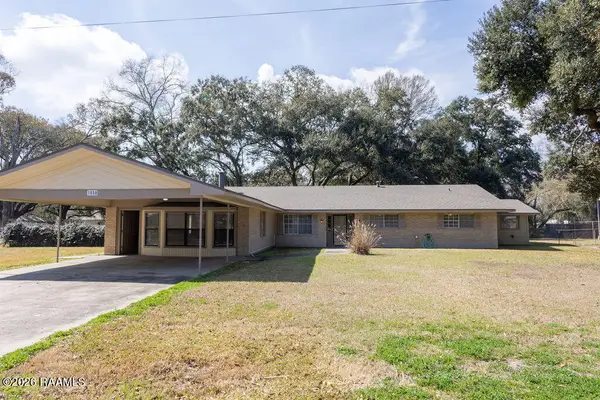 $185,000Active4 beds 4 baths3,444 sq. ft.
1058 S Berwick Avenue, Basile, LA 70515
MLS# 2600001050Listed by: COMPASS $40,000Active2 beds 1 baths861 sq. ft.
3042 Railroad Street, Basile, LA 70515
MLS# 2500006868Listed by: DCG/AGUILLARD REALTY $99,990Pending2 beds 1 baths800 sq. ft.
2416 2nd Street, Basile, LA 70515
MLS# SWL25100425Listed by: CENTURY 21 BONO REALTY $700,000Active100 Acres
3670 E Stagg Avenue, Basile, LA 70515
MLS# 2020021910Listed by: REAL BROKER, LLC
Local realty services provided by:CENTURY 21 Action Realty, CENTURY 21 Bono Realty
Neighborhoods near Basile, LA
Zip codes near Basile, LA
- 70515 homes for sale
- 70516 homes for sale
- 70525 homes for sale
- 70526 homes for sale
- 70531 homes for sale
- 70532 homes for sale
- 70534 homes for sale
- 70535 homes for sale
- 70543 homes for sale
- 70546 homes for sale
- 70554 homes for sale
- 70559 homes for sale
- 70578 homes for sale
- 70586 homes for sale
- 70591 homes for sale
- 70648 homes for sale
- 70650 homes for sale
- 70655 homes for sale
- 70658 homes for sale
- 71463 homes for sale
Popular searches near Basile, LA
- Basile homes for sale
- Branch homes for sale
- Church Point homes for sale
- Crowley homes for sale
- Egan homes for sale
- Elton homes for sale
- Estherwood homes for sale
- Eunice homes for sale
- Iota homes for sale
- Jennings homes for sale
- Kinder homes for sale
- Lacassine homes for sale
- Lawtell homes for sale
- Mamou homes for sale
- Morse homes for sale
- Oakdale homes for sale
- Oberlin homes for sale
- Rayne homes for sale
- Ville Platte homes for sale
- Welsh homes for sale
Protect your home and budget from life's surprises with an Assurant Home Warranty, backed by a partner that supports you through every step of homeownership. Explore Plans.
©2026 Century 21 Real Estate LLC. All rights reserved. CENTURY 21®, the CENTURY 21 Logo and C21® are service marks owned by Century 21 Real Estate LLC. Century 21 Real Estate LLC fully supports the principles of the Fair Housing Act and the Equal Opportunity Act. Each office is independently owned and operated. Listing information is deemed reliable but not guaranteed accurate.