- Alta Monte, Albuquerque homes for sale
- Beverly Wood, Albuquerque homes for sale
- Fair Heights, Albuquerque homes for sale
- Fair West, Albuquerque homes for sale
- Hodgin, Albuquerque homes for sale
- Inez, Albuquerque homes for sale
- McDuffie, Albuquerque homes for sale
- McKinley, Albuquerque homes for sale
- Netherwood Park, Albuquerque homes for sale
- Nob Hill, Albuquerque homes for sale
- North Eastern Assoc. of Residents, Albuquerque homes for sale
- Northeast Albuquerque, Albuquerque homes for sale
- Pueblo Alto, Albuquerque homes for sale
- Sandia High School Area, Albuquerque homes for sale
- Santa Barbara, Albuquerque homes for sale
- Snow Heights, Albuquerque homes for sale
- Southeast Heights, Albuquerque homes for sale
- Summit Park, Albuquerque homes for sale
- University Heights, Albuquerque homes for sale
- Uptown, Albuquerque homes for sale
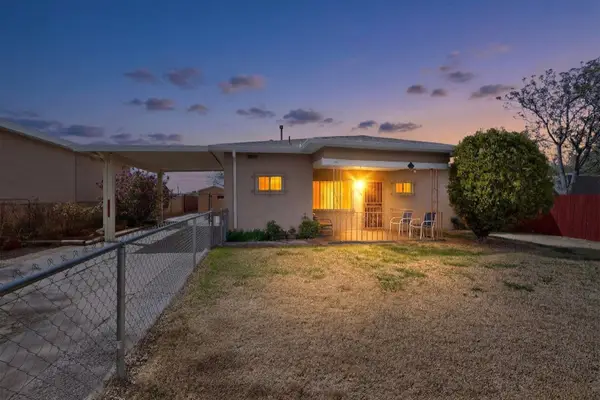
Bel-Air, Albuquerque, NM - homes for sale
1 of 1 results displayed
Local realty services provided by:CENTURY 21 Champions, Inc.
Popular neighborhoods near Bel-Air, Albuquerque, NM
Zip codes near Bel-Air, Albuquerque, NM
- 87004 homes for sale
- 87008 homes for sale
- 87048 homes for sale
- 87068 homes for sale
- 87102 homes for sale
- 87104 homes for sale
- 87105 homes for sale
- 87106 homes for sale
- 87107 homes for sale
- 87108 homes for sale
- 87109 homes for sale
- 87110 homes for sale
- 87111 homes for sale
- 87112 homes for sale
- 87113 homes for sale
- 87114 homes for sale
- 87120 homes for sale
- 87122 homes for sale
- 87123 homes for sale
- 87124 homes for sale
Counties near Bel-Air, Albuquerque, NM
- Bernalillo County homes for sale
- Cibola County homes for sale
- Los Alamos County homes for sale
- McKinley County homes for sale
- Rio Arriba County homes for sale
- Sandoval County homes for sale
- Santa Fe County homes for sale
- Socorro County homes for sale
- Torrance County homes for sale
- Valencia County homes for sale
Protect your home and budget from life's surprises with an Assurant Home Warranty, backed by a partner that supports you through every step of homeownership. Explore Plans.
©2026 Century 21 Real Estate LLC. All rights reserved. CENTURY 21®, the CENTURY 21 Logo and C21® are service marks owned by Century 21 Real Estate LLC. Century 21 Real Estate LLC fully supports the principles of the Fair Housing Act and the Equal Opportunity Act. Each office is independently owned and operated. Listing information is deemed reliable but not guaranteed accurate.