- Auburndale, Louisville properties for sale
- Cloverleaf, Louisville properties for sale
- Cooper Farms, Louisville properties for sale
- Fairdale, Fairdale properties for sale
- Hazelwood, Louisville properties for sale
- Heatherfields, Louisville properties for sale
- Heritage Creek, Louisville properties for sale
- Hillview, Pioneer Village properties for sale
- Iroquois, Louisville properties for sale
- Iroquois Park, Louisville properties for sale
- Kenwood Hill, Louisville properties for sale
- Mount Washington, Mount Washington properties for sale
- Okolona, Louisville properties for sale
- Pioneer Village, Shepherdsville properties for sale
- Pleasure Ridge Park, Louisville properties for sale
- Riverside Gardens, Louisville properties for sale
- St. Dennis, Louisville properties for sale
- Shepherdsville, Shepherdsville properties for sale
- Southside, Louisville properties for sale
- Valley Station, Louisville properties for sale
Big Clifty, KY - homes for sale
3 of 3 results displayed
 $379,900Active5 beds 3 baths2,055 sq. ft.
370 Sugar Branch Rd, Big Clifty, KY 42712
MLS# 1693694Listed by: GREATER NOLIN LAKE REALTY GROUP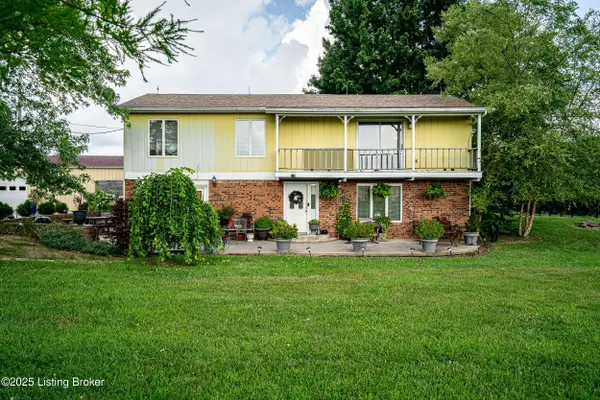 $275,000Active4 beds 2 baths2,184 sq. ft.
607 Hardin Springs Rd, Big Clifty, KY 42712
MLS# 1692392Listed by: RE/MAX FIVE STAR PROPERTIES $176,500Active2 beds 1 baths1,050 sq. ft.
118 Hardin Spring Rd, Big Clifty, KY 42712
MLS# 1691381Listed by: CITIZENS REALTY COMPANY
Local realty services provided by:CENTURY 21 Simpson & Associates
Neighborhoods near Big Clifty, KY
Zip codes near Big Clifty, KY
- 40115 properties for sale
- 40144 properties for sale
- 40145 properties for sale
- 40146 properties for sale
- 40152 properties for sale
- 40160 properties for sale
- 40162 properties for sale
- 40175 properties for sale
- 40178 properties for sale
- 42207 properties for sale
- 42259 properties for sale
- 42701 properties for sale
- 42712 properties for sale
- 42721 properties for sale
- 42724 properties for sale
- 42726 properties for sale
- 42729 properties for sale
- 42732 properties for sale
- 42754 properties for sale
- 42776 properties for sale
Popular searches near Big Clifty, KY
- Bee Spring properties for sale
- Big Clifty properties for sale
- Caneyville properties for sale
- Cecilia properties for sale
- Clarkson properties for sale
- Cub Run properties for sale
- Eastview properties for sale
- Elizabethtown properties for sale
- Harned properties for sale
- Hudson properties for sale
- Leitchfield properties for sale
- McDaniels properties for sale
- McDaniels-Hudson properties for sale
- Millerstown properties for sale
- Rineyville properties for sale
- Short Creek properties for sale
- Sonora properties for sale
- Summit properties for sale
- Vine Grove properties for sale
- Westview properties for sale
©2025 Century 21 Real Estate LLC. All rights reserved. CENTURY 21®, the CENTURY 21 Logo and C21® are service marks owned by Century 21 Real Estate LLC. Century 21 Real Estate LLC fully supports the principles of the Fair Housing Act and the Equal Opportunity Act. Each office is independently owned and operated. Listing information is deemed reliable but not guaranteed accurate.
©2025 Century 21 Real Estate LLC. All rights reserved. CENTURY 21®, the CENTURY 21 Logo and C21® are service marks owned by Century 21 Real Estate LLC. Century 21 Real Estate LLC fully supports the principles of the Fair Housing Act and the Equal Opportunity Act. Each office is independently owned and operated. Listing information is deemed reliable but not guaranteed accurate.