- Alexander Park, Mankato homes for sale
- Blue Earth Park, Mankato homes for sale
- Cook's Bay, Mound homes for sale
- Country Club Estates, Mankato homes for sale
- Dotson Park, Mankato homes for sale
- East Madison Avenue, Mankato homes for sale
- Eastwood Park, Mankato homes for sale
- Erlandson Park, Mankato homes for sale
- Franklin Rogers Park, Mankato homes for sale
- Halsted Bay, Excelsior homes for sale
- Highland Park, Mankato homes for sale
- Jaycee Park, Mankato homes for sale
- Jennings Bay, Mound homes for sale
- Lincoln Park, Mankato homes for sale
- Peacepipe Park, Mankato homes for sale
- Rasmussen Park, Mankato homes for sale
- Skyline, Mankato homes for sale
- Tourtellotte Park, Mankato homes for sale
- Washington Park, Mankato homes for sale
- West Upper Lake, Excelsior homes for sale
Bird Island, MN - homes for sale
5 of 5 results displayed
 $159,000Active4 beds 2 baths1,628 sq. ft.
15 Birch Avenue, Bird Island, MN 55310
MLS# 7031788Listed by: ASSOCIATED, REALTORS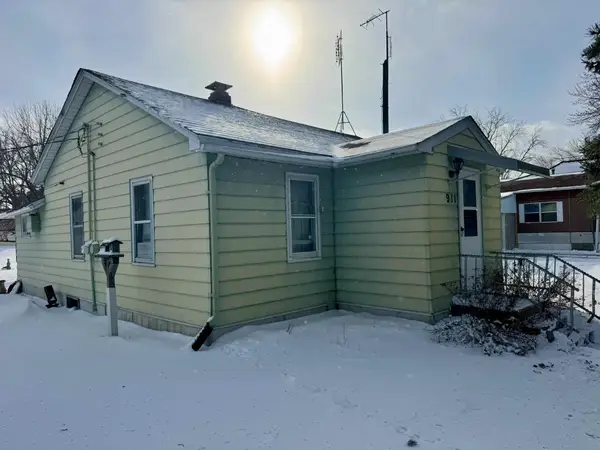 $69,900Active3 beds 1 baths927 sq. ft.
911 Maple Avenue, Bird Island, MN 55310
MLS# 7024241Listed by: RE/MAX PREFERRED REALTY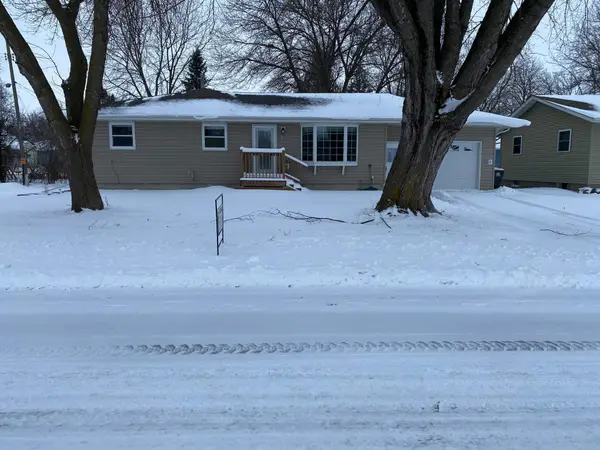 $179,900Active3 beds 2 baths1,568 sq. ft.
220 S 2nd Street, Bird Island, MN 55310
MLS# 7023883Listed by: MINNESOTA LANDS AND HOMES REAL ESTATE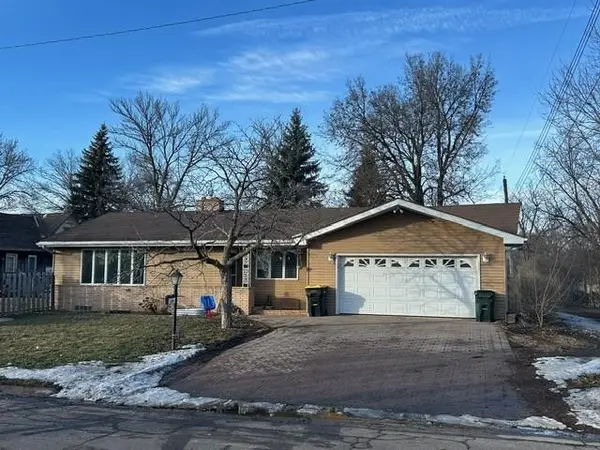 $199,900Pending2 beds 2 baths3,096 sq. ft.
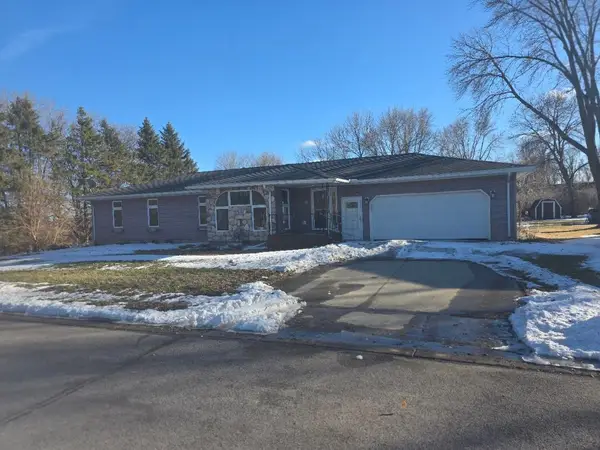
842 Fir Avenue, Bird Island, MN 55310
MLS# 7022553Listed by: EDINA REALTY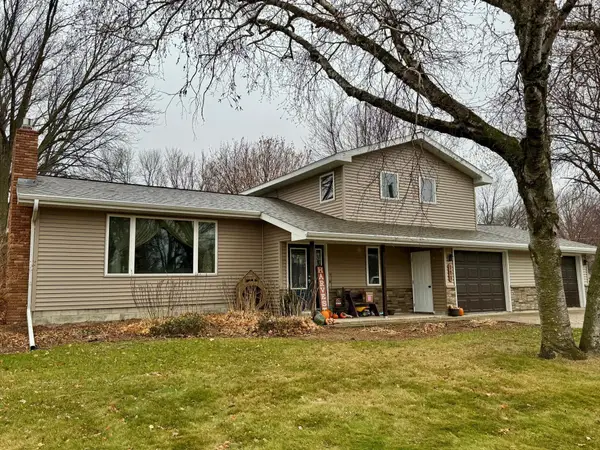 $254,900Active3 beds 2 baths2,507 sq. ft.
111 Cherry Avenue, Bird Island, MN 55310
MLS# 6821899Listed by: RE/MAX PREFERRED REALTY
Local realty services provided by:CENTURY 21 Brainerd Realty, Inc., CENTURY 21 FM Realty
Neighborhoods near Bird Island, MN
Zip codes near Bird Island, MN
- 55310 homes for sale
- 55312 homes for sale
- 55314 homes for sale
- 55332 homes for sale
- 55335 homes for sale
- 55342 homes for sale
- 55350 homes for sale
- 55355 homes for sale
- 55385 homes for sale
- 56201 homes for sale
- 56209 homes for sale
- 56216 homes for sale
- 56251 homes for sale
- 56253 homes for sale
- 56266 homes for sale
- 56277 homes for sale
- 56282 homes for sale
- 56283 homes for sale
- 56284 homes for sale
- 56285 homes for sale
Popular searches near Bird Island, MN
- Bird Island Township homes for sale
- Blomkest homes for sale
- Buffalo Lake homes for sale
- Fairfax homes for sale
- Gibbon homes for sale
- Greenleaf homes for sale
- Hector homes for sale
- Hector Township homes for sale
- Kandiyohi homes for sale
- Kandiyohi Township homes for sale
- Lake Lillian homes for sale
- Morgan homes for sale
- Olivia homes for sale
- Raymond homes for sale
- Redwood Falls homes for sale
- Redwood Falls Township homes for sale
- Renville homes for sale
- Sacred Heart homes for sale
- Stewart homes for sale
- Willmar homes for sale
Protect your home and budget from life's surprises with an Assurant Home Warranty, backed by a partner that supports you through every step of homeownership. Explore Plans.
©2026 Century 21 Real Estate LLC. All rights reserved. CENTURY 21®, the CENTURY 21 Logo and C21® are service marks owned by Century 21 Real Estate LLC. Century 21 Real Estate LLC fully supports the principles of the Fair Housing Act and the Equal Opportunity Act. Each office is independently owned and operated. Listing information is deemed reliable but not guaranteed accurate.