- Lower East Side, Helena properties for sale
- Lower West Side, Helena properties for sale
- North Central, Helena properties for sale
- North East, Helena properties for sale
- North West, Helena properties for sale
- South Central, Helena properties for sale
- Upper East Side, Helena properties for sale
- Upper West Side, Helena properties for sale
Black Eagle, MT - homes for sale
9 of 9 results displayed
- New
 $3,000Active0.07 Acres
TBD 29th St Ne, Black Eagle, MT 59414
MLS# 30062055Listed by: ECKLUND PROPERTIES - New
 $3,000Active0.07 Acres
TBD 29th Street Ne, Black Eagle, MT 59414
MLS# 30062057Listed by: ECKLUND PROPERTIES  $114,000Active3 beds 1 baths800 sq. ft.
123 11th Street Ne, Black Eagle, MT 59414
MLS# 30061750Listed by: DUSTIN YOUNG AND COMPANY $399,000Active-- beds -- baths5,713 sq. ft.
1220 Smelter Avenue Ne, Black Eagle, MT 59414
MLS# 30058036Listed by: DUSTIN YOUNG AND COMPANY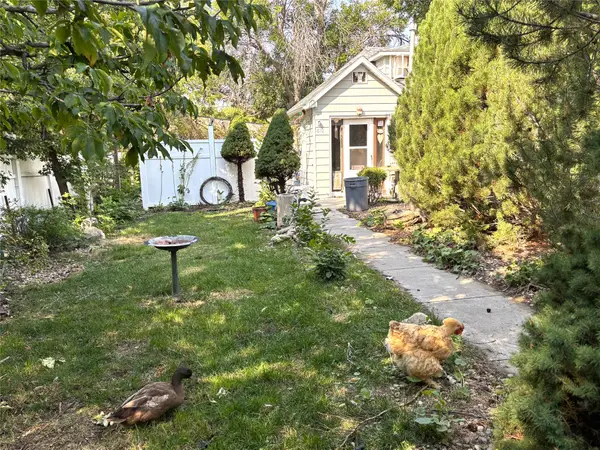 $199,900Active3 beds 1 baths1,324 sq. ft.
610 22nd Street, Black Eagle, MT 59414
MLS# 30056840Listed by: CENTRAL MONTANA REALTY $599,000Active4 beds 3 baths3,584 sq. ft.
2612 Rainbow Dam Road, Great Falls, MT 59404
MLS# 30055847Listed by: RE/MAX OF GREAT FALLS
 $499,900Active4 beds 3 baths2,886 sq. ft.
441 17th Street, Black Eagle, MT 59414
MLS# 30054506Listed by: CENTURY 21 NORTHWEST REALTY MT $179,000Active0.76 Acres
TBD Rainbow Dam Road, Great Falls, MT 59404
MLS# 30050719Listed by: RE/MAX OF GREAT FALLS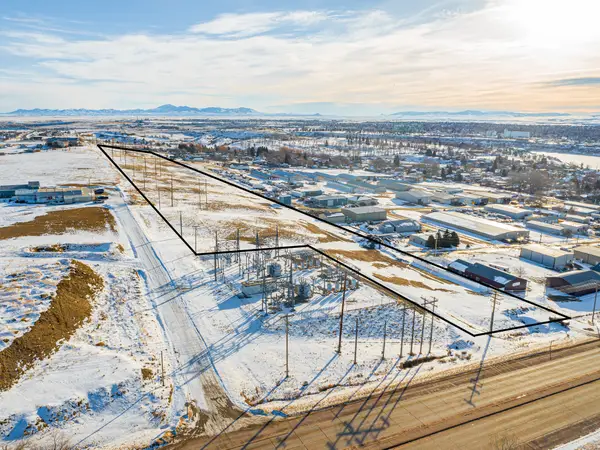 $600,000Active14.21 Acres
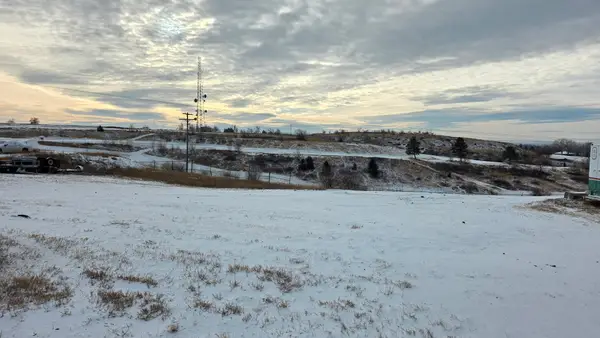
Nhn 28th Avenue Ne, Black Eagle, MT 59414
MLS# 30039060Listed by: CATALYST COMMERCIAL
Local realty services provided by:CENTURY 21 Shea Realty
Neighborhoods near Black Eagle, MT
Zip codes near Black Eagle, MT
- 59401 properties for sale
- 59404 properties for sale
- 59405 properties for sale
- 59412 properties for sale
- 59414 properties for sale
- 59421 properties for sale
- 59422 properties for sale
- 59425 properties for sale
- 59433 properties for sale
- 59436 properties for sale
- 59442 properties for sale
- 59443 properties for sale
- 59450 properties for sale
- 59463 properties for sale
- 59468 properties for sale
- 59469 properties for sale
- 59483 properties for sale
- 59485 properties for sale
- 59487 properties for sale
- 59648 properties for sale
Popular searches near Black Eagle, MT
- Belt properties for sale
- Cascade properties for sale
- Dutton properties for sale
- Dutton-Power properties for sale
- Eden-Stockett properties for sale
- Fairfield properties for sale
- Fort Benton properties for sale
- Fort Shaw properties for sale
- Great Falls properties for sale
- Great Falls North properties for sale
- Highwood properties for sale
- Monarch properties for sale
- Monarch-Neihart properties for sale
- Power properties for sale
- Raynesford properties for sale
- Riceville properties for sale
- Sun River properties for sale
- Sun River Valley properties for sale
- Ulm properties for sale
- Vaughn properties for sale
©2025 Century 21 Real Estate LLC. All rights reserved. CENTURY 21®, the CENTURY 21 Logo and C21® are service marks owned by Century 21 Real Estate LLC. Century 21 Real Estate LLC fully supports the principles of the Fair Housing Act and the Equal Opportunity Act. Each office is independently owned and operated. Listing information is deemed reliable but not guaranteed accurate.
©2025 Century 21 Real Estate LLC. All rights reserved. CENTURY 21®, the CENTURY 21 Logo and C21® are service marks owned by Century 21 Real Estate LLC. Century 21 Real Estate LLC fully supports the principles of the Fair Housing Act and the Equal Opportunity Act. Each office is independently owned and operated. Listing information is deemed reliable but not guaranteed accurate.