- Abby Trails, Canal Winchester homes for sale
- Beechwood, Columbus homes for sale
- Berwyn East, Columbus homes for sale
- Big Walnut, Columbus homes for sale
- Blacklick Estates, Columbus homes for sale
- Brice, Canal Winchester homes for sale
- East Columbus, Columbus homes for sale
- Eastland, Columbus homes for sale
- George's Creek, Canal Winchester homes for sale
- Glenbrook, Columbus homes for sale
- Independence Village, Canal Winchester homes for sale
- Livingston, Columbus homes for sale
- Madison Mills, Columbus homes for sale
- Oakmont, Columbus homes for sale
- Shannon Square, Canal Winchester homes for sale
- South Alum Creek, Columbus homes for sale
- Three Rivers, Groveport homes for sale
- Walnut Heights, Columbus homes for sale
- White Ash, Canal Winchester homes for sale
- Winchester, Groveport homes for sale
Blacklick Estates, OH - homes for sale
31 of 31 results displayed
- New
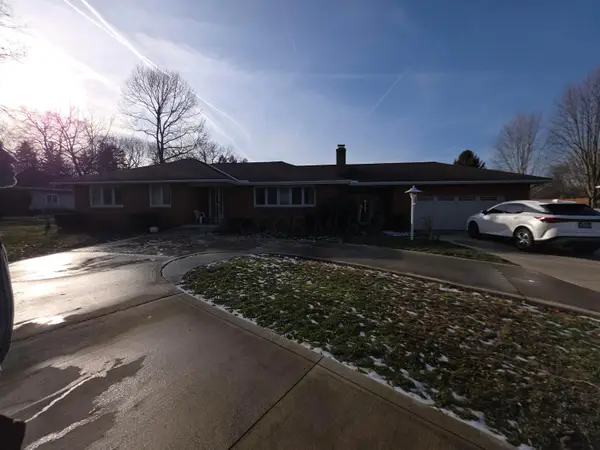
 $259,990Active3 beds 2 baths1,508 sq. ft.
5185 Rutledge Drive S, Columbus, OH 43232
MLS# 226009598Listed by: COLDWELL BANKER REALTY - New
 $225,000Active4 beds 1 baths1,248 sq. ft.
5301 Negley Court, Columbus, OH 43232
MLS# 226009437Listed by: OHIO BROKER DIRECT, LLC - New
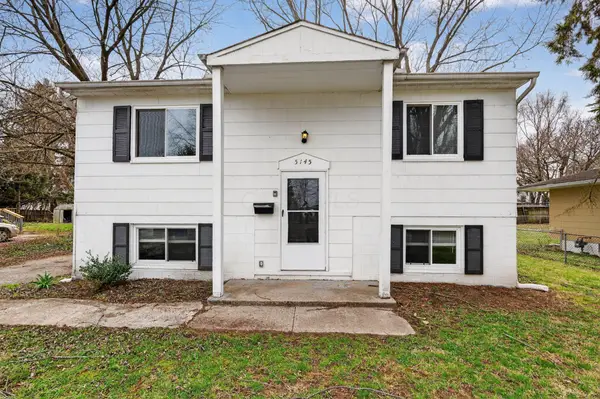 $204,900Active4 beds 2 baths1,320 sq. ft.
5145 Rutledge Drive S, Columbus, OH 43232
MLS# 226009279Listed by: TRELORA REALTY, INC - New
 $199,900Active3 beds 1 baths936 sq. ft.
3608 Clearwater Drive, Columbus, OH 43232
MLS# 226008882Listed by: RED 1 REALTY  $185,000Active2 beds 1 baths912 sq. ft.
5308 Fullerton Drive, Columbus, OH 43232
MLS# 226007173Listed by: NEXTHOME EXPERIENCE $239,900Active3 beds 2 baths1,352 sq. ft.
2908 Renfro Road, Columbus, OH 43232
MLS# 226007125Listed by: KW CLASSIC PROPERTIES REALTY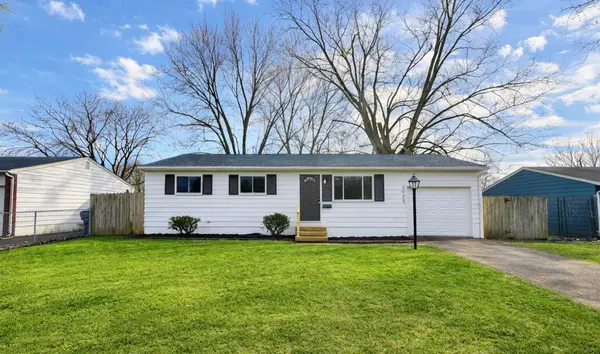 $250,000Active4 beds 2 baths1,600 sq. ft.
4925 Wymore Drive, Columbus, OH 43232
MLS# 226006902Listed by: RED 1 REALTY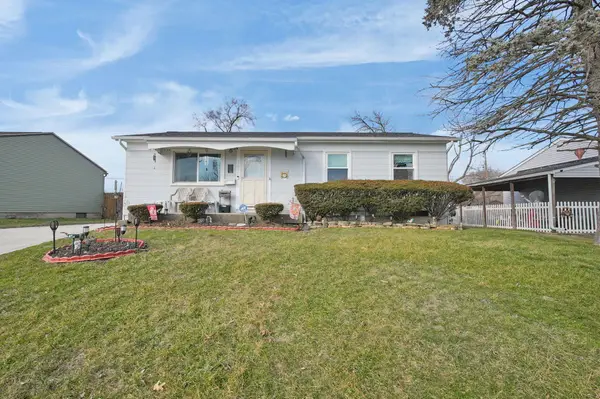 $220,000Active3 beds 1 baths912 sq. ft.
3851 Wade Road, Columbus, OH 43232
MLS# 226006129Listed by: KELLER WILLIAMS GREATER COLS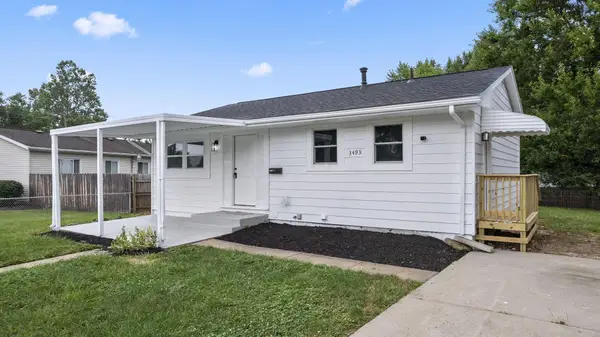 $254,900Active4 beds 2 baths1,700 sq. ft.
3493 Tremaine Road, Columbus, OH 43232
MLS# 226004731Listed by: CARLETON REALTY, LLC $190,000Active3 beds 1 baths1,548 sq. ft.
3302 Everson Road E, Columbus, OH 43232
MLS# 226004696Listed by: CUTLER REAL ESTATE $210,000Active3 beds 1 baths936 sq. ft.
3824 Wade Road, Columbus, OH 43232
MLS# 226003211Listed by: RE/MAX CONSULTANT GROUP $165,000Active3 beds 1 baths936 sq. ft.
3492 Rodell Road, Columbus, OH 43232
MLS# 226003071Listed by: RE/MAX REVEALTY $219,900Active4 beds 2 baths1,435 sq. ft.
5290 Quincy Drive, Columbus, OH 43232
MLS# 226002358Listed by: ENTERA REALTY LLC $255,000Active4 beds 2 baths1,369 sq. ft.
4980 Harbor Boulevard, Columbus, OH 43232
MLS# 226002314Listed by: CARLETON REALTY, LLC $229,900Active3 beds 2 baths1,219 sq. ft.
3622 Alpena Road, Columbus, OH 43232
MLS# 226001678Listed by: COLDWELL BANKER REALTY $337,000Active4 beds 3 baths2,500 sq. ft.
4547 Beachworth Court, Columbus, OH 43232
MLS# 226001647Listed by: COLDWELL BANKER REALTY- Coming Soon
 $285,000Coming Soon3 beds 2 baths
3479 Trenton Road, Columbus, OH 43232
MLS# 226000348Listed by: RED 1 REALTY 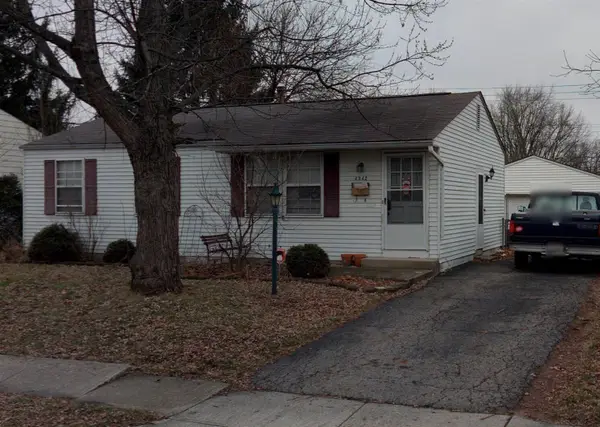 $189,900Active3 beds 1 baths936 sq. ft.
4942 Talbert Drive, Columbus, OH 43232
MLS# 226000280Listed by: THE WESTWOOD REAL ESTATE CO. $204,900Active4 beds 2 baths1,288 sq. ft.
3275 Faycrest Road, Columbus, OH 43232
MLS# 225045901Listed by: ENTERA REALTY LLC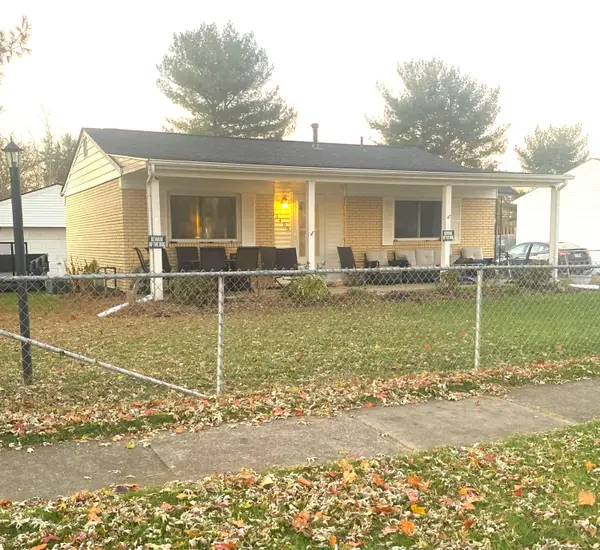 $239,000Active4 beds 2 baths936 sq. ft.
3455 Tremaine Road, Columbus, OH 43232
MLS# 225044702Listed by: I HEART REAL ESTATE $229,900Active4 beds 2 baths1,056 sq. ft.
3860 Evanston Road, Columbus, OH 43232
MLS# 225044080Listed by: REAFCO $224,000Active5 beds 2 baths1,184 sq. ft.
5143 Rutledge Drive N, Columbus, OH 43232
MLS# 225043710Listed by: FATHOM REALTY OHIO $259,900Active4 beds 2 baths1,700 sq. ft.
3493 Tremaine Road, Columbus, OH 43232
MLS# 225043511Listed by: CARLETON REALTY, LLC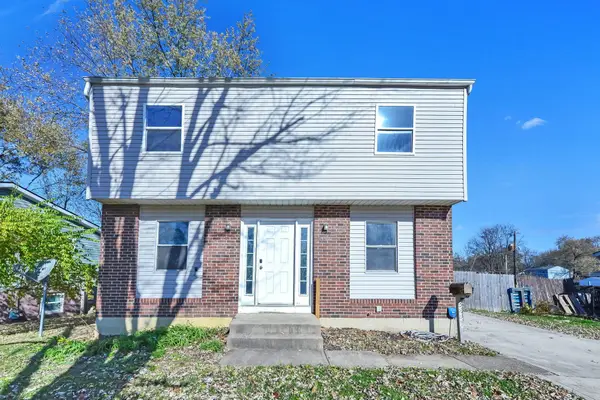 $239,900Active4 beds 2 baths1,288 sq. ft.
3246 Latonia Road, Columbus, OH 43232
MLS# 225043131Listed by: E-MERGE REAL ESTATE CROSSROADS $149,899Active3 beds 1 baths1,172 sq. ft.
5145 Fullerton Drive, Columbus, OH 43232
MLS# 225042079Listed by: HOME FIRST REALTY $179,900Active3 beds 2 baths1,032 sq. ft.
2998 Osgood Road E, Columbus, OH 43232
MLS# 225034343Listed by: BECKETT REALTY GROUP $259,300Active4 beds 2 baths1,700 sq. ft.
3773 Clearwater Drive, Columbus, OH 43232
MLS# 225033566Listed by: HOWARD HANNA REAL ESTATE SVCS $179,999Active3 beds 1 baths1,236 sq. ft.
3773 Tylor Drive, Columbus, OH 43232
MLS# 225026556Listed by: KELLER WILLIAMS GREATER COLS $190,000Active3 beds 1 baths1,332 sq. ft.
5422 Everson Road N, Columbus, OH 43232
MLS# 225016482Listed by: MAINSTAY BROKERAGE LLC $334,000Active4 beds 3 baths4,782 sq. ft.
3900 Noe Bixby Road, Columbus, OH 43232
MLS# 225019481Listed by: M3K REAL ESTATE NETWORK INC. $205,000Active3 beds 2 baths1,575 sq. ft.
5361 Parkline Drive, Columbus, OH 43232
MLS# 226005107Listed by: KEY REALTY
Local realty services provided by:CENTURY 21 Premiere Properties
All information deemed reliable but not guaranteed and should be independently verified. All properties are subject to prior sale, change or withdrawal. Neither listing broker(s) nor CENTURY 21 Premiere Properties shall be responsible for any typographical errors, misinformation, misprints and shall be held totally harmless.
Neighborhoods near Blacklick Estates, OH
Zip codes near Blacklick Estates, OH
- 43004 homes for sale
- 43068 homes for sale
- 43110 homes for sale
- 43125 homes for sale
- 43136 homes for sale
- 43147 homes for sale
- 43203 homes for sale
- 43205 homes for sale
- 43206 homes for sale
- 43207 homes for sale
- 43209 homes for sale
- 43211 homes for sale
- 43213 homes for sale
- 43215 homes for sale
- 43217 homes for sale
- 43219 homes for sale
- 43223 homes for sale
- 43227 homes for sale
- 43230 homes for sale
- 43232 homes for sale
Popular searches near Blacklick Estates, OH
- Bexley homes for sale
- Blacklick homes for sale
- Canal Winchester homes for sale
- Canal Winchester homes for sale
- Columbus homes for sale
- Columbus homes for sale
- Gahanna homes for sale
- Groveport homes for sale
- Hamilton homes for sale
- Jefferson Township homes for sale
- Lithopolis homes for sale
- Lithopolis homes for sale
- Madison Township homes for sale
- Mifflin homes for sale
- Obetz homes for sale
- Pickerington homes for sale
- Reynoldsburg homes for sale
- Truro homes for sale
- Violet homes for sale
- Whitehall homes for sale
Protect your home and budget from life's surprises with an Assurant Home Warranty, backed by a partner that supports you through every step of homeownership. Explore Plans.
©2026 Century 21 Real Estate LLC. All rights reserved. CENTURY 21®, the CENTURY 21 Logo and C21® are service marks owned by Century 21 Real Estate LLC. Century 21 Real Estate LLC fully supports the principles of the Fair Housing Act and the Equal Opportunity Act. Each office is independently owned and operated. Listing information is deemed reliable but not guaranteed accurate.