- Alleyton homes for sale
- Bellville homes for sale
- Bleiblerville homes for sale
- Brenham homes for sale
- Burton homes for sale
- Carmine homes for sale
- Carmine homes for sale
- Cat Spring homes for sale
- Chappell Hill homes for sale
- Columbus homes for sale
- Fayetteville homes for sale
- Gay Hill-Independence homes for sale
- Hempstead homes for sale
- Industry homes for sale
- Ledbetter homes for sale
- New Ulm homes for sale
- Round Top homes for sale
- Somerville homes for sale
- Washington homes for sale
- Washington-Chappell Hill homes for sale
78931, TX - homes for sale
2 of 2 results displayed
 $1,199,000Active30 Acres
5796 Hurtig Road, Bleiblerville, TX 78931
MLS# 30769809Listed by: CITY GROUP PROPERTIES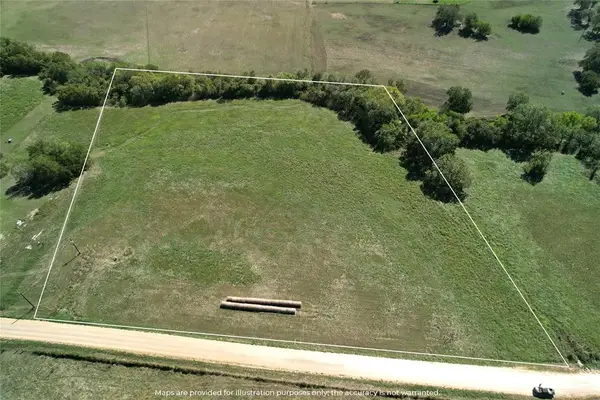 $320,000Active8 Acres
5568 Bleiblerville Road, Bleiblerville, TX 78931
MLS# 26471176Listed by: EXECUTIVE REAL ESTATE
Local realty services provided by:CENTURY 21 Lucky Money Real Estate
Copyright 2026, Houston Realtors Information Service, Inc. All information provided is deemed reliable but is not guaranteed and should be independently verified. IDX information is provided exclusively for consumers' personal, non-commercial use, it may not be used for any purpose other than to identify prospective properties consumers may be interested in purchasing, and the data is deemed reliable but is not guaranteed accurate by the MLS.
Popular searches near 78931
Popular neighborhoods near 78931
- Apache Hills, Somerville homes for sale
- Caldwell, Caldwell homes for sale
- Castle Rock, College Station homes for sale
- Castlegate, College Station homes for sale
- Duck Haven Estates, College Station homes for sale
- Edelweiss Gardens, College Station homes for sale
- Great Oak Estates, College Station homes for sale
- Lyons, Somerville homes for sale
- Nantucket, College Station homes for sale
- Rolling Ridge Mobile Home Park, College Station homes for sale
- Snook, Somerville homes for sale
- Somerville, Somerville homes for sale
- Sonoma, College Station homes for sale
- Southern Trace, College Station homes for sale
- Texas World Speedway, College Station homes for sale
- The Village of Indian Lakes, College Station homes for sale
- Wellborn, College Station homes for sale
- Westfield Village, College Station homes for sale
- Williams Gate, College Station homes for sale
- Willow Creek Farms, Brookshire homes for sale
Protect your home and budget from life's surprises with an Assurant Home Warranty, backed by a partner that supports you through every step of homeownership. Explore Plans.
©2026 Century 21 Real Estate LLC. All rights reserved. CENTURY 21®, the CENTURY 21 Logo and C21® are service marks owned by Century 21 Real Estate LLC. Century 21 Real Estate LLC fully supports the principles of the Fair Housing Act and the Equal Opportunity Act. Each office is independently owned and operated. Listing information is deemed reliable but not guaranteed accurate.