- Appalachian Ski Mountain, Blowing Rock homes for sale
- Blue Ridge Mountain Club, Elk homes for sale
- Burke Mountains, Morganton homes for sale
- Headwaters, Elk Park homes for sale
- Hound Ears, Boone homes for sale
- Jefferson Landing on the New River, Jefferson homes for sale
- Lake James, Linville homes for sale
- Lake Tomahawk, Black Mountain homes for sale
- Laurel Ridge, Black Mountain homes for sale
- Linville Ridge, Linville homes for sale
- Lower Creek, Morganton homes for sale
- Montreat, Black Mountain homes for sale
- North Asheville, Asheville homes for sale
- Quaker Meadows, Morganton homes for sale
- Reynolds Mountain, Asheville homes for sale
- Ridgecrest, Black Mountain homes for sale
- Sherwood Heights, Asheville homes for sale
- The Lodges at Eagles Nest, Banner Elk homes for sale
- Town Mountain Preserve, Asheville homes for sale
- Upper Creek, Morganton homes for sale
Blountville, TN - homes for sale
29 of 29 results displayed
 $408,955Active4 beds 3 baths2,804 sq. ft.
280 Chimney View Loop, Blountville, TN 37617
MLS# 9992255Listed by: D.R. HORTON NORTHEAST TN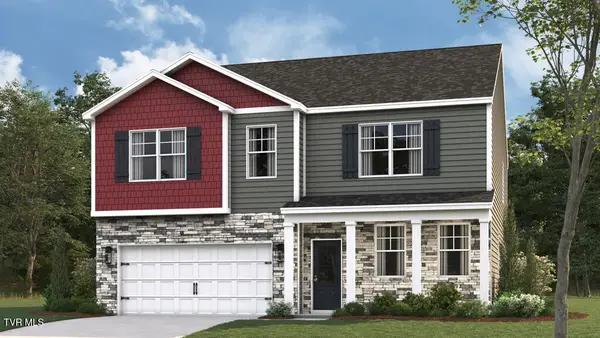 $408,955Active4 beds 3 baths2,804 sq. ft.
273 Chimney View Loop, Blountville, TN 37617
MLS# 9992257Listed by: D.R. HORTON NORTHEAST TN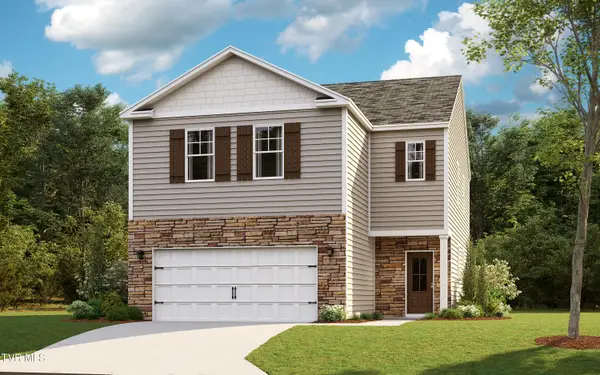 $376,665Active4 beds 3 baths2,174 sq. ft.
277 Chimney View Loop, Blountville, TN 37617
MLS# 9992262Listed by: D.R. HORTON NORTHEAST TN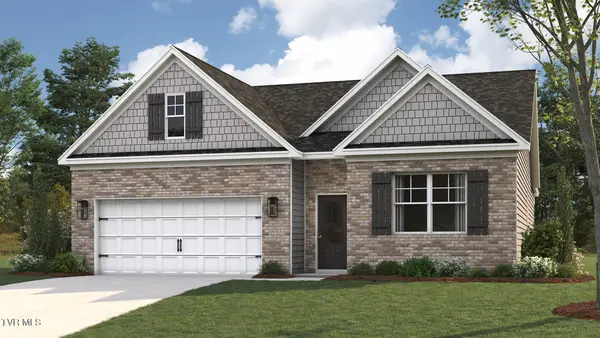 $360,375Active4 beds 2 baths1,774 sq. ft.
269 Chimney View Loop, Blountville, TN 37617
MLS# 9992264Listed by: D.R. HORTON NORTHEAST TN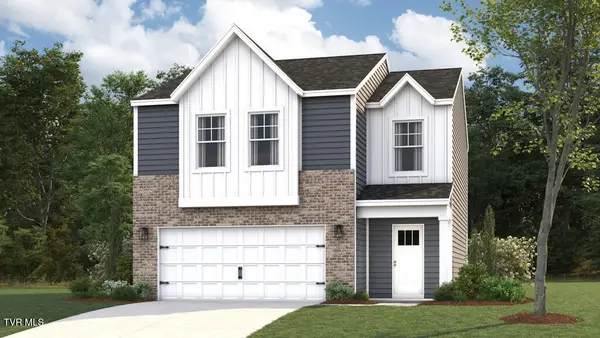 $340,735Active3 beds 3 baths1,645 sq. ft.
281 Chimney View Loop, Blountville, TN 37617
MLS# 9992634Listed by: D.R. HORTON NORTHEAST TN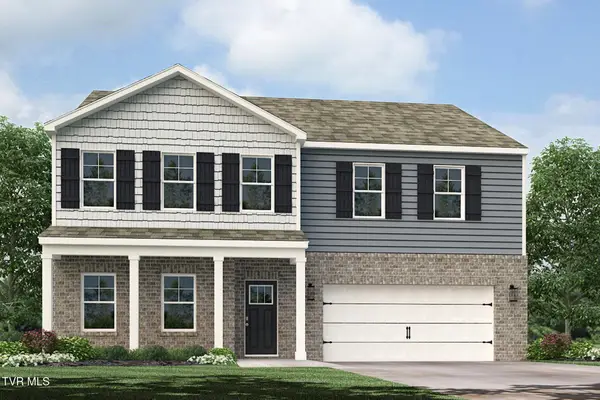 $443,190Active4 beds 4 baths3,122 sq. ft.
284 Chimney View Loop, Blountville, TN 37617
MLS# 9992637Listed by: D.R. HORTON NORTHEAST TN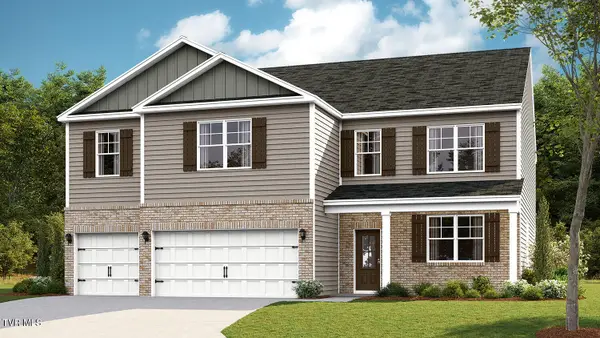 $498,285Active5 beds 4 baths4,023 sq. ft.
285 Chimney View Loop, Blountville, TN 37617
MLS# 9992642Listed by: D.R. HORTON NORTHEAST TN $360,375Active4 beds 2 baths1,774 sq. ft.
260 Chimney View Loop, Blountville, TN 37617
MLS# 9991522Listed by: D.R. HORTON NORTHEAST TN $352,375Active4 beds 2 baths1,774 sq. ft.
264 Chimney View Loop, Blountville, TN 37617
MLS# 9991521Listed by: D.R. HORTON NORTHEAST TN $404,075Active4 beds 3 baths2,618 sq. ft.
265 Chimney View Loop, Blountville, TN 37617
MLS# 9991097Listed by: D.R. HORTON NORTHEAST TN $356,850Active3 beds 3 baths1,749 sq. ft.
261 Chimney View Loop, Blountville, TN 37617
MLS# 9991098Listed by: D.R. HORTON NORTHEAST TN $358,375Pending4 beds 2 baths1,774 sq. ft.
257 Chimney View Loop, Blountville, TN 37617
MLS# 9991099Listed by: D.R. HORTON NORTHEAST TN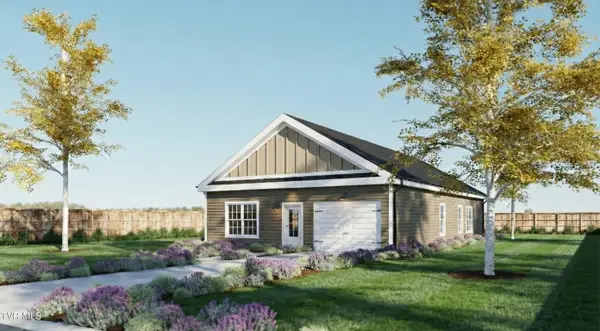 $279,000Pending3 beds 2 baths1,469 sq. ft.
4255 Gambrel Oaks Street, Blountville, TN 37617
MLS# 9989917Listed by: KW JOHNSON CITY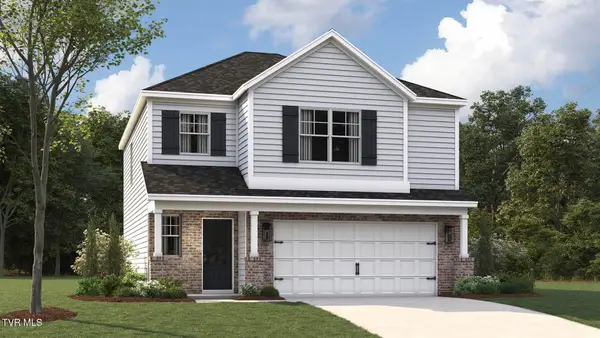 $356,850Active3 beds 3 baths1,749 sq. ft.
248 Chimney View Loop, Blountville, TN 37617
MLS# 9989801Listed by: D.R. HORTON NORTHEAST TN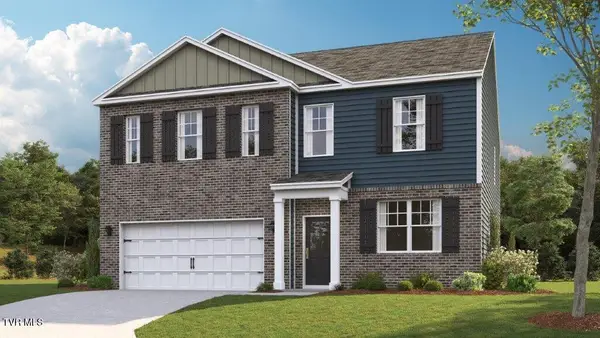 $404,000Active4 beds 3 baths2,804 sq. ft.
256 Chimney View Loop, Blountville, TN 37617
MLS# 9989803Listed by: D.R. HORTON NORTHEAST TN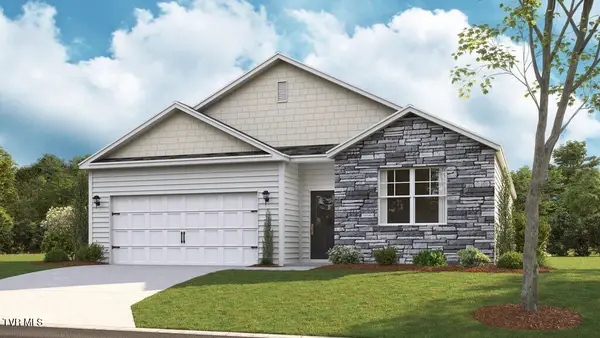 $352,375Active4 beds 2 baths1,774 sq. ft.
252 Chimney View Loop, Blountville, TN 37617
MLS# 9989805Listed by: D.R. HORTON NORTHEAST TN $376,665Active4 beds 3 baths2,174 sq. ft.
249 Chimney View Loop, Blountville, TN 37617
MLS# 9988889Listed by: D.R. HORTON NORTHEAST TN $406,875Pending4 beds 3 baths2,618 sq. ft.
253 Chimney View Loop, Blountville, TN 37617
MLS# 9988890Listed by: D.R. HORTON NORTHEAST TN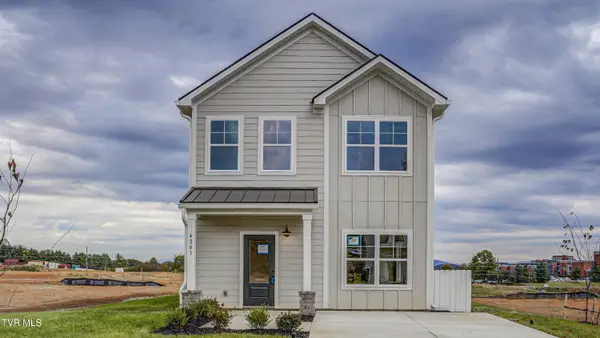 $282,500Active3 beds 3 baths1,364 sq. ft.
4201 Gambrel Oaks Street, Blountville, TN 37617
MLS# 9988621Listed by: KW JOHNSON CITY $279,000Active3 beds 3 baths1,364 sq. ft.
4196 Gambrel Oaks Street, Blountville, TN 37617
MLS# 9988622Listed by: KW JOHNSON CITY $402,075Active4 beds 3 baths2,618 sq. ft.
236 Chimney View Loop, Blountville, TN 37617
MLS# 9988450Listed by: D.R. HORTON NORTHEAST TN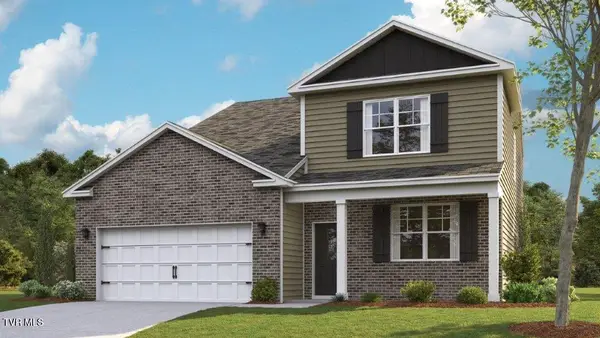 $407,075Active4 beds 3 baths2,618 sq. ft.
237 Chimney View Loop, Blountville, TN 37617
MLS# 9988451Listed by: D.R. HORTON NORTHEAST TN $405,075Pending4 beds 3 baths2,618 sq. ft.
244 Chimney View Loop, Blountville, TN 37617
MLS# 9988452Listed by: D.R. HORTON NORTHEAST TN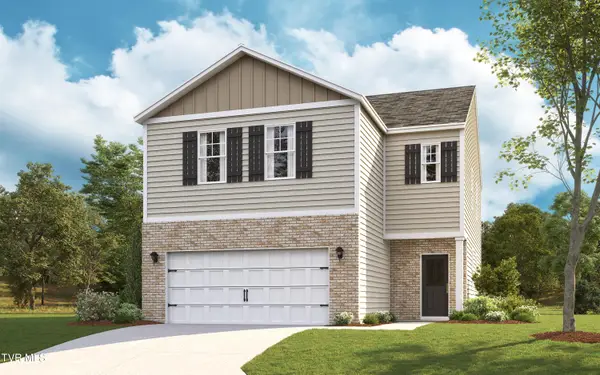 $375,665Pending4 beds 3 baths2,174 sq. ft.
240 Chimney View Loop, Blountville, TN 37617
MLS# 9988453Listed by: D.R. HORTON NORTHEAST TN $403,955Active4 beds 3 baths2,804 sq. ft.
233 Chimney View Loop, Blountville, TN 37617
MLS# 9988454Listed by: D.R. HORTON NORTHEAST TN $272,500Pending3 beds 3 baths1,364 sq. ft.
4268 Gambrel Oaks Street, Blountville, TN 37617
MLS# 9987554Listed by: KW JOHNSON CITY $354,000Active3 beds 3 baths1,749 sq. ft.
232 Chimney View Loop, Blountville, TN 37617
MLS# 9986143Listed by: D.R. HORTON NORTHEAST TN $372,465Active4 beds 3 baths2,174 sq. ft.
224 Chimney View Loop, Blountville, TN 37617
MLS# 9986141Listed by: D.R. HORTON NORTHEAST TN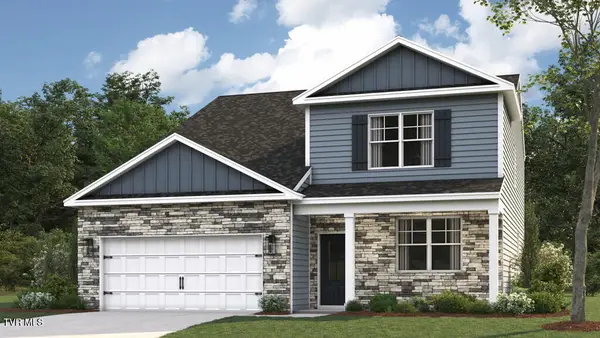 $405,875Active4 beds 3 baths2,618 sq. ft.
225 Chimney View Loop, Blountville, TN 37617
MLS# 9985941Listed by: D.R. HORTON NORTHEAST TN
Local realty services provided by:CENTURY 21 Legacy
Neighborhoods near Blountville, TN
Zip codes near Blountville, TN
- 24201 homes for sale
- 24202 homes for sale
- 24258 homes for sale
- 24270 homes for sale
- 24271 homes for sale
- 24290 homes for sale
- 37601 homes for sale
- 37604 homes for sale
- 37615 homes for sale
- 37617 homes for sale
- 37618 homes for sale
- 37620 homes for sale
- 37643 homes for sale
- 37656 homes for sale
- 37660 homes for sale
- 37663 homes for sale
- 37664 homes for sale
- 37665 homes for sale
- 37686 homes for sale
- 37694 homes for sale
Popular searches near Blountville, TN
- Biltmore homes for sale
- Bloomingdale homes for sale
- Bluff City homes for sale
- Bristol homes for sale
- Bristol homes for sale
- Bristol homes for sale
- Colonial Heights homes for sale
- Gray homes for sale
- Hiltons homes for sale
- Hunter homes for sale
- Johnson City homes for sale
- Kingsport homes for sale
- Mendota homes for sale
- Oak Grove homes for sale
- Orebank homes for sale
- Piney Flats homes for sale
- Spurgeon homes for sale
- Tyler homes for sale
- Walnut Hill homes for sale
- Watauga homes for sale
Protect your home and budget from life's surprises with an Assurant Home Warranty, backed by a partner that supports you through every step of homeownership. Explore Plans.
©2026 Century 21 Real Estate LLC. All rights reserved. CENTURY 21®, the CENTURY 21 Logo and C21® are service marks owned by Century 21 Real Estate LLC. Century 21 Real Estate LLC fully supports the principles of the Fair Housing Act and the Equal Opportunity Act. Each office is independently owned and operated. Listing information is deemed reliable but not guaranteed accurate.